| Param | Original file | Final file |
|---|---|---|
| Filename | modeM0/AS1A12_037T01_9000005736_42045cztM0_level2.fits | modeM0/AS1A12_037T01_9000005736_42045cztM0_level2_quad_clean.evt |
| Size (bytes) | 516,775,680 | 78,984,000 |
| Size | 492.8 MB | 75.3 MB |
| Events in quadrant A | 10,064,142 | 296,012 |
| Events in quadrant B | 2,509,740 | 615,071 |
| Events in quadrant C | 2,544,136 | 585,286 |
| Events in quadrant D | 3,579,663 | 507,436 |
| Mode SS | |||
|---|---|---|---|
| Quadrant | BADHDUFLAG | Total packets | Discarded packets |
| A | 0 | 112 | 0 |
| B | 0 | 112 | 0 |
| C | 0 | 112 | 0 |
| D | 0 | 112 | 0 |
| Mode M0 | |||
|---|---|---|---|
| Quadrant | BADHDUFLAG | Total packets | Discarded packets |
| A | 0 | 33703 | 1 |
| B | 0 | 11422 | 1 |
| C | 0 | 11151 | 1 |
| D | 0 | 14584 | 6 |
| Mode M9 | |||
|---|---|---|---|
| Quadrant | BADHDUFLAG | Total packets | Discarded packets |
| A | 0 | 13 | 0 |
| B | 0 | 13 | 0 |
| C | 0 | 13 | 0 |
| D | 0 | 13 | 0 |
| Quadrant | Total seconds | Saturated seconds | Saturation percentage |
|---|---|---|---|
| A | 5541 | 3019 | 54.484750% |
| B | 5541 | 27 | 0.487277% |
| C | 5541 | 4 | 0.072189% |
| D | 5541 | 365 | 6.587259% |
Noise dominated data is calculated using 1-second bins in cleaned event files. If a bin has >2000 counts, and if more than 50% of those come from <1% of pixels, then it is considered to be noise-dominated and hence unusable.
| Quadrant | # 1 sec bins | Bins with >0 counts | Bins with >2000 counts | High rate bins dominated by noise | Noise dominated (total time) | Noise dominated (detector-on time) | Marked lightcurve |
|---|---|---|---|---|---|---|---|
| A | 6854 | 5541 | 2637 | 2637 | 38.47% | 47.59% | 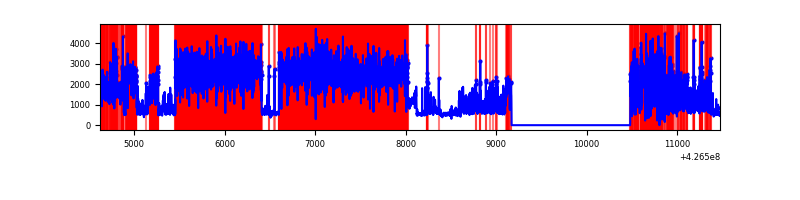 |
| B | 6854 | 5542 | 15 | 15 | 0.22% | 0.27% | 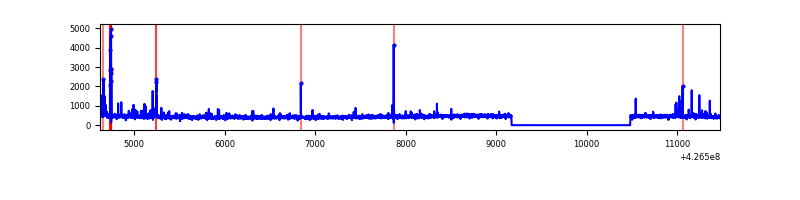 |
| C | 6854 | 5542 | 1 | 1 | 0.01% | 0.02% | 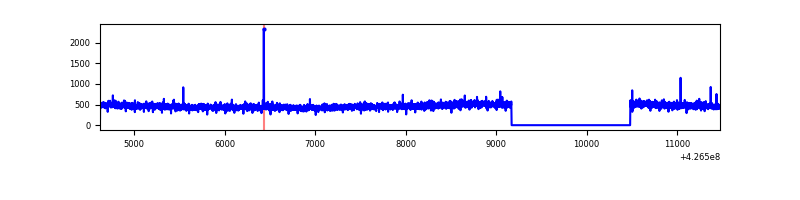 |
| D | 6854 | 5542 | 314 | 314 | 4.58% | 5.67% | 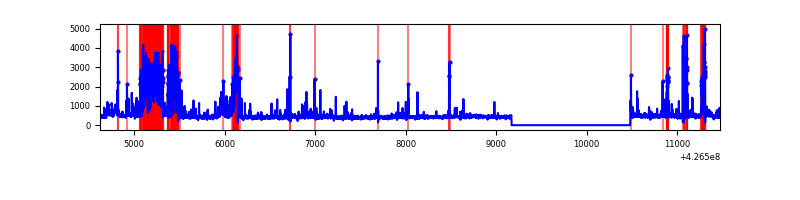 |
Top three noisy pixels from each quadrant. If the there are fewer than three noisy pixels in the level2.evt file, extra rows are filled as -1
| Pixel properties | Quadrant properties | ||||||
|---|---|---|---|---|---|---|---|
| Quadrant | DetID | PixID | Counts | Sigma | Mean | Median | Sigma |
| A | 15 | 223 | 7343648 | 76772.38 | 456 | 446 | 95.6 |
| A | 10 | 83 | 395090 | 4125.96 | 456 | 446 | 95.6 |
| A | 15 | 222 | 364281 | 3803.86 | 456 | 446 | 95.6 |
| B | 5 | 255 | 60904 | 513.11 | 600 | 583 | 117.6 |
| B | 15 | 35 | 32625 | 272.56 | 600 | 583 | 117.6 |
| B | 15 | 85 | 26434 | 219.9 | 600 | 583 | 117.6 |
| C | 15 | 214 | 229640 | 1651.65 | 589 | 591 | 138.7 |
| C | 12 | 249 | 14742 | 102.04 | 589 | 591 | 138.7 |
| C | 13 | 61 | 4121 | 25.45 | 589 | 591 | 138.7 |
| D | 12 | 233 | 697133 | 4949.99 | 572 | 556 | 140.7 |
| D | 1 | 52 | 300544 | 2131.77 | 572 | 556 | 140.7 |
| D | 5 | 32 | 144561 | 1023.32 | 572 | 556 | 140.7 |
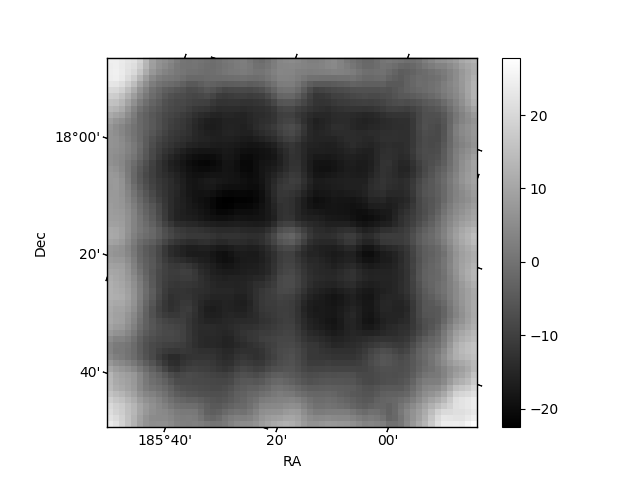
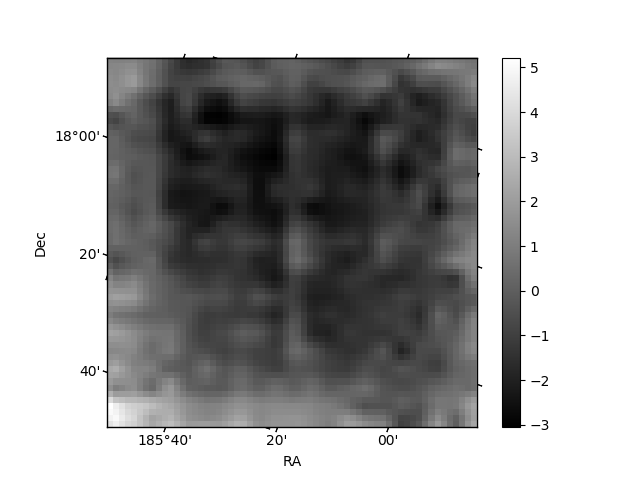
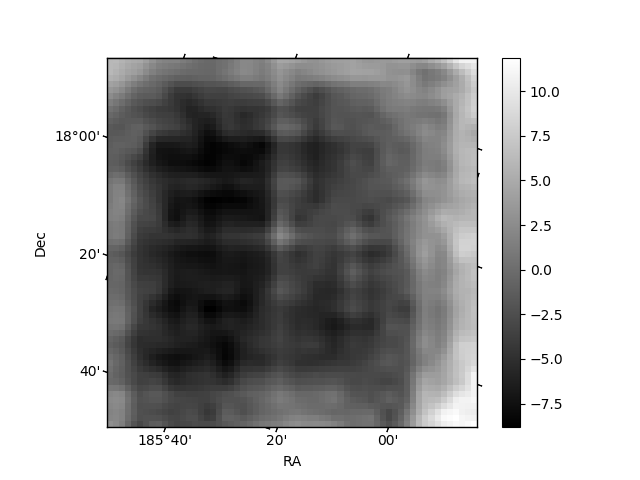
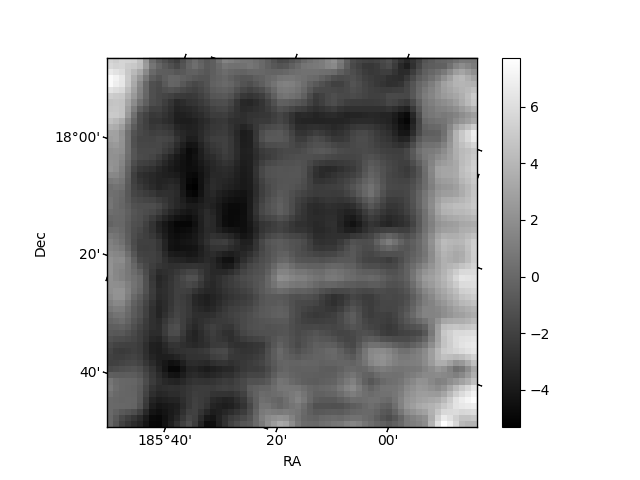
Histogram calculated using DETX and DETY for each event in the final _common_clean file
| Quadrant A | 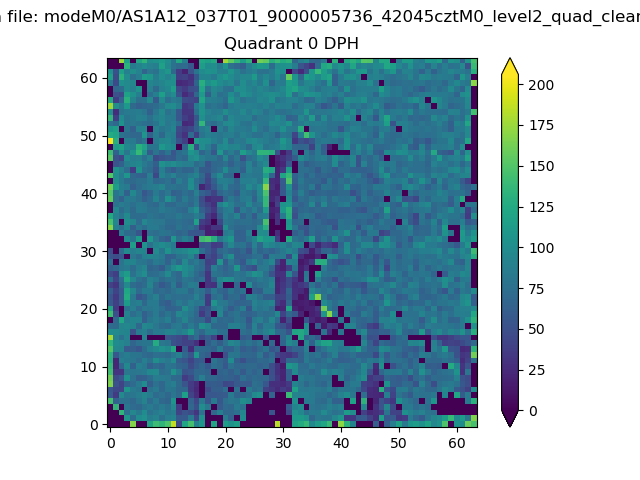 |
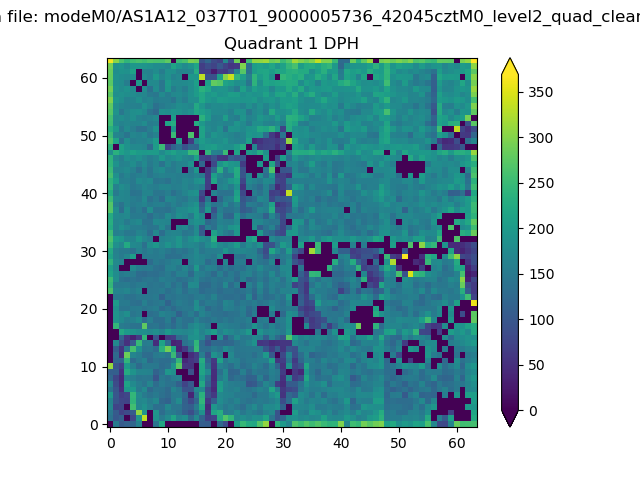 |
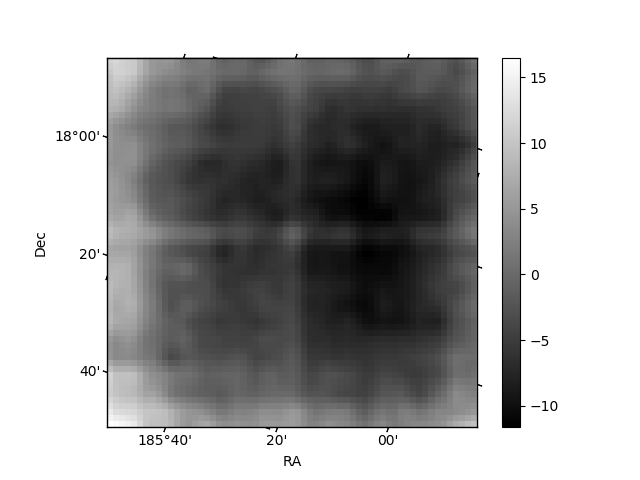
Quadrant B |
|---|---|---|---|
| Quadrant D | 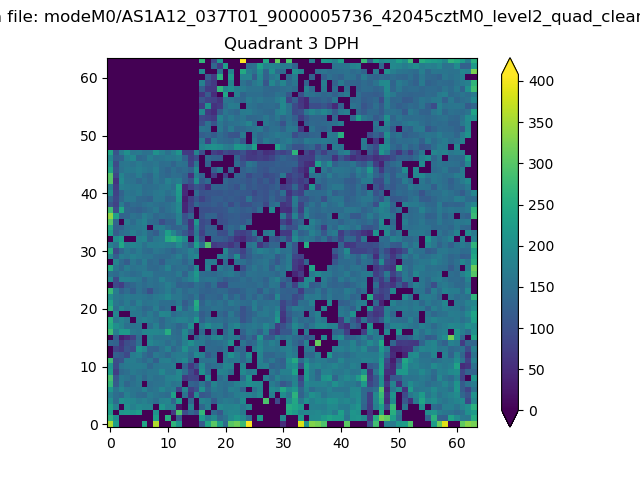 |
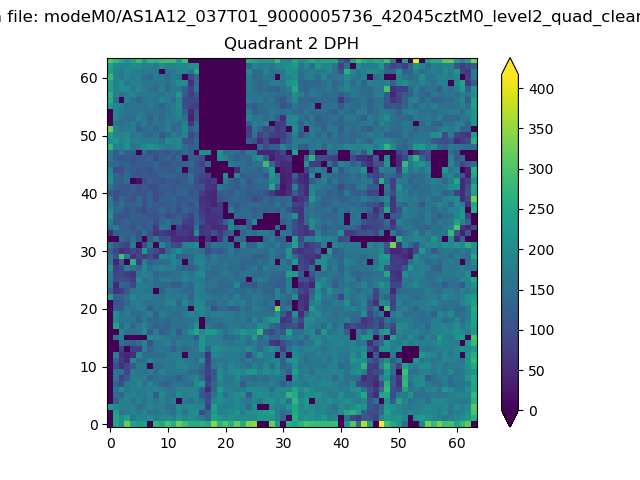 |
Quadrant C |
| Plot type | Count rate plots | Images |
|---|---|---|
| Comparison with Poisson distribution Blue bars denote a histogram of data divided into 1 sec bins. Red curve is a Poisson curve with rate = median count rate of data. |
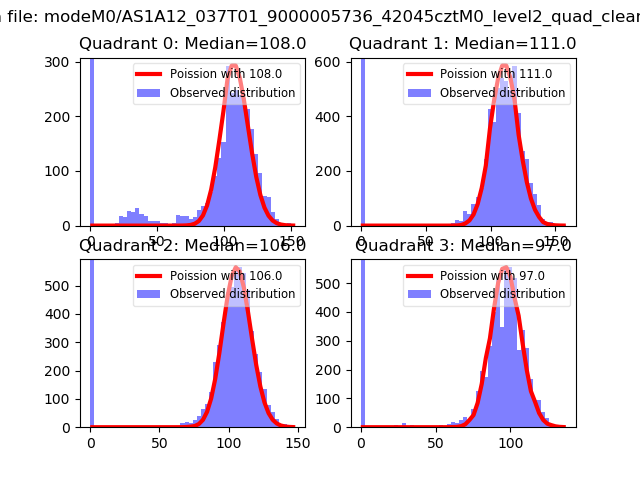 |
 |
| Quadrant-wise count rates Data is divided into 100 sec bins |
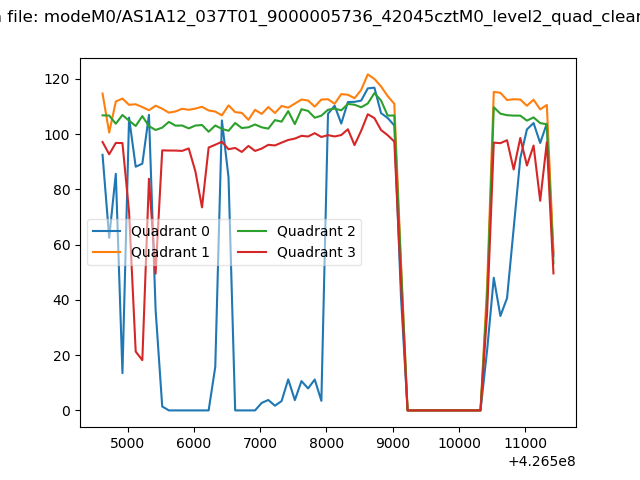 |
|
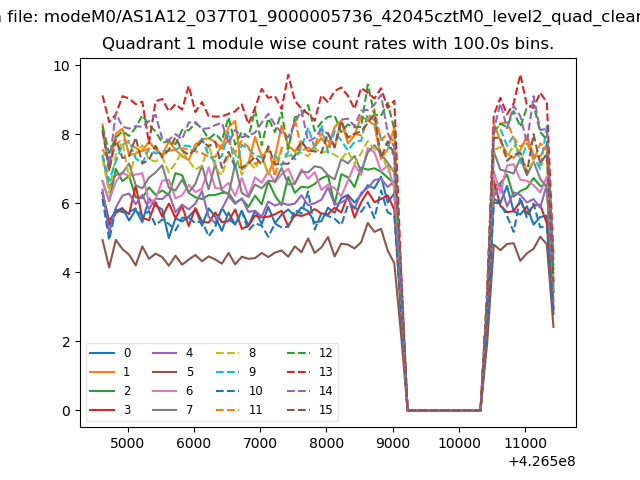
| Module-wise count rates for Quadrant A Data is divided into 100 sec bins |
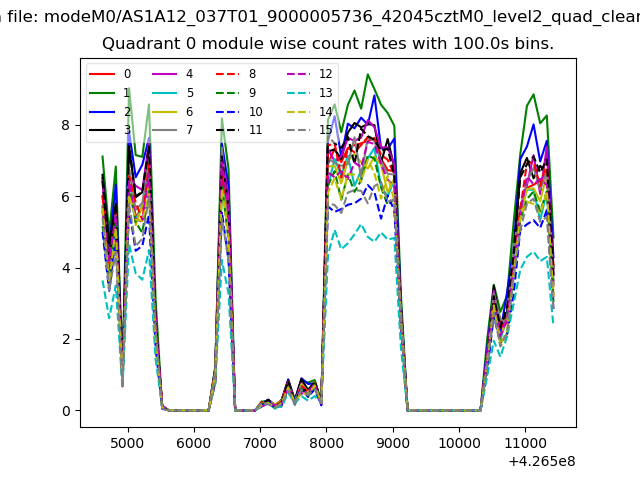 |
 |
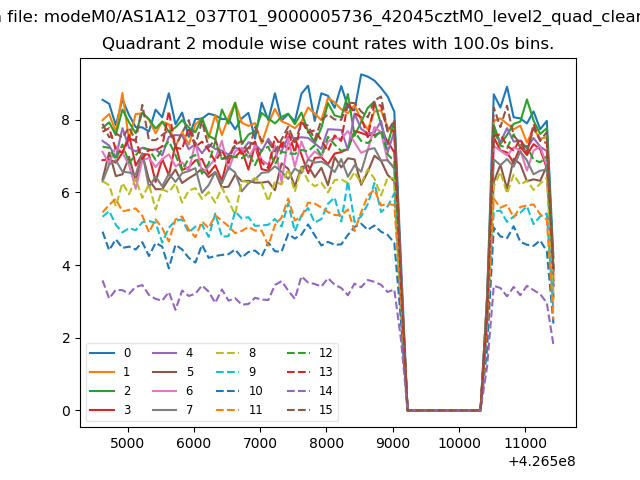
| Module-wise count rates for Quadrant B Data is divided into 100 sec bins |
 |
 |
| Module-wise count rates for Quadrant C Data is divided into 100 sec bins |
 |
 |
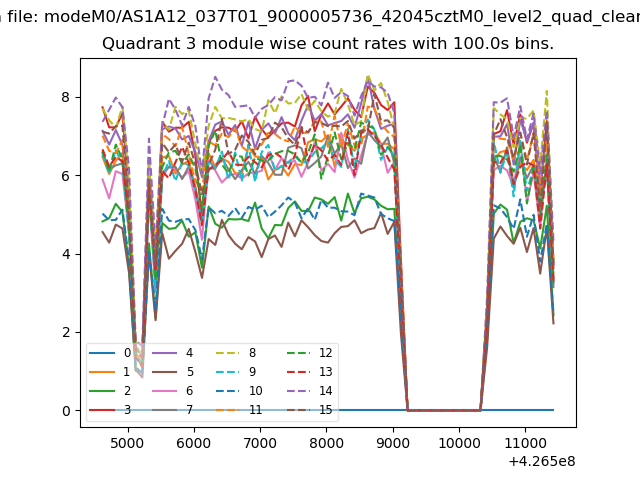
| Module-wise count rates for Quadrant D Data is divided into 100 sec bins |
 |
 |
| Parameter | Plot |
|---|---|
| CZT HV Monitor | 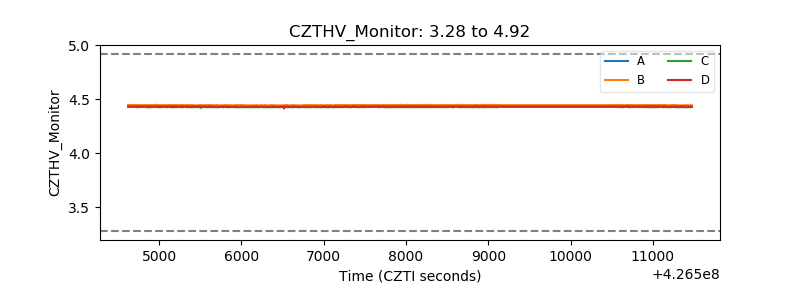 |
| D_VDD | 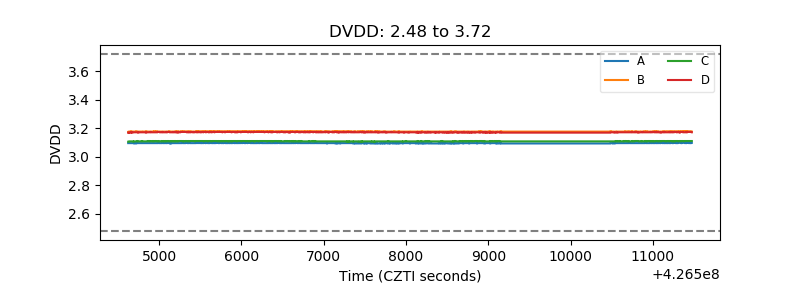 |
| Temperature 1 | 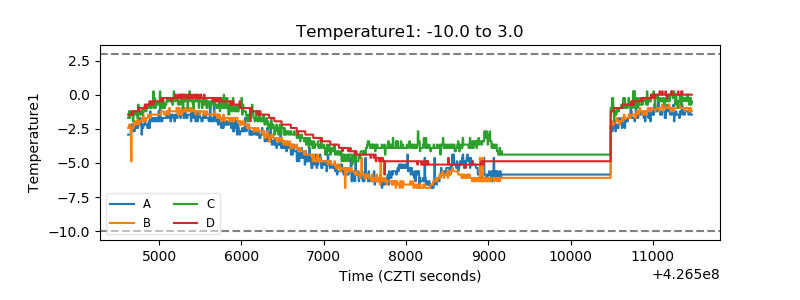 |
| Veto HV Monitor | 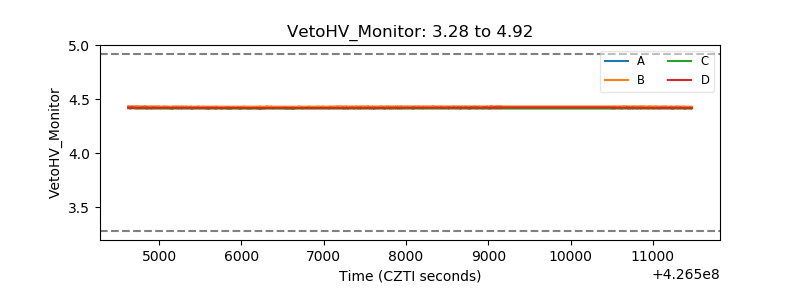 |
| Veto LLD | 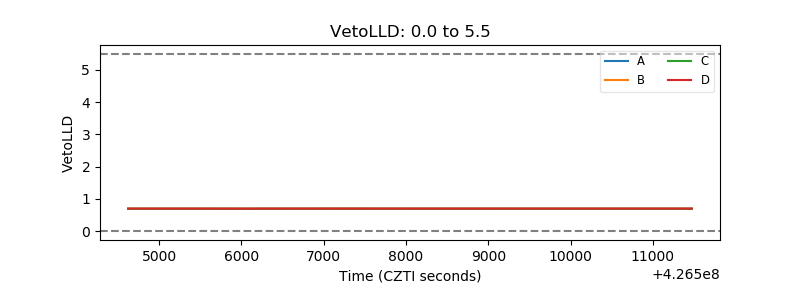 |
| Alpha Counter | 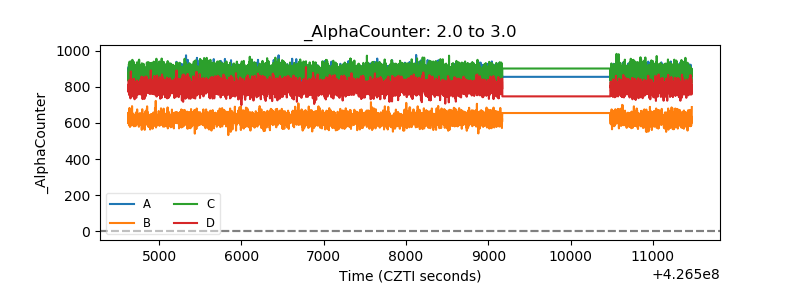 |
| _CPM_Rate | 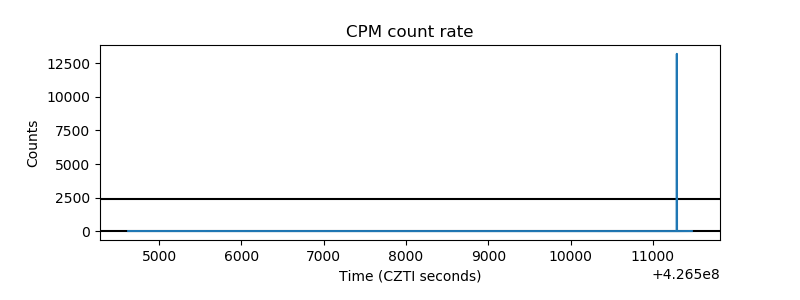 |
| CZT Counter | 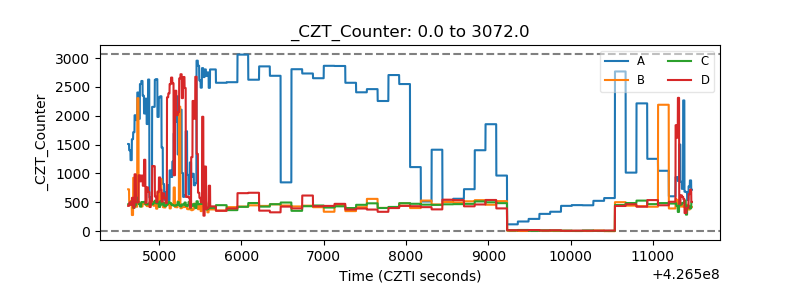 |
| +2.5 Volts monitor | 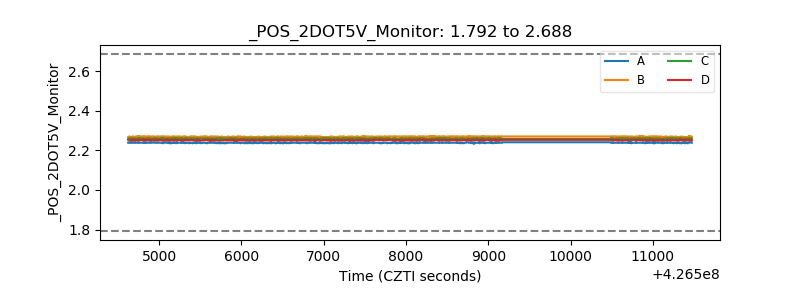 |
| +5 Volts monitor | 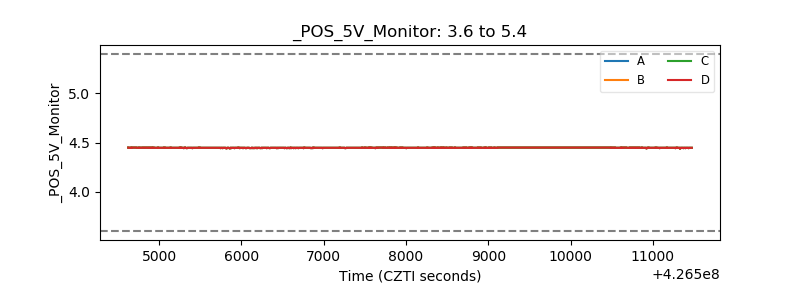 |
| _ROLL_ROT |  |
| _Roll_DEC | 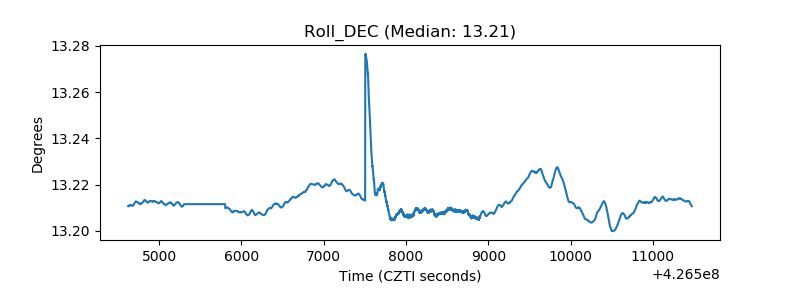 |
| _Roll_RA | 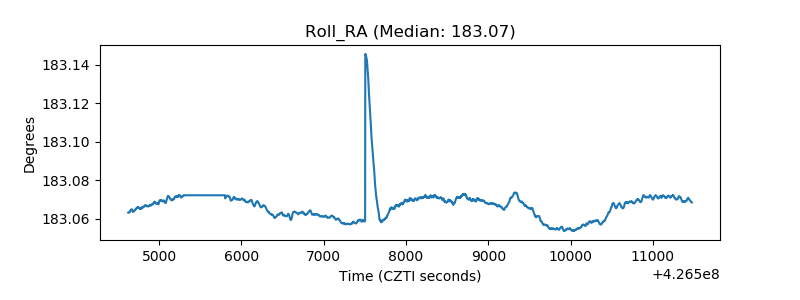 |
| Veto Counter | 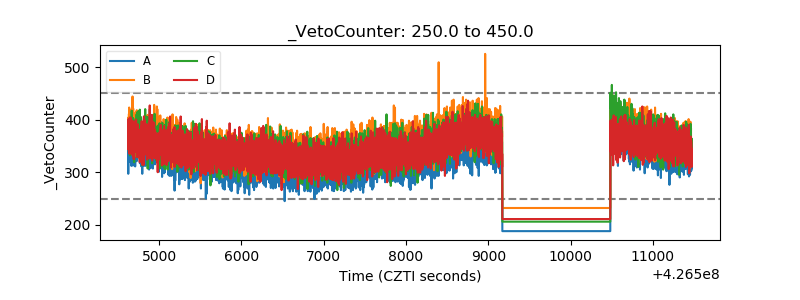 |