| Param | Original file | Final file |
|---|---|---|
| Filename | modeM0/AS1A12_037T01_9000005736_42049cztM0_level2.fits | modeM0/AS1A12_037T01_9000005736_42049cztM0_level2_quad_clean.evt |
| Size (bytes) | 204,940,800 | 39,265,920 |
| Size | 195.4 MB | 37.4 MB |
| Events in quadrant A | 3,262,377 | 235,234 |
| Events in quadrant B | 1,248,227 | 273,763 |
| Events in quadrant C | 1,135,945 | 262,508 |
| Events in quadrant D | 1,740,639 | 235,135 |
| Mode SS | |||
|---|---|---|---|
| Quadrant | BADHDUFLAG | Total packets | Discarded packets |
| A | 0 | 52 | 0 |
| B | 0 | 52 | 0 |
| C | 0 | 52 | 0 |
| D | 0 | 52 | 0 |
| Mode M0 | |||
|---|---|---|---|
| Quadrant | BADHDUFLAG | Total packets | Discarded packets |
| A | 0 | 11448 | 1 |
| B | 0 | 5533 | 1 |
| C | 0 | 5102 | 1 |
| D | 0 | 6881 | 1 |
| Quadrant | Total seconds | Saturated seconds | Saturation percentage |
|---|---|---|---|
| A | 2535 | 477 | 18.816568% |
| B | 2535 | 37 | 1.459566% |
| C | 2535 | 1 | 0.039448% |
| D | 2536 | 117 | 4.613565% |
Noise dominated data is calculated using 1-second bins in cleaned event files. If a bin has >2000 counts, and if more than 50% of those come from <1% of pixels, then it is considered to be noise-dominated and hence unusable.
| Quadrant | # 1 sec bins | Bins with >0 counts | Bins with >2000 counts | High rate bins dominated by noise | Noise dominated (total time) | Noise dominated (detector-on time) | Marked lightcurve |
|---|---|---|---|---|---|---|---|
| A | 2535 | 2534 | 357 | 357 | 14.08% | 14.09% | 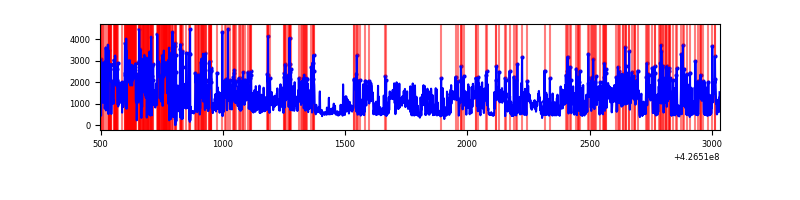 |
| B | 2535 | 2535 | 41 | 41 | 1.62% | 1.62% | 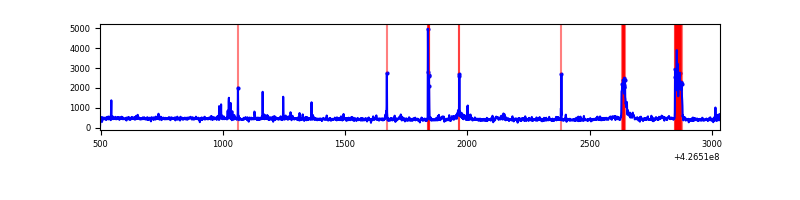 |
| C | 2535 | 2535 | 0 | 0 | 0.00% | 0.00% | 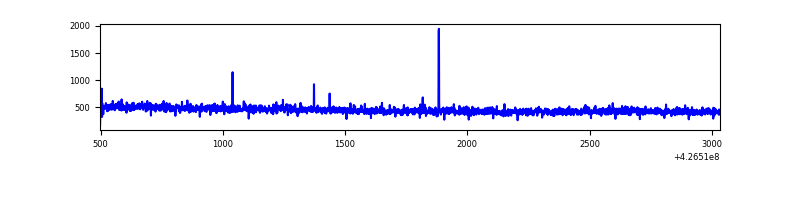 |
| D | 2536 | 2536 | 104 | 104 | 4.10% | 4.10% | 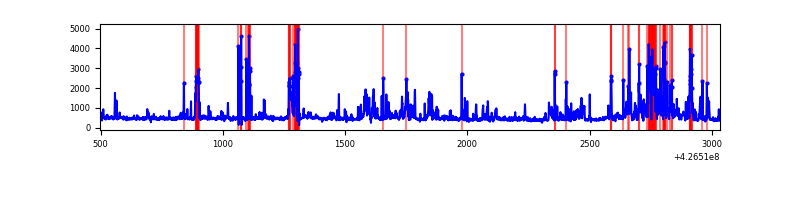 |
Top three noisy pixels from each quadrant. If the there are fewer than three noisy pixels in the level2.evt file, extra rows are filled as -1
| Pixel properties | Quadrant properties | ||||||
|---|---|---|---|---|---|---|---|
| Quadrant | DetID | PixID | Counts | Sigma | Mean | Median | Sigma |
| A | 15 | 223 | 1962926 | 37507.89 | 246 | 241 | 52.3 |
| A | 10 | 83 | 260663 | 4976.79 | 246 | 241 | 52.3 |
| A | 12 | 189 | 72671 | 1384.17 | 246 | 241 | 52.3 |
| B | 5 | 32 | 121405 | 2280.79 | 262 | 256 | 53.1 |
| B | 0 | 156 | 34414 | 643.07 | 262 | 256 | 53.1 |
| B | 5 | 255 | 20864 | 387.97 | 262 | 256 | 53.1 |
| C | 15 | 214 | 110926 | 1767.31 | 260 | 261 | 62.6 |
| C | 12 | 249 | 8855 | 137.25 | 260 | 261 | 62.6 |
| C | 13 | 61 | 1803 | 24.63 | 260 | 261 | 62.6 |
| D | 1 | 52 | 557930 | 8466.28 | 259 | 250 | 65.9 |
| D | 5 | 32 | 55492 | 838.64 | 259 | 250 | 65.9 |
| D | 13 | 249 | 41983 | 633.56 | 259 | 250 | 65.9 |
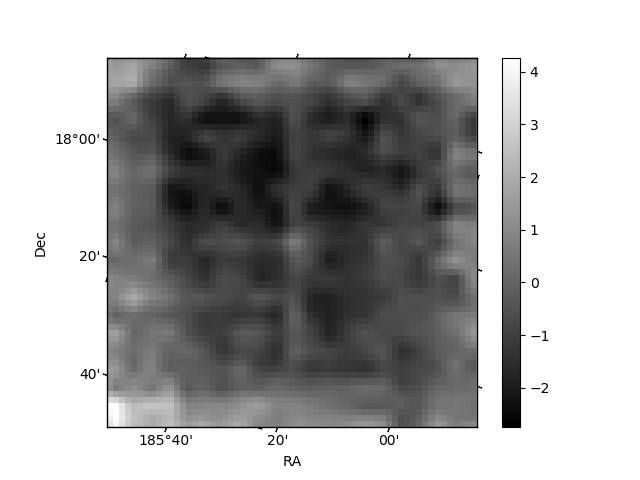
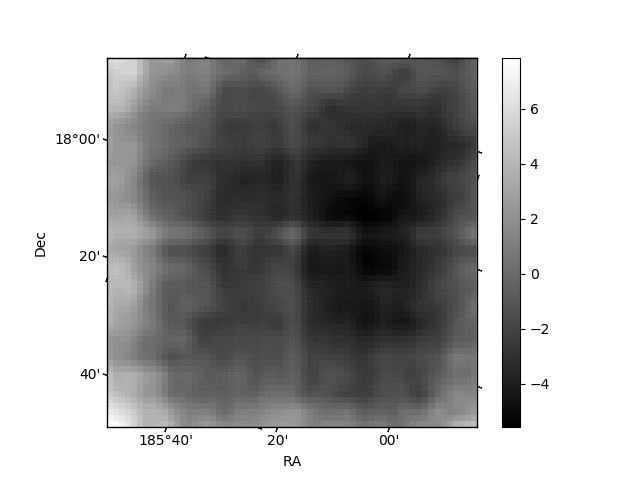
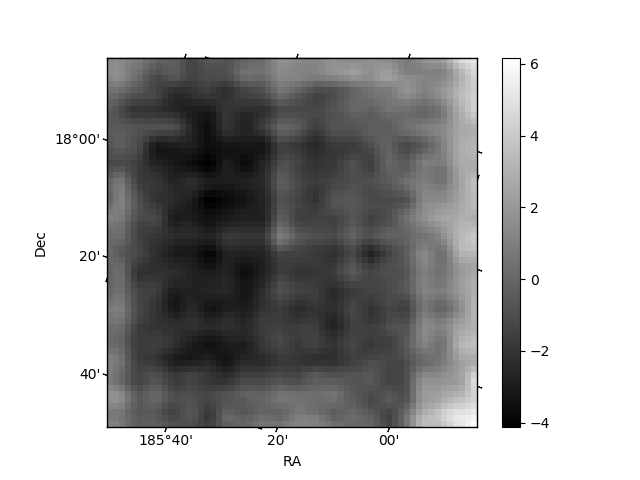
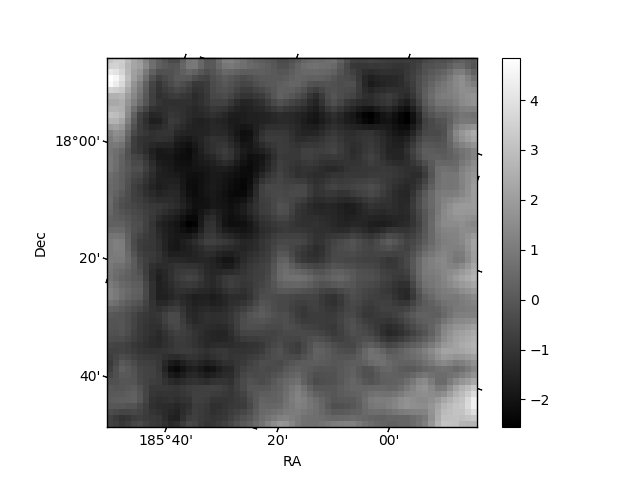
Histogram calculated using DETX and DETY for each event in the final _common_clean file
| Quadrant A | 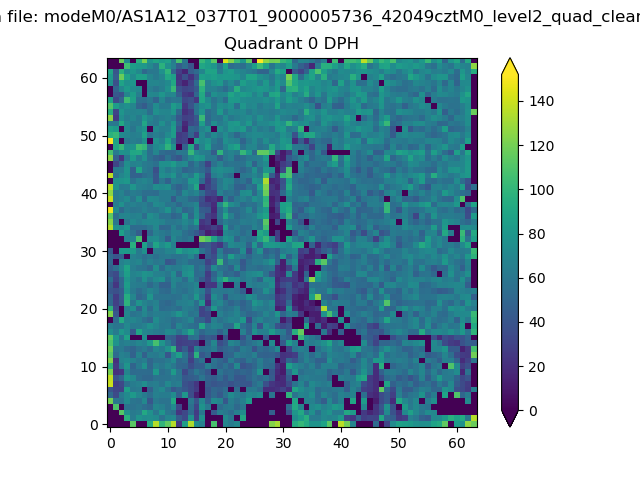 |
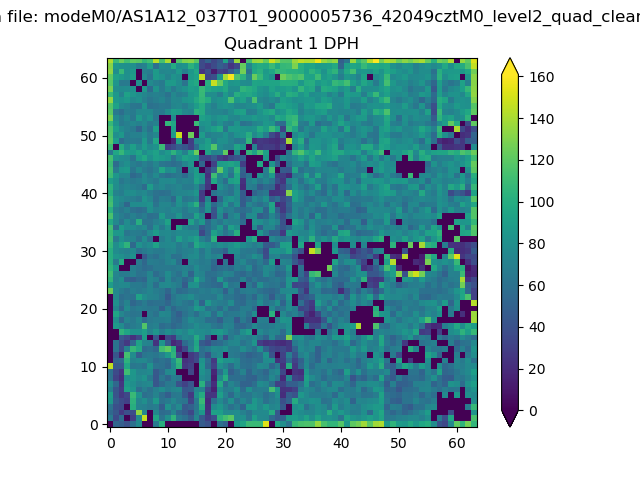 |
Quadrant B |
|---|---|---|---|
| Quadrant D | 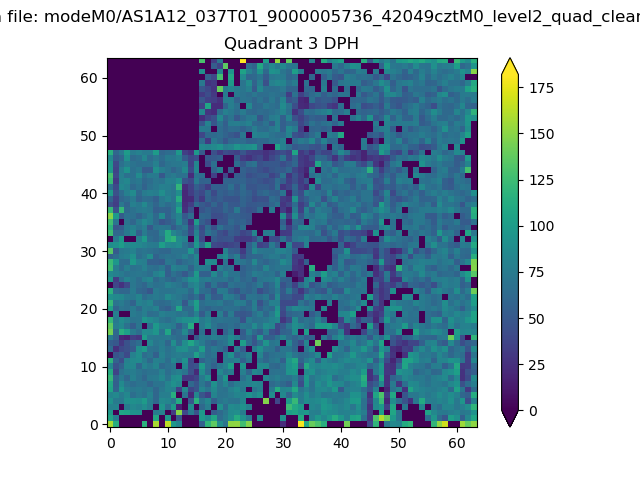 |
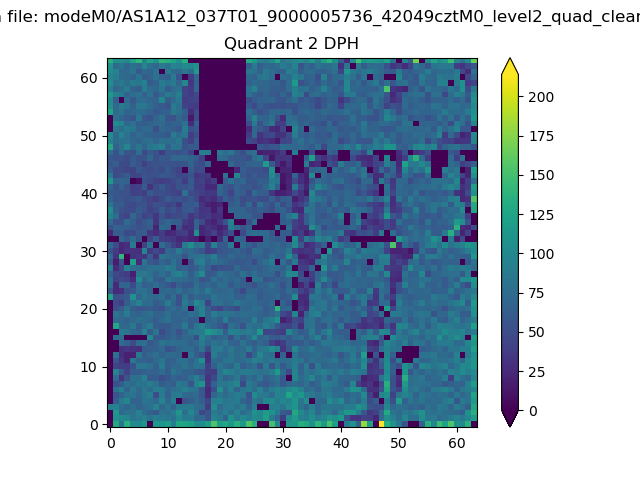 |
Quadrant C |
| Plot type | Count rate plots | Images |
|---|---|---|
| Comparison with Poisson distribution Blue bars denote a histogram of data divided into 1 sec bins. Red curve is a Poisson curve with rate = median count rate of data. |
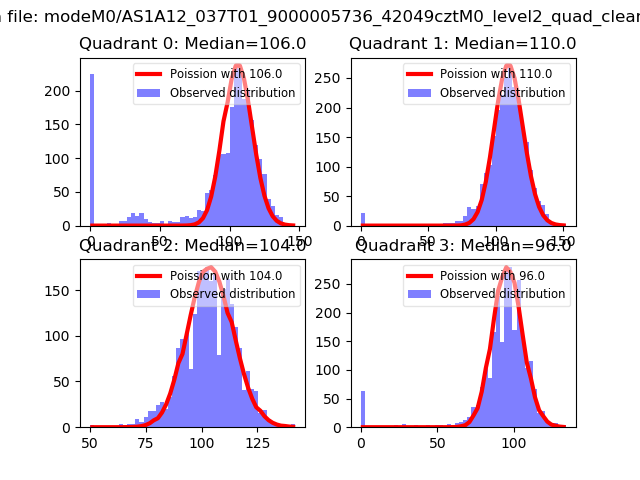 |
 |
| Quadrant-wise count rates Data is divided into 100 sec bins |
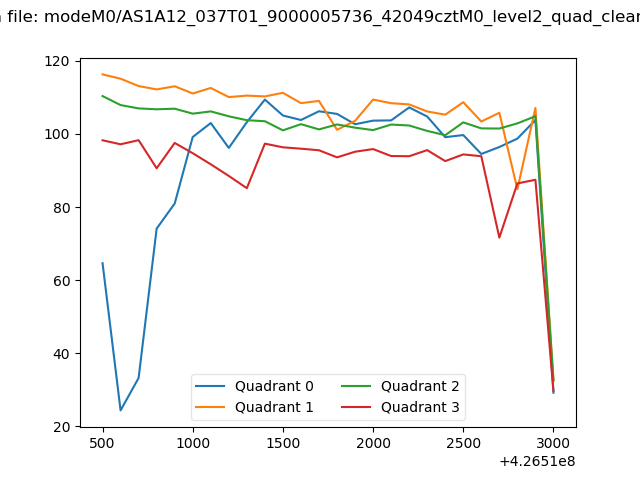 |
|
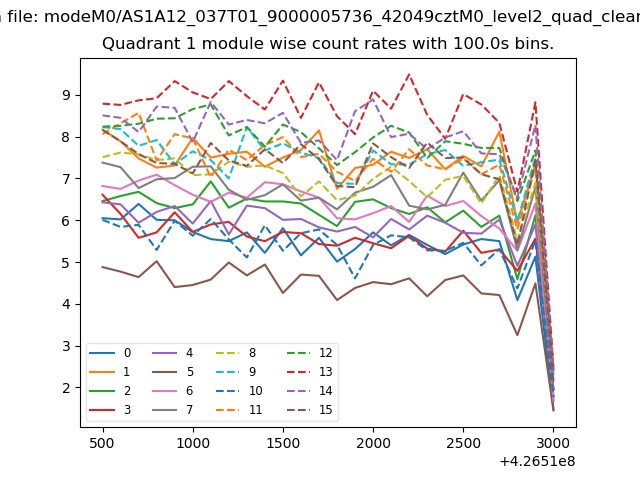
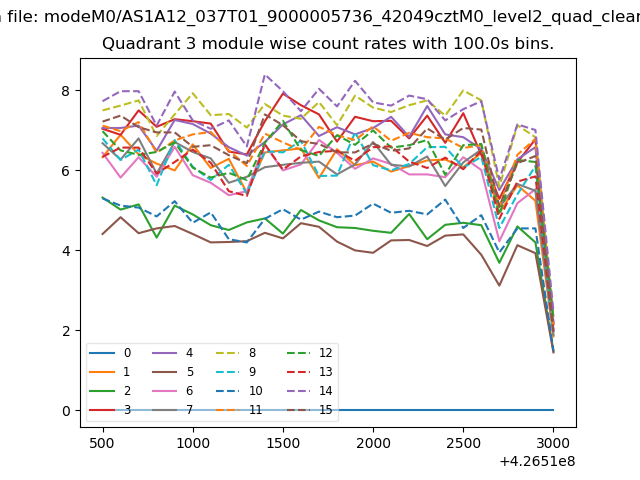
| Module-wise count rates for Quadrant A Data is divided into 100 sec bins |
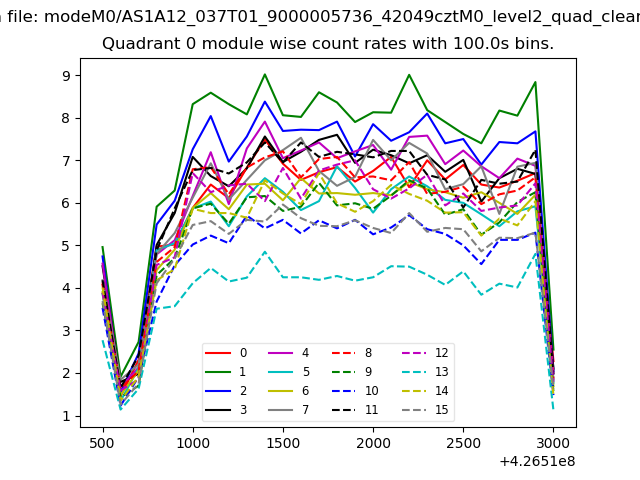 |
 |
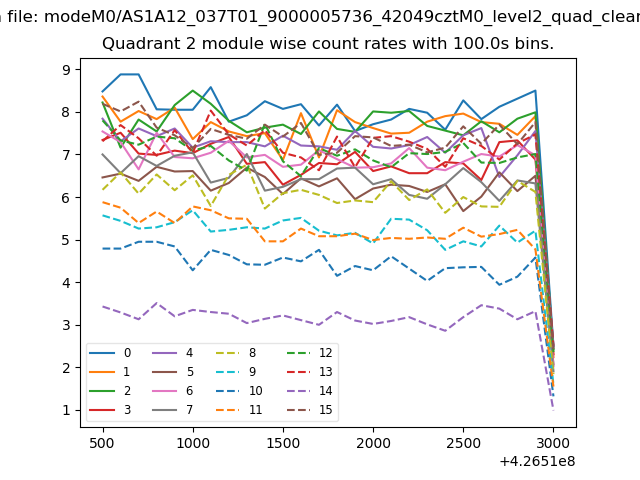
| Module-wise count rates for Quadrant B Data is divided into 100 sec bins |
 |
 |
| Module-wise count rates for Quadrant C Data is divided into 100 sec bins |
 |
 |
| Module-wise count rates for Quadrant D Data is divided into 100 sec bins |
 |
 |
| Parameter | Plot |
|---|---|
| CZT HV Monitor | 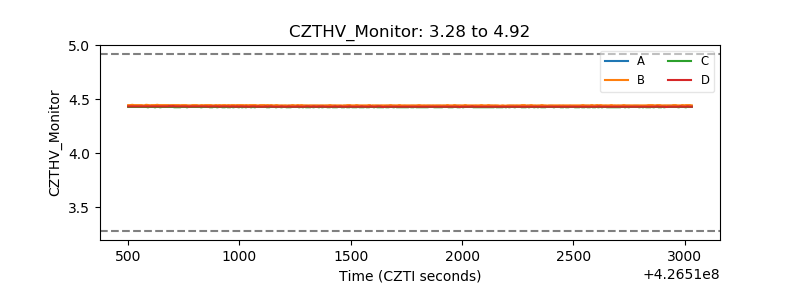 |
| D_VDD | 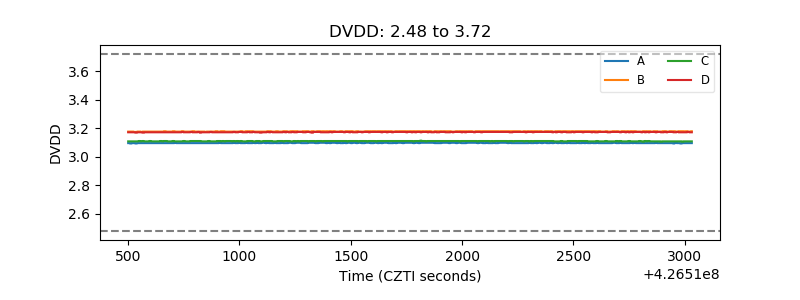 |
| Temperature 1 | 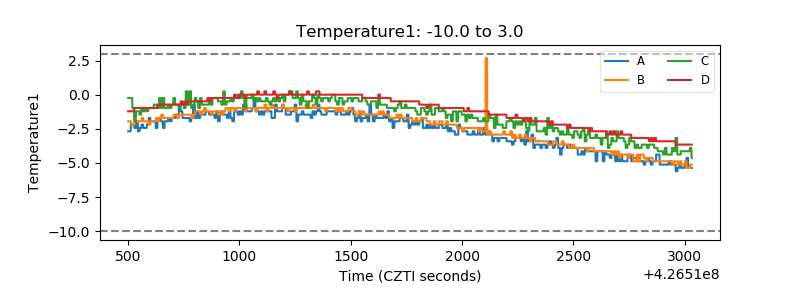 |
| Veto HV Monitor |  |
| Veto LLD | 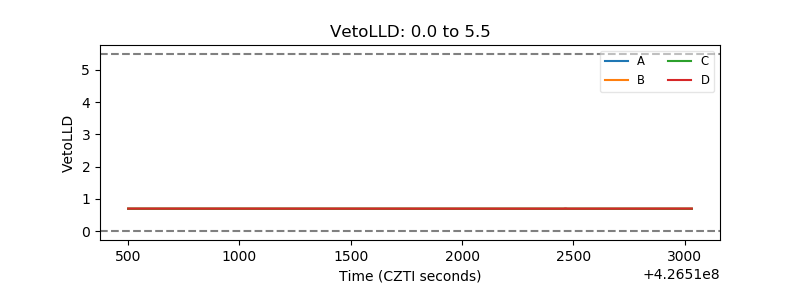 |
| Alpha Counter | 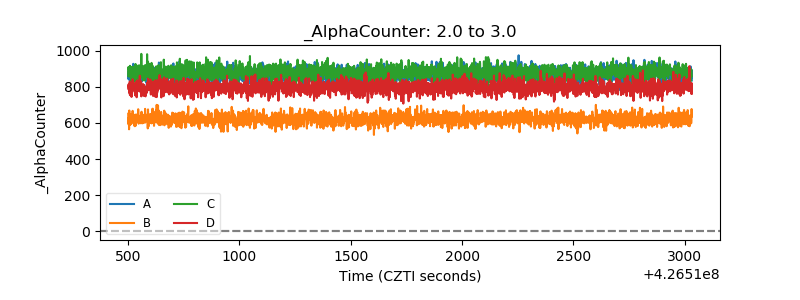 |
| _CPM_Rate | 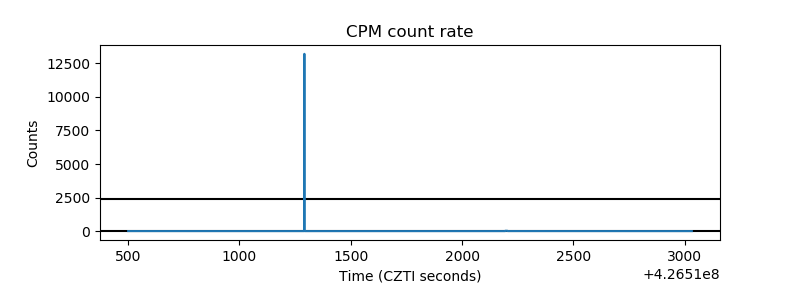 |
| CZT Counter | 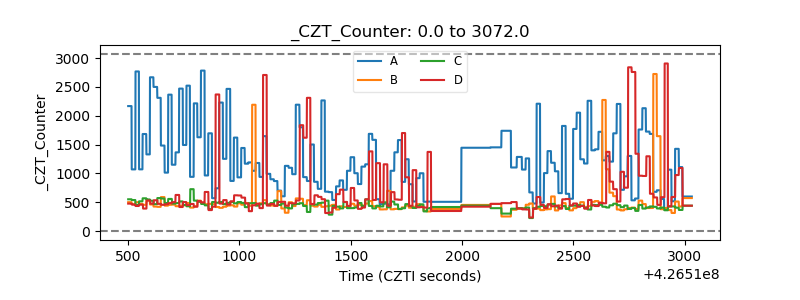 |
| +2.5 Volts monitor | 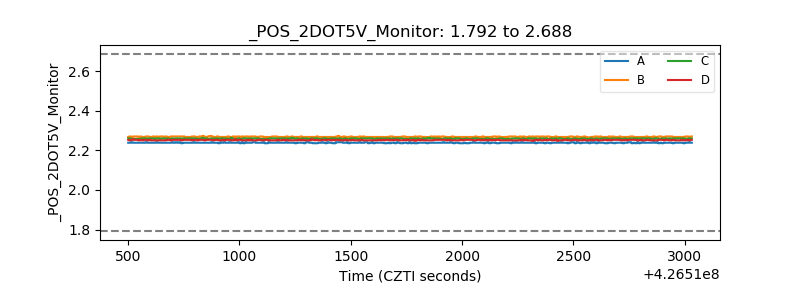 |
| +5 Volts monitor | 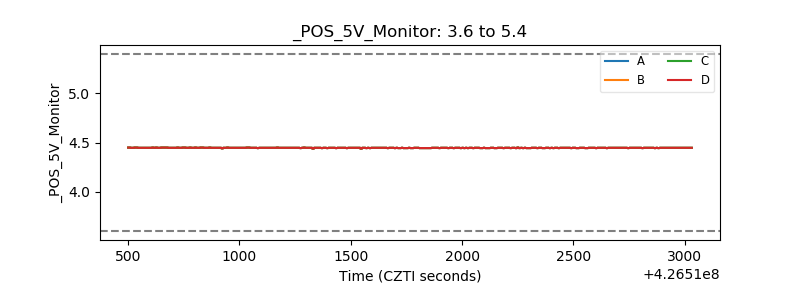 |
| _ROLL_ROT | 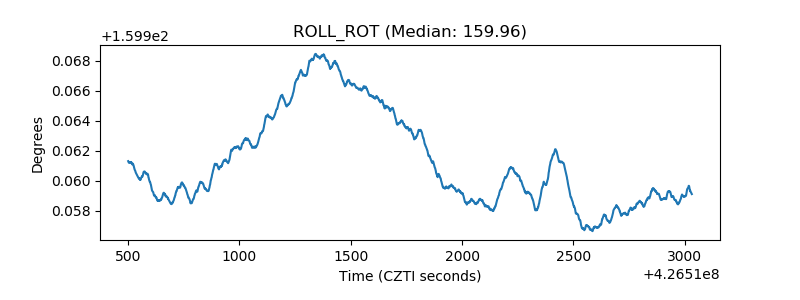 |
| _Roll_DEC |  |
| _Roll_RA |  |
| Veto Counter | 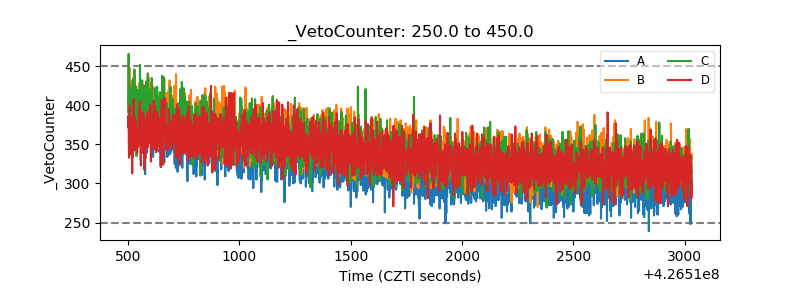 |