| Param | Original file | Final file |
|---|---|---|
| Filename | modeM0/AS1A12_037T03_9000005738_42051cztM0_level2.fits | modeM0/AS1A12_037T03_9000005738_42051cztM0_level2_quad_clean.evt |
| Size (bytes) | 378,892,800 | 85,754,880 |
| Size | 361.3 MB | 81.8 MB |
| Events in quadrant A | 4,937,230 | 564,297 |
| Events in quadrant B | 2,421,985 | 598,740 |
| Events in quadrant C | 2,433,469 | 567,751 |
| Events in quadrant D | 3,820,574 | 494,712 |
| Mode SS | |||
|---|---|---|---|
| Quadrant | BADHDUFLAG | Total packets | Discarded packets |
| A | 0 | 108 | 0 |
| B | 0 | 108 | 0 |
| C | 0 | 108 | 0 |
| D | 0 | 108 | 0 |
| Mode M9 | |||
|---|---|---|---|
| Quadrant | BADHDUFLAG | Total packets | Discarded packets |
| A | 0 | 31 | 0 |
| B | 0 | 31 | 0 |
| C | 0 | 31 | 0 |
| D | 0 | 32 | 0 |
| Mode M0 | |||
|---|---|---|---|
| Quadrant | BADHDUFLAG | Total packets | Discarded packets |
| A | 0 | 18432 | 3 |
| B | 0 | 10936 | 2 |
| C | 0 | 10646 | 2 |
| D | 0 | 15118 | 2 |
| Quadrant | Total seconds | Saturated seconds | Saturation percentage |
|---|---|---|---|
| A | 5298 | 185 | 3.491884% |
| B | 5298 | 17 | 0.320876% |
| C | 5298 | 3 | 0.056625% |
| D | 5298 | 385 | 7.266893% |
Noise dominated data is calculated using 1-second bins in cleaned event files. If a bin has >2000 counts, and if more than 50% of those come from <1% of pixels, then it is considered to be noise-dominated and hence unusable.
| Quadrant | # 1 sec bins | Bins with >0 counts | Bins with >2000 counts | High rate bins dominated by noise | Noise dominated (total time) | Noise dominated (detector-on time) | Marked lightcurve |
|---|---|---|---|---|---|---|---|
| A | 7061 | 5299 | 185 | 185 | 2.62% | 3.49% | 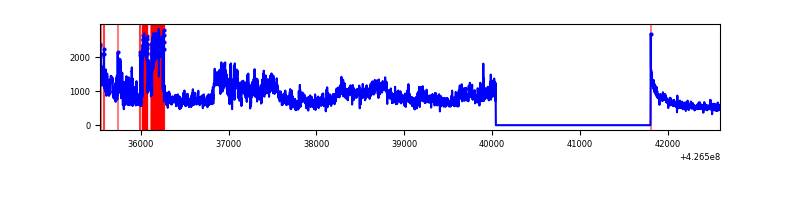 |
| B | 7061 | 5299 | 10 | 10 | 0.14% | 0.19% | 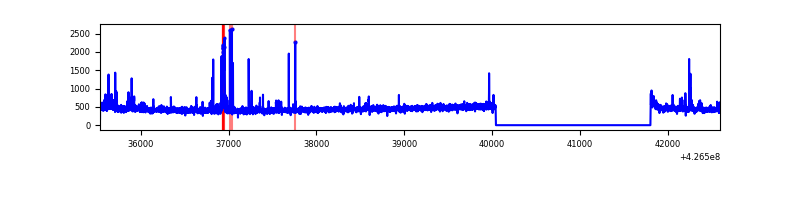 |
| C | 7061 | 5299 | 0 | 0 | 0.00% | 0.00% | 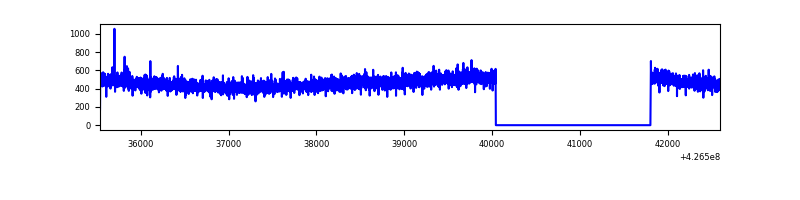 |
| D | 7061 | 5299 | 313 | 313 | 4.43% | 5.91% | 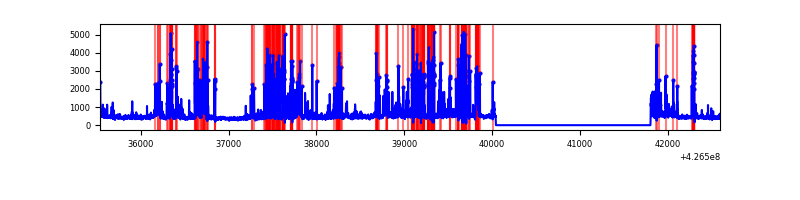 |
Top three noisy pixels from each quadrant. If the there are fewer than three noisy pixels in the level2.evt file, extra rows are filled as -1
| Pixel properties | Quadrant properties | ||||||
|---|---|---|---|---|---|---|---|
| Quadrant | DetID | PixID | Counts | Sigma | Mean | Median | Sigma |
| A | 15 | 223 | 2085840 | 17554.83 | 572 | 559 | 118.8 |
| A | 10 | 83 | 551387 | 4637.12 | 572 | 559 | 118.8 |
| A | 12 | 189 | 48452 | 403.18 | 572 | 559 | 118.8 |
| B | 5 | 255 | 87353 | 765.95 | 578 | 561 | 113.3 |
| B | 3 | 112 | 21596 | 185.64 | 578 | 561 | 113.3 |
| B | 0 | 186 | 16247 | 138.43 | 578 | 561 | 113.3 |
| C | 15 | 214 | 218404 | 1625.56 | 566 | 569 | 134.0 |
| C | 12 | 249 | 5024 | 33.24 | 566 | 569 | 134.0 |
| C | 13 | 61 | 3731 | 23.6 | 566 | 569 | 134.0 |
| D | 1 | 52 | 1129005 | 8308.85 | 544 | 527 | 135.8 |
| D | 13 | 249 | 357386 | 2627.51 | 544 | 527 | 135.8 |
| D | 12 | 6 | 139661 | 1024.43 | 544 | 527 | 135.8 |
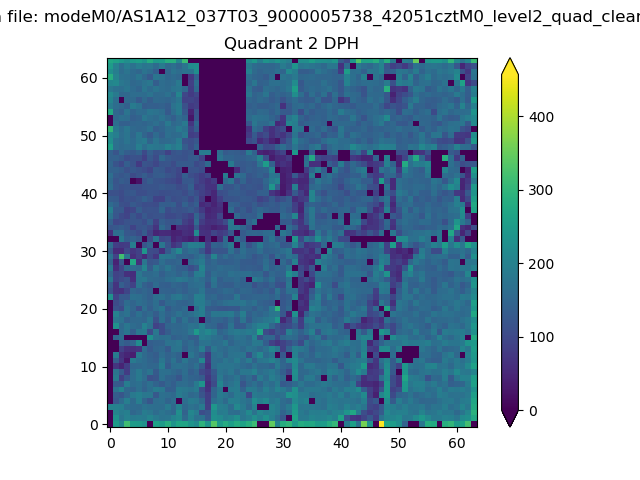
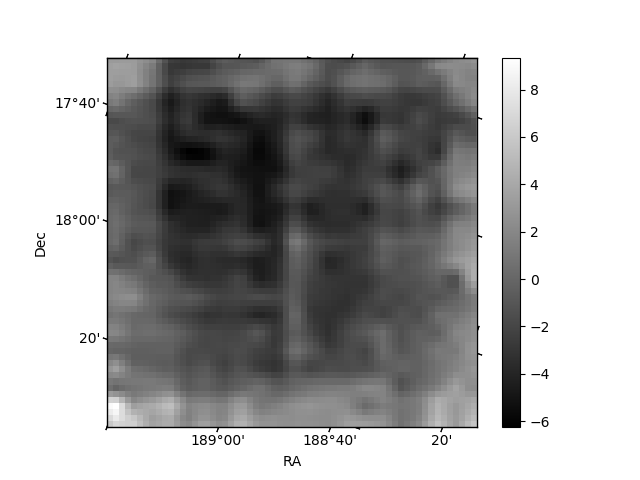
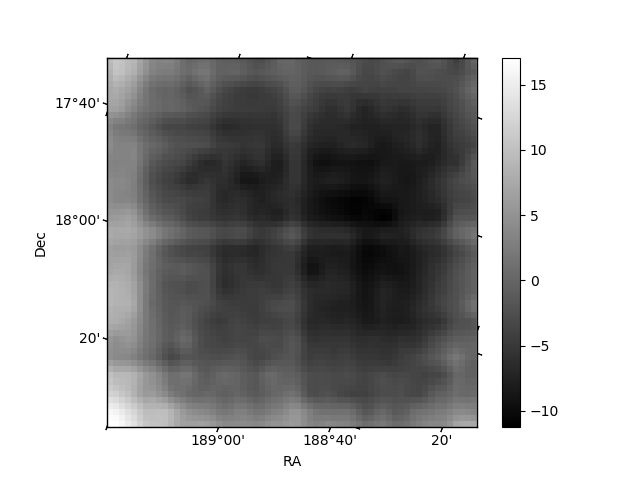
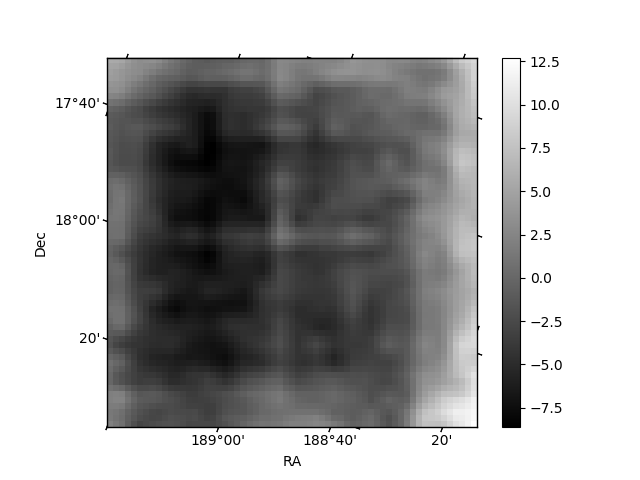
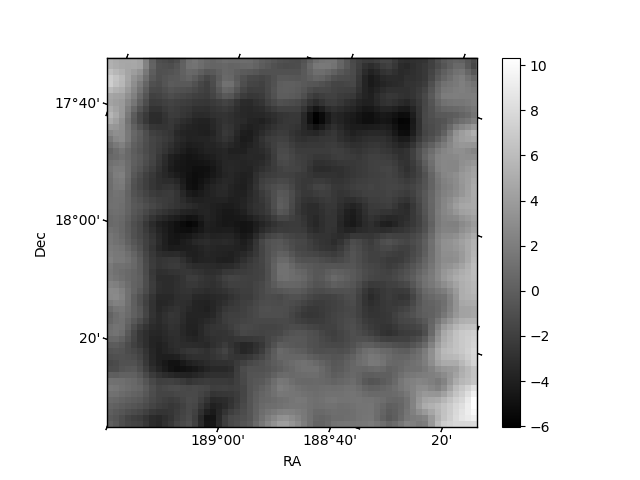
Histogram calculated using DETX and DETY for each event in the final _common_clean file
| Quadrant A | 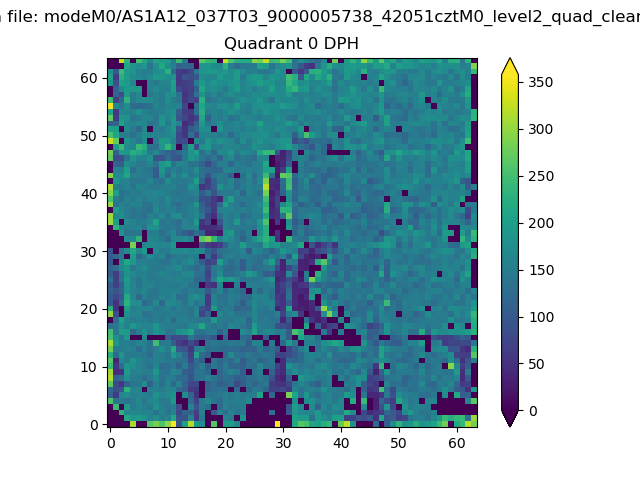 |
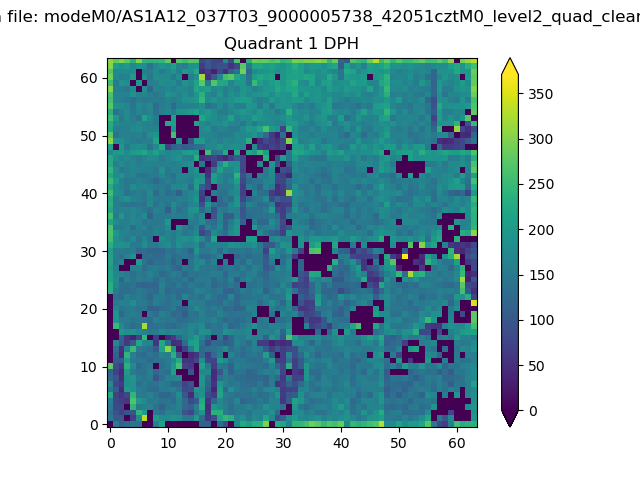 |
Quadrant B |
|---|---|---|---|
| Quadrant D | 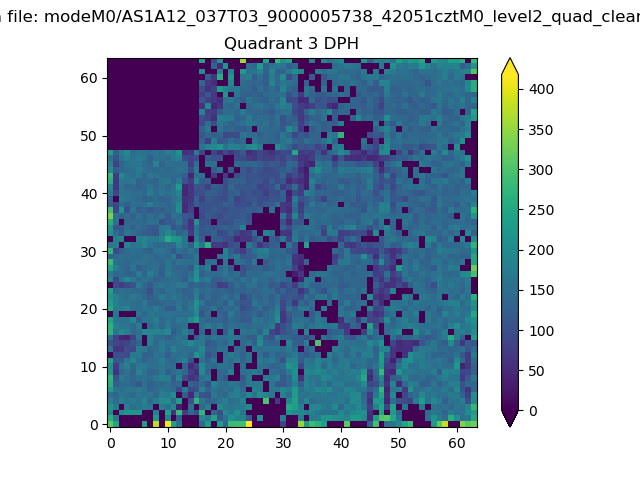 |
 |
Quadrant C |
| Plot type | Count rate plots | Images |
|---|---|---|
| Comparison with Poisson distribution Blue bars denote a histogram of data divided into 1 sec bins. Red curve is a Poisson curve with rate = median count rate of data. |
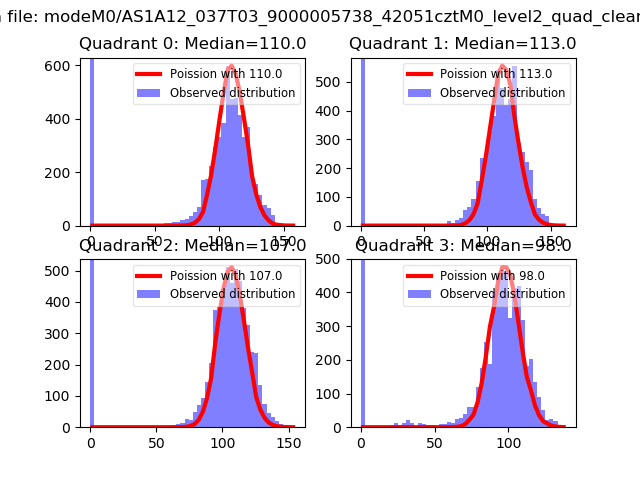 |
 |
| Quadrant-wise count rates Data is divided into 100 sec bins |
 |
|
| Module-wise count rates for Quadrant A Data is divided into 100 sec bins |
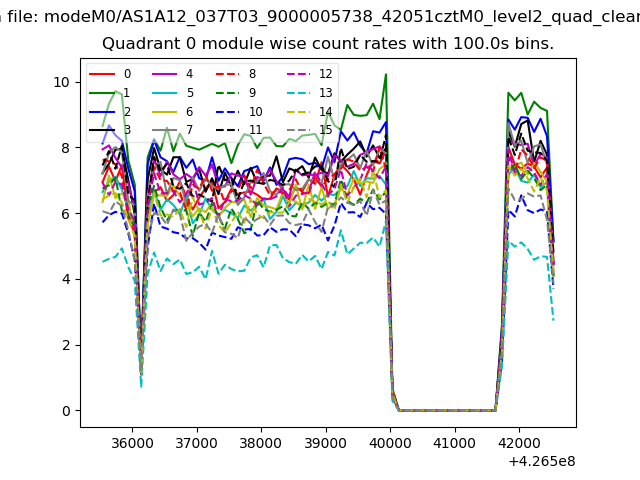 |
 |
| Module-wise count rates for Quadrant B Data is divided into 100 sec bins |
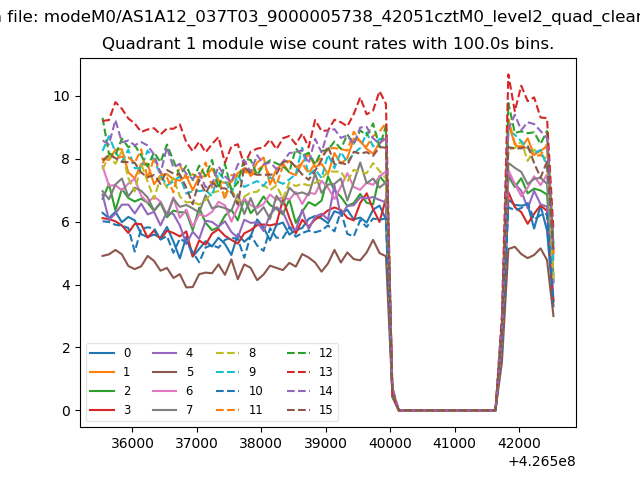 |
 |
| Module-wise count rates for Quadrant C Data is divided into 100 sec bins |
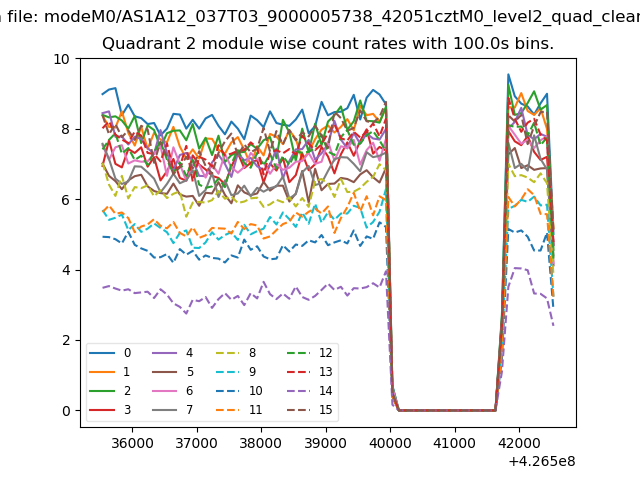 |
 |
| Module-wise count rates for Quadrant D Data is divided into 100 sec bins |
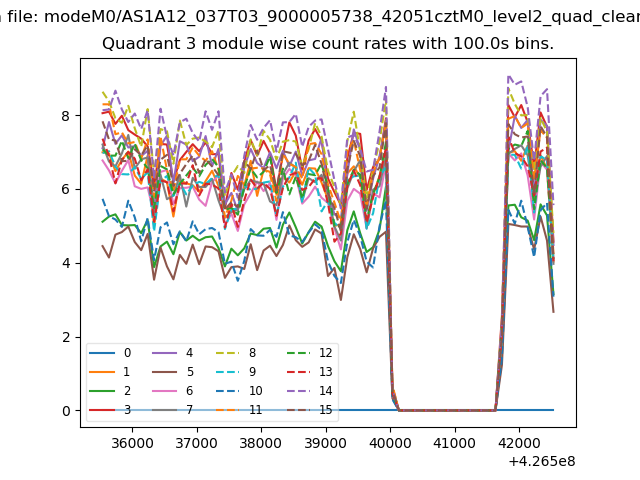 |
 |
| Parameter | Plot |
|---|---|
| CZT HV Monitor | 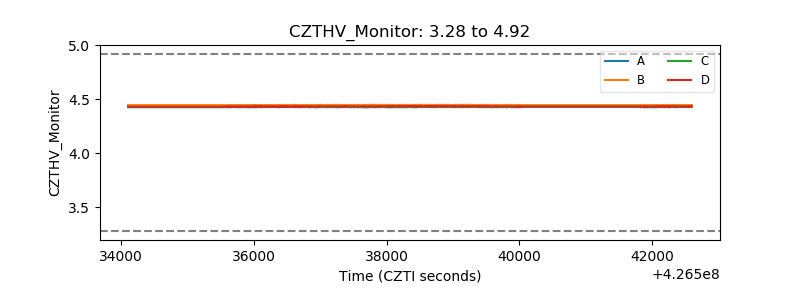 |
| D_VDD | 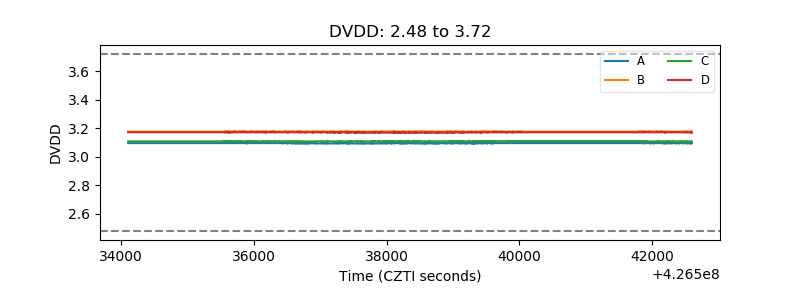 |
| Temperature 1 |  |
| Veto HV Monitor | 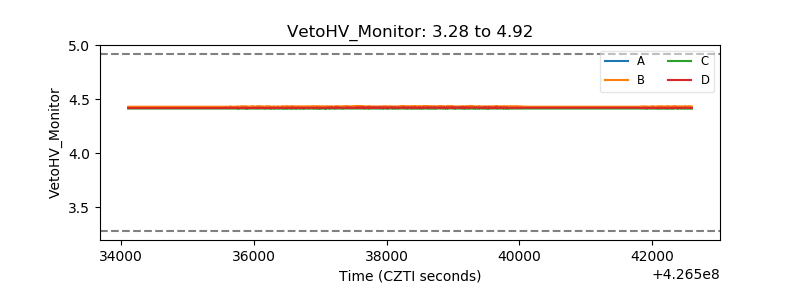 |
| Veto LLD | 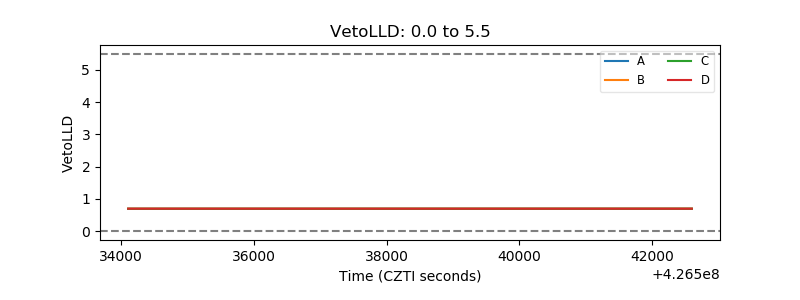 |
| Alpha Counter | 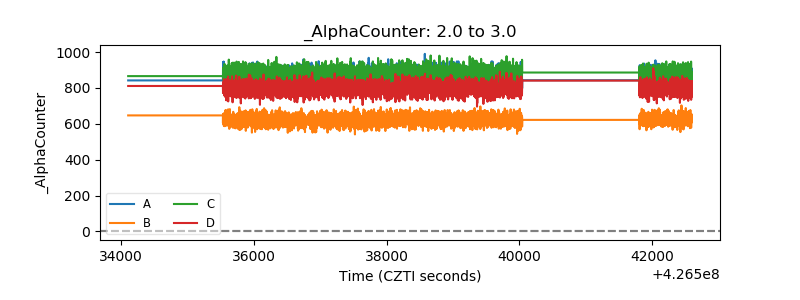 |
| _CPM_Rate |  |
| CZT Counter | 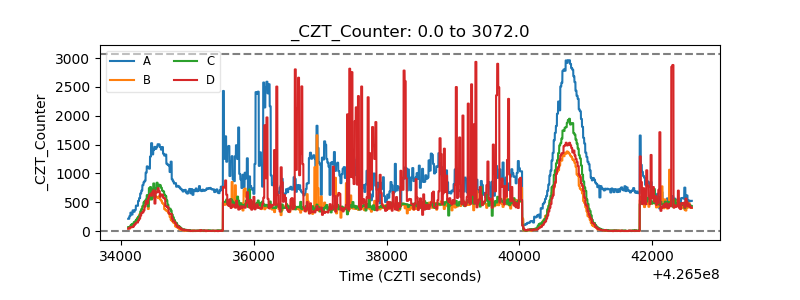 |
| +2.5 Volts monitor | 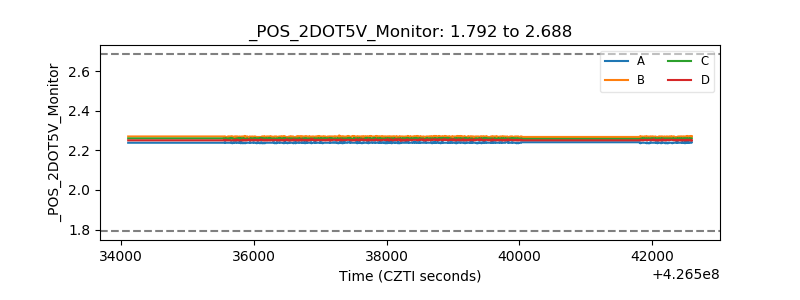 |
| +5 Volts monitor |  |
| _ROLL_ROT | 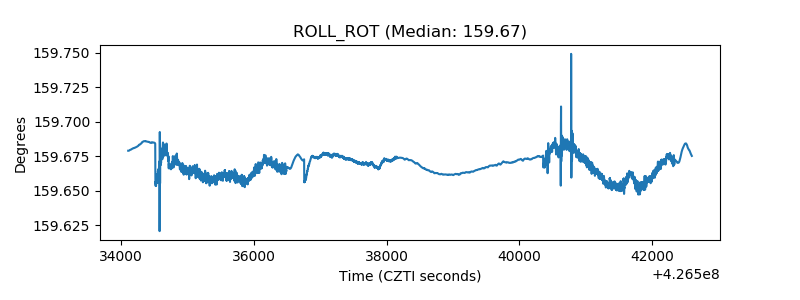 |
| _Roll_DEC | 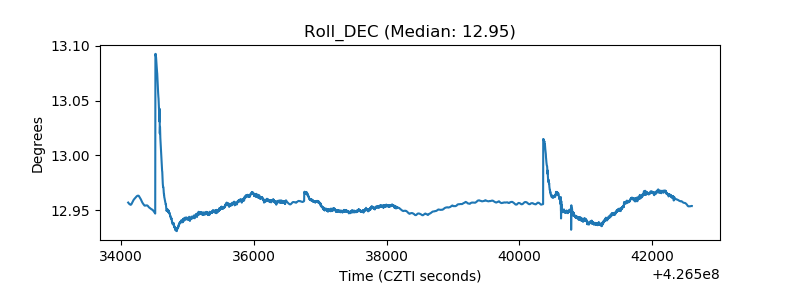 |
| _Roll_RA |  |
| Veto Counter | 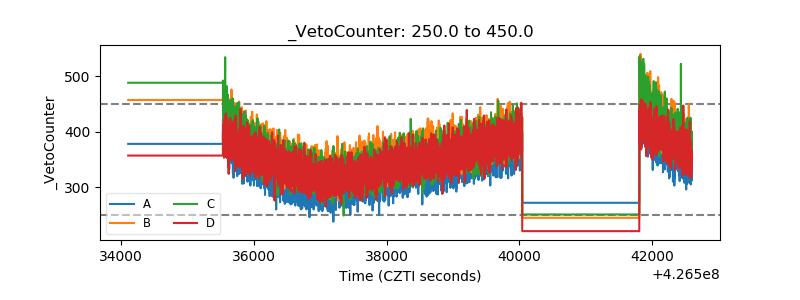 |