| Param | Original file | Final file |
|---|---|---|
| Filename | modeM0/AS1A12_037T03_9000005738_42052cztM0_level2.fits | modeM0/AS1A12_037T03_9000005738_42052cztM0_level2_quad_clean.evt |
| Size (bytes) | 325,886,400 | 87,151,680 |
| Size | 310.8 MB | 83.1 MB |
| Events in quadrant A | 3,443,974 | 587,296 |
| Events in quadrant B | 2,370,324 | 609,166 |
| Events in quadrant C | 2,427,054 | 573,527 |
| Events in quadrant D | 3,419,039 | 506,464 |
| Mode SS | |||
|---|---|---|---|
| Quadrant | BADHDUFLAG | Total packets | Discarded packets |
| A | 0 | 106 | 0 |
| B | 0 | 106 | 0 |
| C | 0 | 106 | 0 |
| D | 0 | 106 | 0 |
| Mode M9 | |||
|---|---|---|---|
| Quadrant | BADHDUFLAG | Total packets | Discarded packets |
| A | 0 | 27 | 0 |
| B | 0 | 27 | 0 |
| C | 0 | 27 | 0 |
| D | 0 | 28 | 0 |
| Mode M0 | |||
|---|---|---|---|
| Quadrant | BADHDUFLAG | Total packets | Discarded packets |
| A | 0 | 13643 | 3 |
| B | 0 | 10566 | 2 |
| C | 0 | 10414 | 2 |
| D | 0 | 13861 | 2 |
| Quadrant | Total seconds | Saturated seconds | Saturation percentage |
|---|---|---|---|
| A | 5171 | 38 | 0.734868% |
| B | 5171 | 10 | 0.193386% |
| C | 5171 | 2 | 0.038677% |
| D | 5171 | 262 | 5.066718% |
Noise dominated data is calculated using 1-second bins in cleaned event files. If a bin has >2000 counts, and if more than 50% of those come from <1% of pixels, then it is considered to be noise-dominated and hence unusable.
| Quadrant | # 1 sec bins | Bins with >0 counts | Bins with >2000 counts | High rate bins dominated by noise | Noise dominated (total time) | Noise dominated (detector-on time) | Marked lightcurve |
|---|---|---|---|---|---|---|---|
| A | 7055 | 5172 | 15 | 15 | 0.21% | 0.29% | 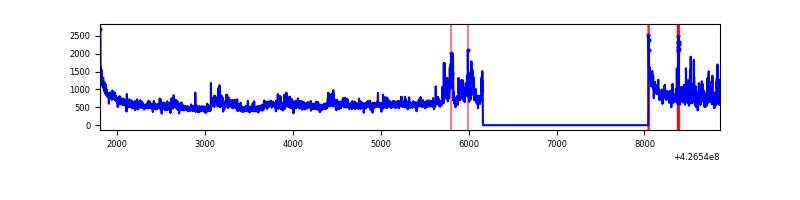 |
| B | 7055 | 5172 | 7 | 7 | 0.10% | 0.14% | 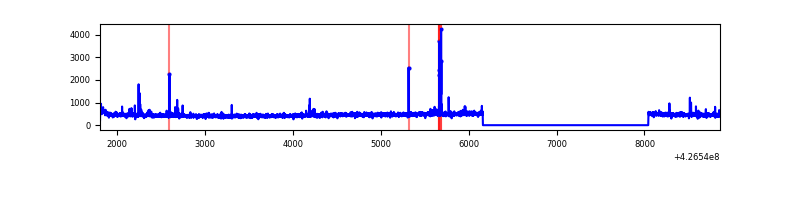 |
| C | 7055 | 5172 | 0 | 0 | 0.00% | 0.00% | 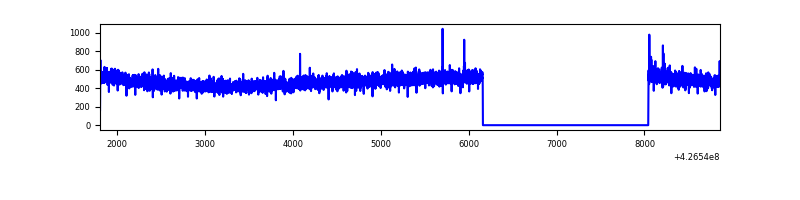 |
| D | 7055 | 5172 | 225 | 225 | 3.19% | 4.35% | 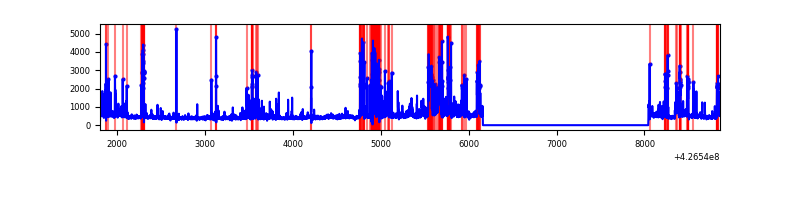 |
Top three noisy pixels from each quadrant. If the there are fewer than three noisy pixels in the level2.evt file, extra rows are filled as -1
| Pixel properties | Quadrant properties | ||||||
|---|---|---|---|---|---|---|---|
| Quadrant | DetID | PixID | Counts | Sigma | Mean | Median | Sigma |
| A | 15 | 223 | 607881 | 5158.61 | 576 | 566 | 117.7 |
| A | 10 | 83 | 528577 | 4485.0 | 576 | 566 | 117.7 |
| A | 12 | 189 | 48100 | 403.76 | 576 | 566 | 117.7 |
| B | 3 | 112 | 40443 | 354.09 | 579 | 562 | 112.6 |
| B | 5 | 255 | 27059 | 235.26 | 579 | 562 | 112.6 |
| B | 0 | 229 | 16138 | 138.29 | 579 | 562 | 112.6 |
| C | 15 | 214 | 214502 | 1611.73 | 564 | 567 | 132.7 |
| C | 12 | 249 | 5334 | 35.91 | 564 | 567 | 132.7 |
| C | 0 | 207 | 5276 | 35.48 | 564 | 567 | 132.7 |
| D | 1 | 52 | 568673 | 4217.49 | 545 | 530 | 134.7 |
| D | 13 | 249 | 450784 | 3342.36 | 545 | 530 | 134.7 |
| D | 12 | 6 | 255992 | 1896.37 | 545 | 530 | 134.7 |
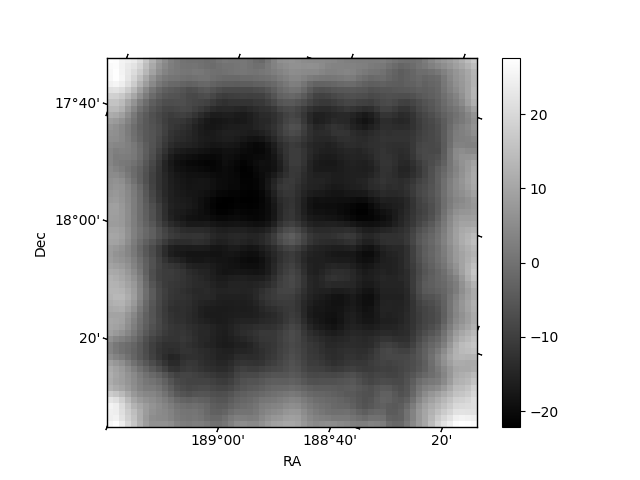
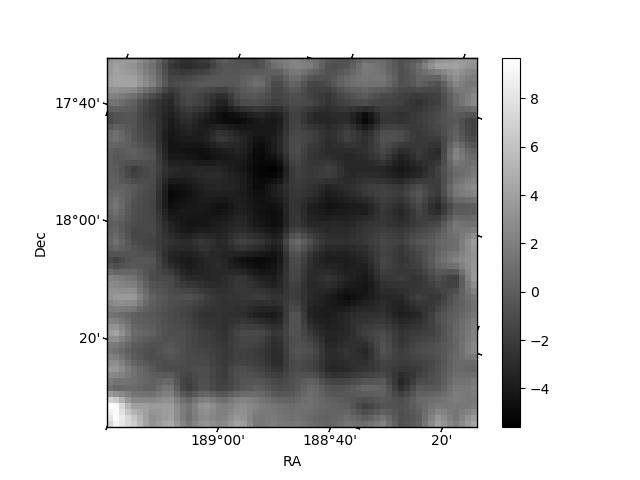
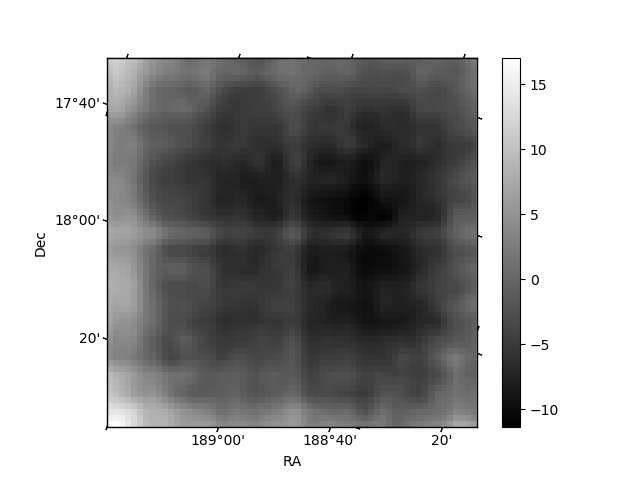
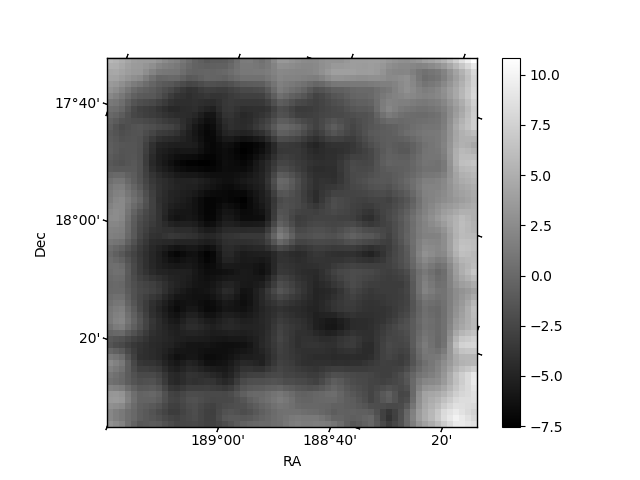
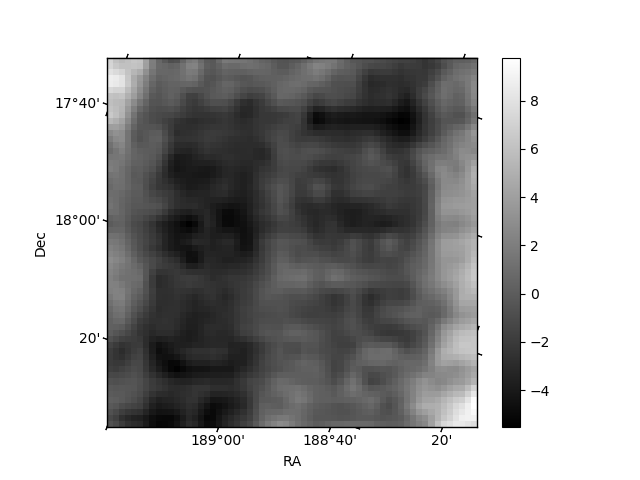
Histogram calculated using DETX and DETY for each event in the final _common_clean file
| Quadrant A | 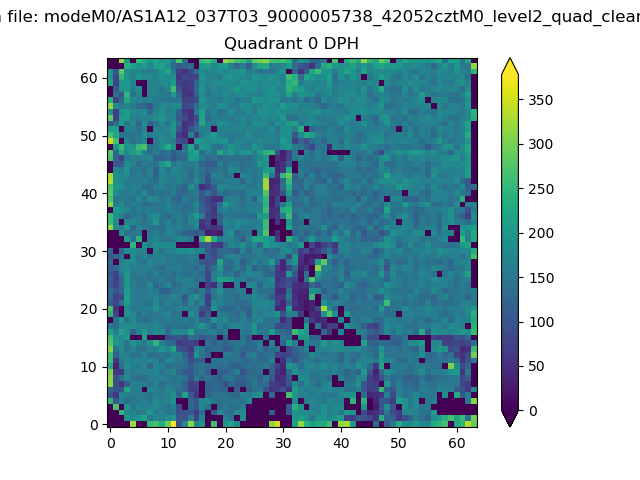 |
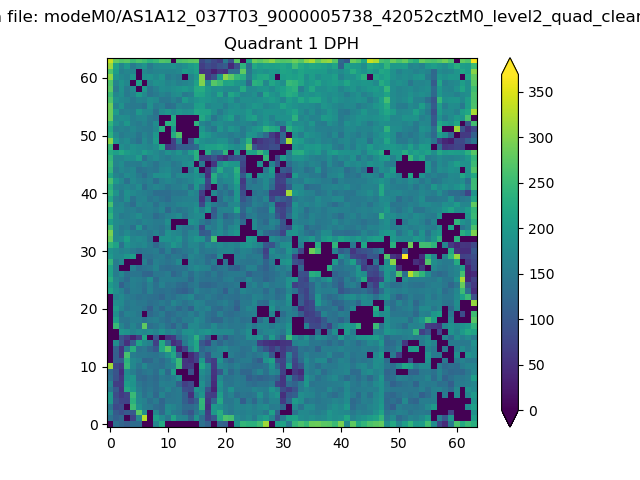 |
Quadrant B |
|---|---|---|---|
| Quadrant D | 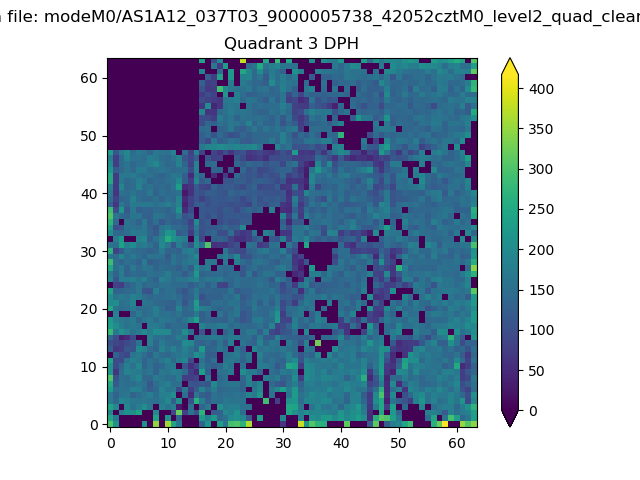 |
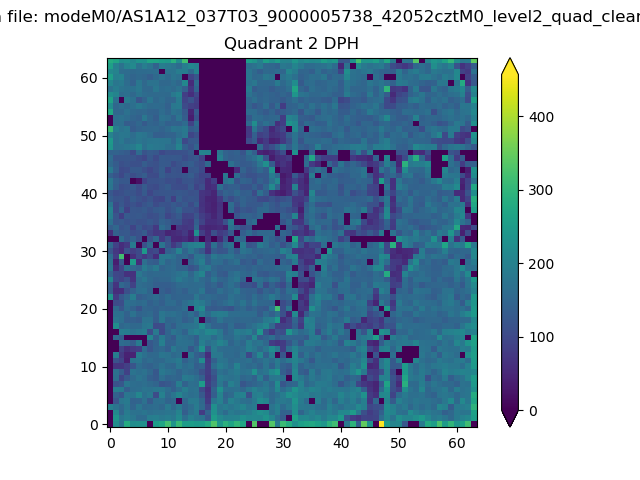 |
Quadrant C |
| Plot type | Count rate plots | Images |
|---|---|---|
| Comparison with Poisson distribution Blue bars denote a histogram of data divided into 1 sec bins. Red curve is a Poisson curve with rate = median count rate of data. |
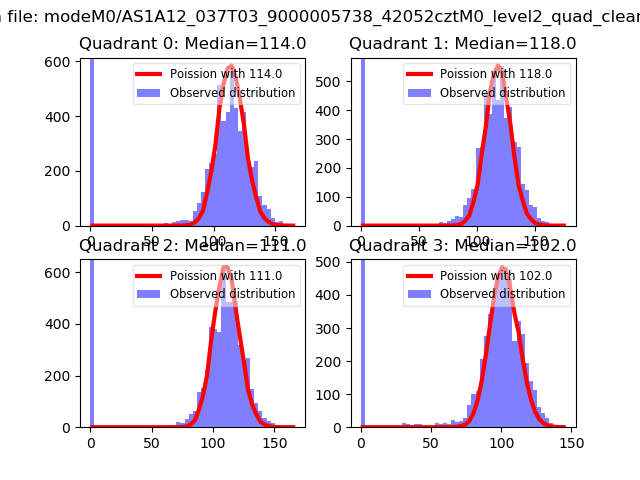 |
 |
| Quadrant-wise count rates Data is divided into 100 sec bins |
 |
|
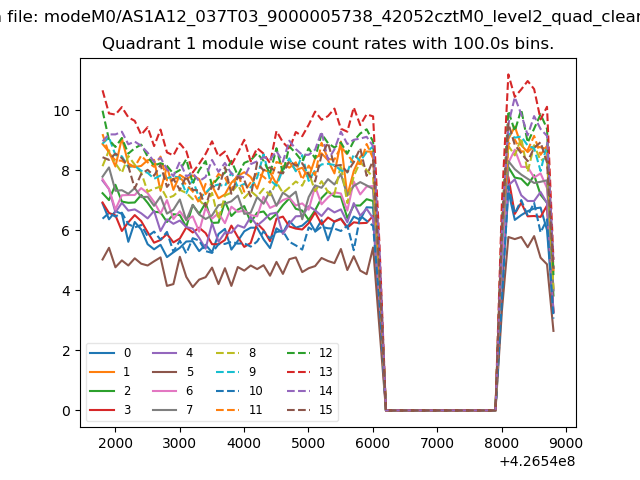
| Module-wise count rates for Quadrant A Data is divided into 100 sec bins |
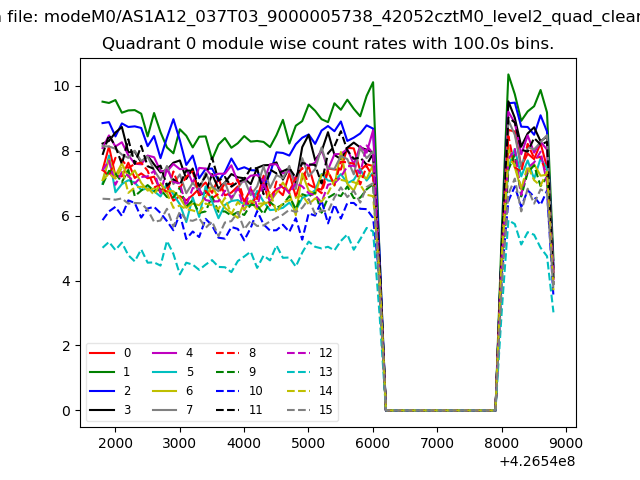 |
 |
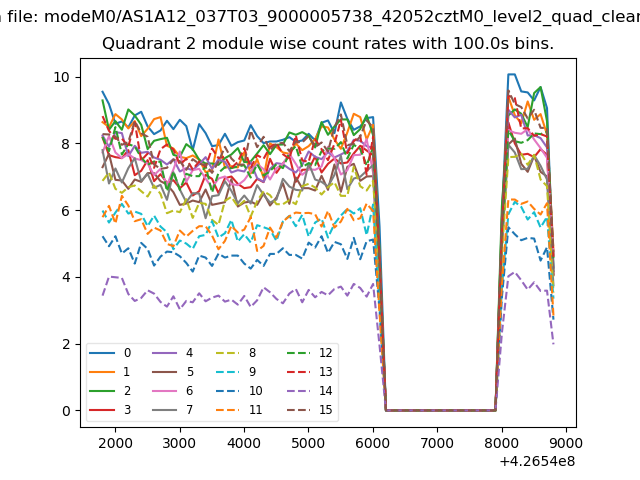
| Module-wise count rates for Quadrant B Data is divided into 100 sec bins |
 |
 |
| Module-wise count rates for Quadrant C Data is divided into 100 sec bins |
 |
 |
| Module-wise count rates for Quadrant D Data is divided into 100 sec bins |
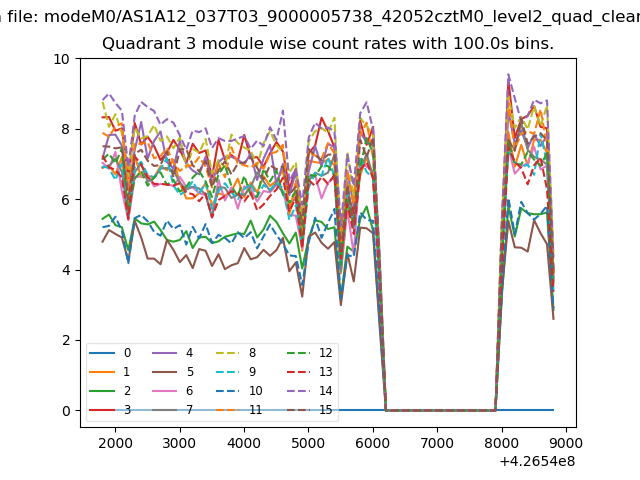 |
 |
| Parameter | Plot |
|---|---|
| CZT HV Monitor | 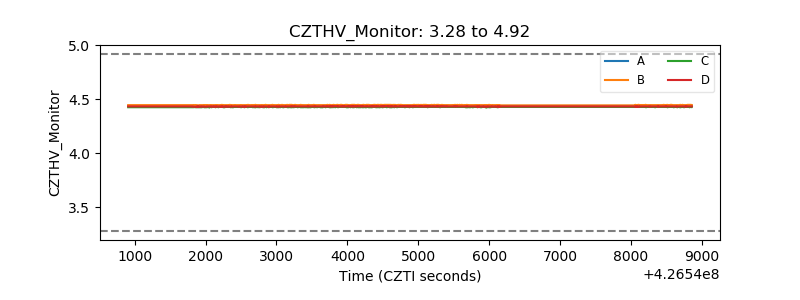 |
| D_VDD | 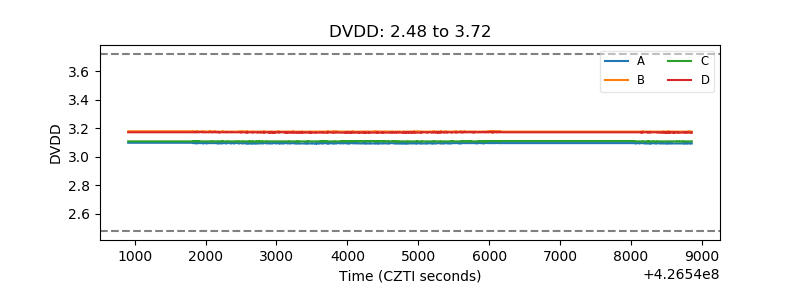 |
| Temperature 1 |  |
| Veto HV Monitor | 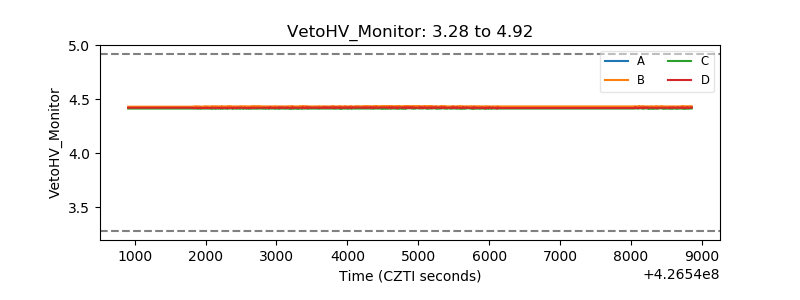 |
| Veto LLD | 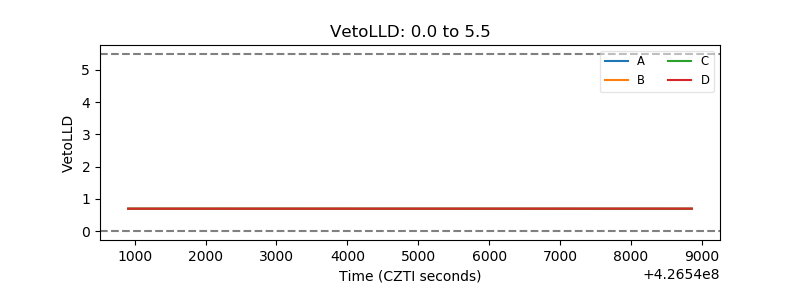 |
| Alpha Counter |  |
| _CPM_Rate |  |
| CZT Counter | 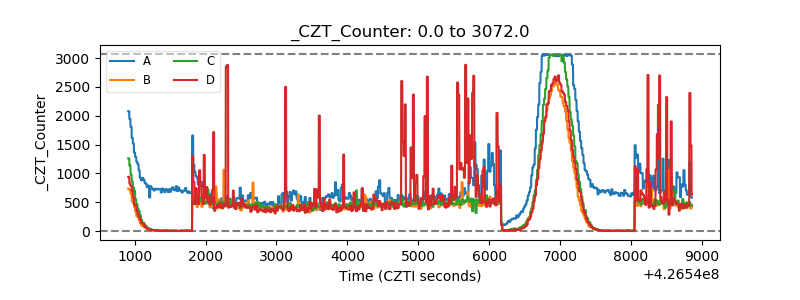 |
| +2.5 Volts monitor | 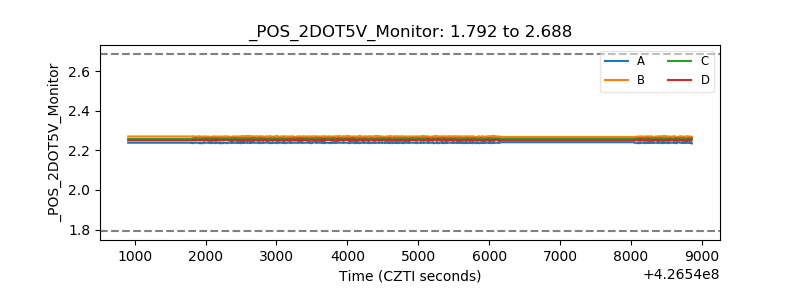 |
| +5 Volts monitor |  |
| _ROLL_ROT | 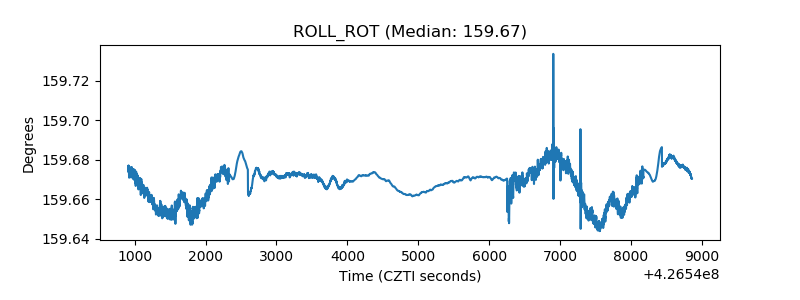 |
| _Roll_DEC | 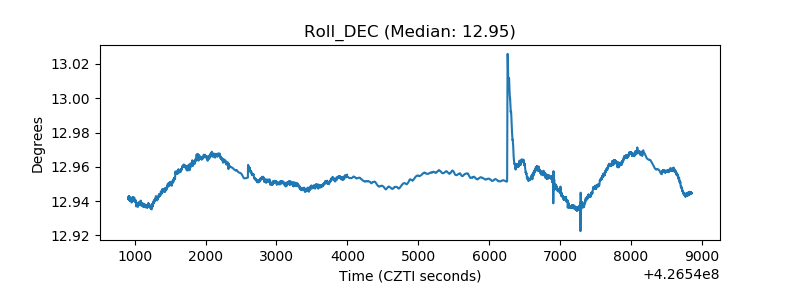 |
| _Roll_RA | 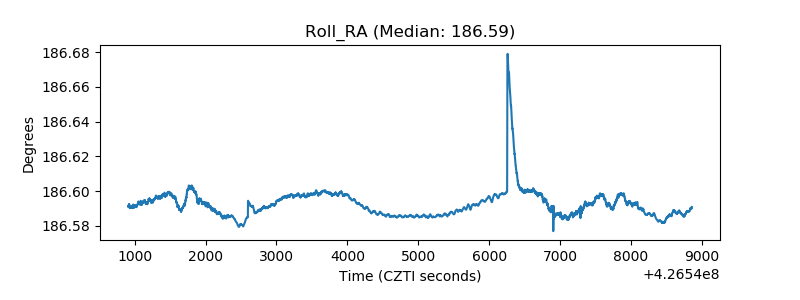 |
| Veto Counter | 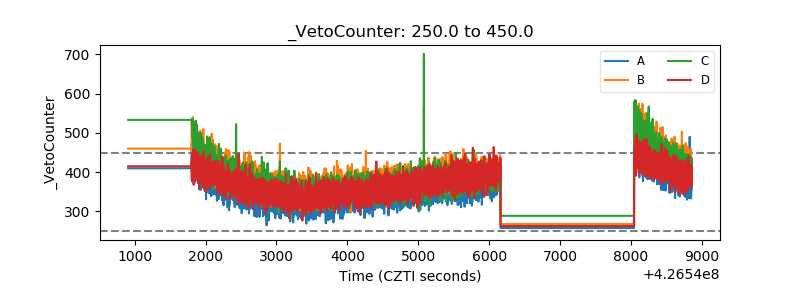 |