| Param | Original file | Final file |
|---|---|---|
| Filename | modeM0/AS1A12_037T03_9000005738_42053cztM0_level2.fits | modeM0/AS1A12_037T03_9000005738_42053cztM0_level2_quad_clean.evt |
| Size (bytes) | 333,224,640 | 88,320,960 |
| Size | 317.8 MB | 84.2 MB |
| Events in quadrant A | 3,657,090 | 588,551 |
| Events in quadrant B | 2,503,778 | 625,313 |
| Events in quadrant C | 2,448,343 | 584,518 |
| Events in quadrant D | 3,330,480 | 520,501 |
| Mode SS | |||
|---|---|---|---|
| Quadrant | BADHDUFLAG | Total packets | Discarded packets |
| A | 0 | 104 | 0 |
| B | 0 | 104 | 0 |
| C | 0 | 104 | 0 |
| D | 0 | 104 | 0 |
| Mode M9 | |||
|---|---|---|---|
| Quadrant | BADHDUFLAG | Total packets | Discarded packets |
| A | 0 | 32 | 0 |
| B | 0 | 32 | 0 |
| C | 0 | 32 | 0 |
| D | 0 | 33 | 0 |
| Mode M0 | |||
|---|---|---|---|
| Quadrant | BADHDUFLAG | Total packets | Discarded packets |
| A | 0 | 14203 | 3 |
| B | 0 | 10614 | 2 |
| C | 0 | 10234 | 2 |
| D | 0 | 13314 | 2 |
| Quadrant | Total seconds | Saturated seconds | Saturation percentage |
|---|---|---|---|
| A | 5072 | 142 | 2.799685% |
| B | 5072 | 27 | 0.532334% |
| C | 5072 | 4 | 0.078864% |
| D | 5072 | 202 | 3.982650% |
Noise dominated data is calculated using 1-second bins in cleaned event files. If a bin has >2000 counts, and if more than 50% of those come from <1% of pixels, then it is considered to be noise-dominated and hence unusable.
| Quadrant | # 1 sec bins | Bins with >0 counts | Bins with >2000 counts | High rate bins dominated by noise | Noise dominated (total time) | Noise dominated (detector-on time) | Marked lightcurve |
|---|---|---|---|---|---|---|---|
| A | 7075 | 5073 | 92 | 92 | 1.30% | 1.81% | 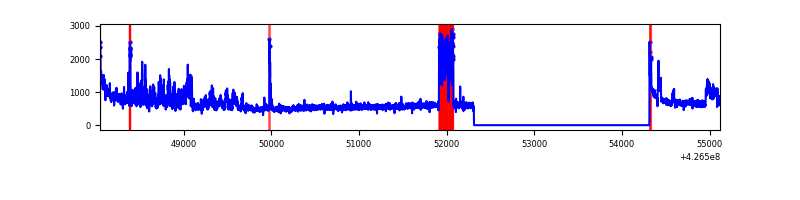 |
| B | 7075 | 5073 | 11 | 11 | 0.16% | 0.22% | 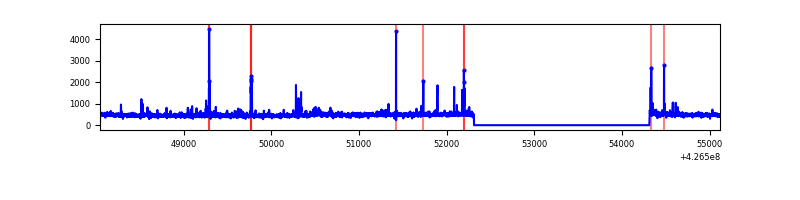 |
| C | 7075 | 5073 | 0 | 0 | 0.00% | 0.00% | 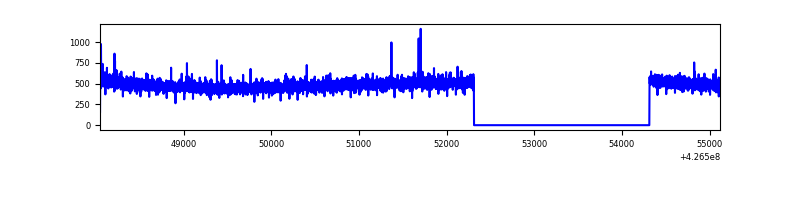 |
| D | 7075 | 5073 | 193 | 193 | 2.73% | 3.80% | 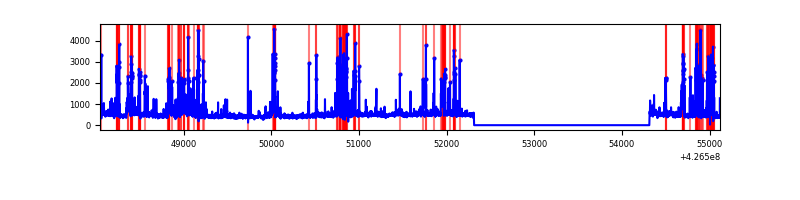 |
Top three noisy pixels from each quadrant. If the there are fewer than three noisy pixels in the level2.evt file, extra rows are filled as -1
| Pixel properties | Quadrant properties | ||||||
|---|---|---|---|---|---|---|---|
| Quadrant | DetID | PixID | Counts | Sigma | Mean | Median | Sigma |
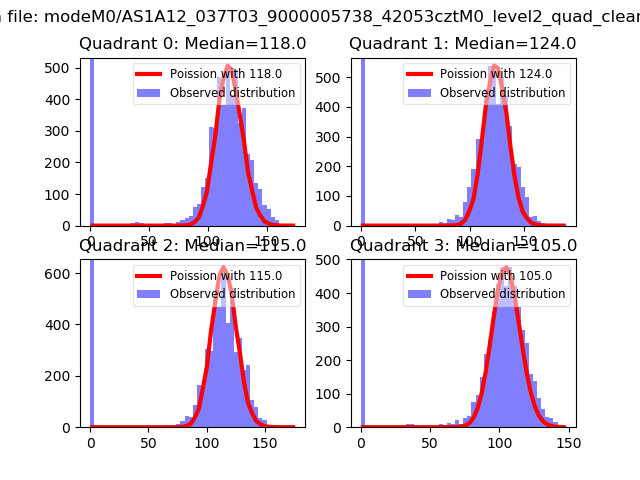
| A | 15 | 223 | 861699 | 7244.59 | 580 | 569 | 118.9 |
| A | 10 | 83 | 511637 | 4299.56 | 580 | 569 | 118.9 |
| A | 12 | 189 | 28485 | 234.85 | 580 | 569 | 118.9 |
| B | 5 | 255 | 107512 | 947.64 | 586 | 572 | 112.8 |
| B | 0 | 229 | 63885 | 561.04 | 586 | 572 | 112.8 |
| B | 3 | 112 | 15719 | 134.22 | 586 | 572 | 112.8 |
| C | 15 | 214 | 212692 | 1582.64 | 570 | 574 | 134.0 |
| C | 0 | 207 | 11421 | 80.93 | 570 | 574 | 134.0 |
| C | 13 | 61 | 3891 | 24.75 | 570 | 574 | 134.0 |
| D | 1 | 52 | 480227 | 3549.0 | 553 | 539 | 135.2 |
| D | 12 | 6 | 349828 | 2584.23 | 553 | 539 | 135.2 |
| D | 13 | 249 | 334964 | 2474.26 | 553 | 539 | 135.2 |
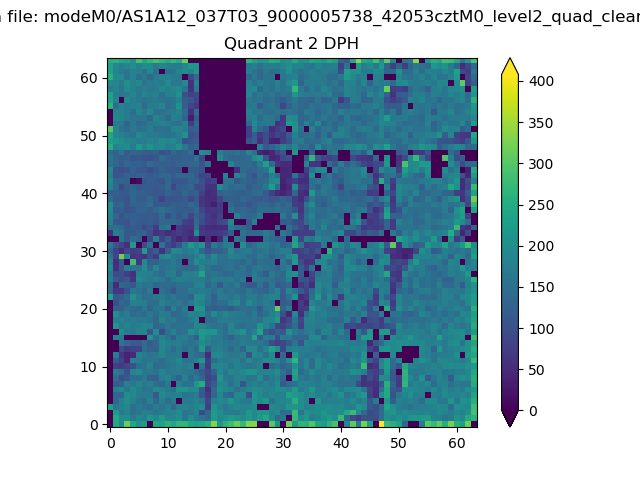
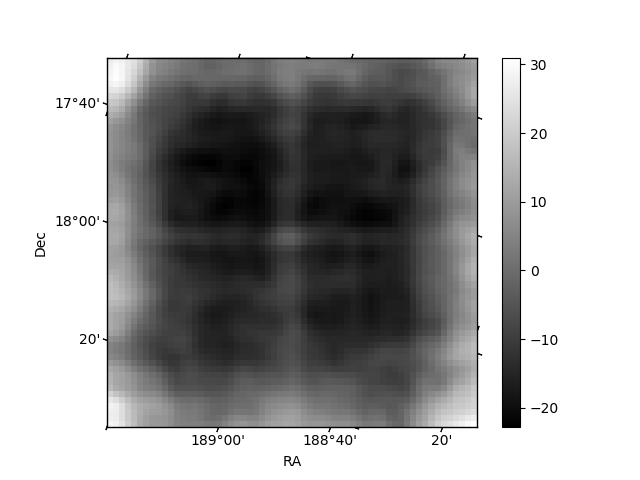
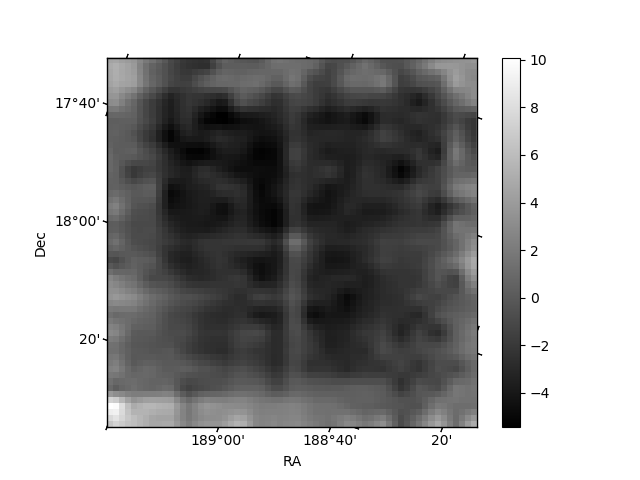
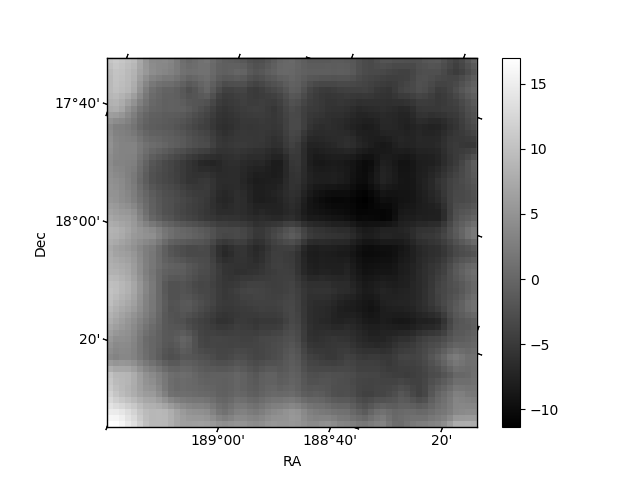
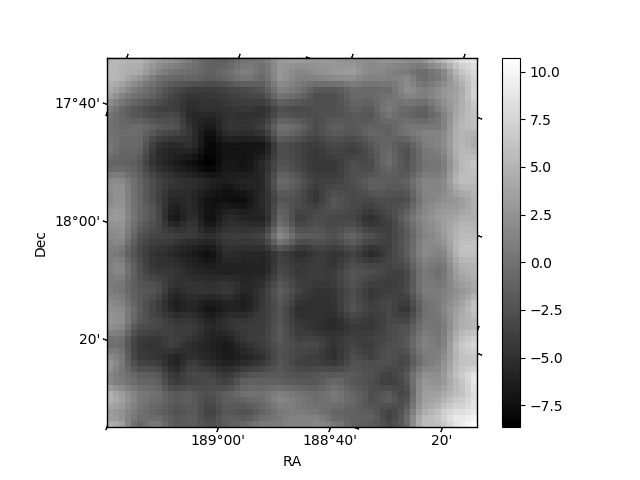
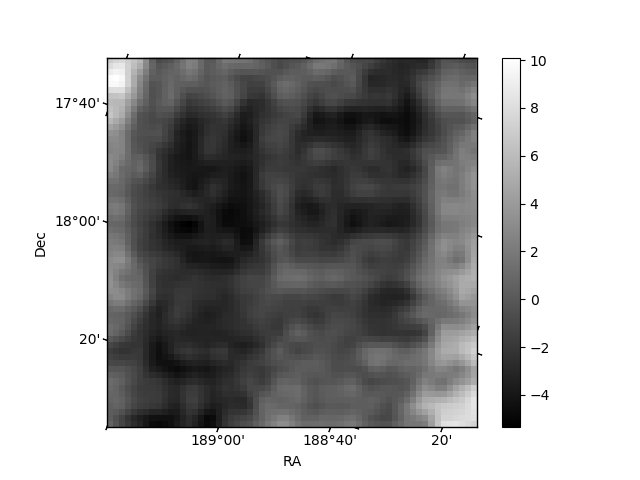
Histogram calculated using DETX and DETY for each event in the final _common_clean file
| Quadrant A | 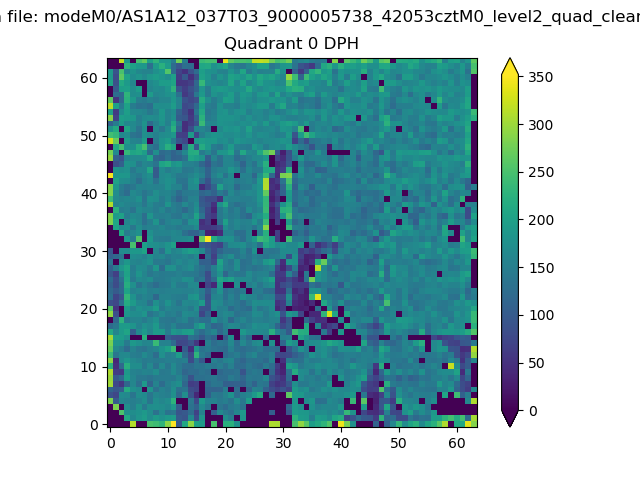 |
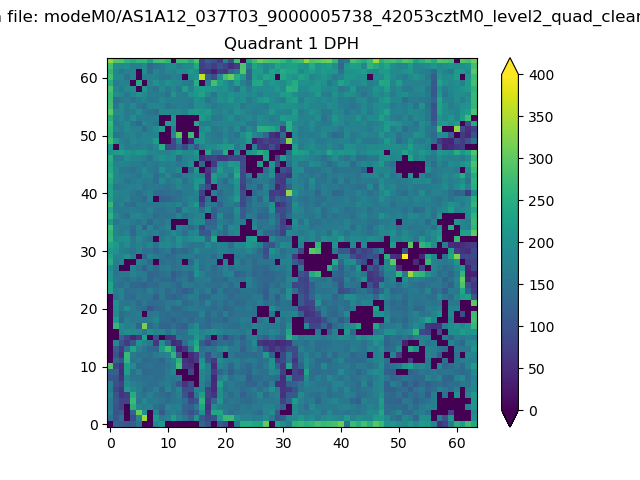 |
Quadrant B |
|---|---|---|---|
| Quadrant D | 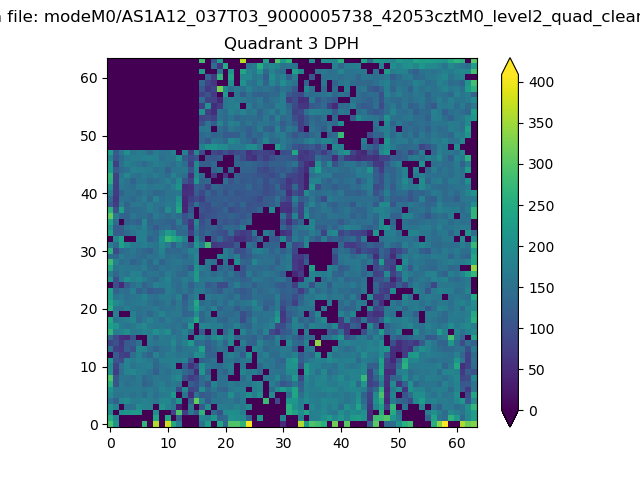 |
 |
Quadrant C |
| Plot type | Count rate plots | Images |
|---|---|---|
| Comparison with Poisson distribution Blue bars denote a histogram of data divided into 1 sec bins. Red curve is a Poisson curve with rate = median count rate of data. |
 |
 |
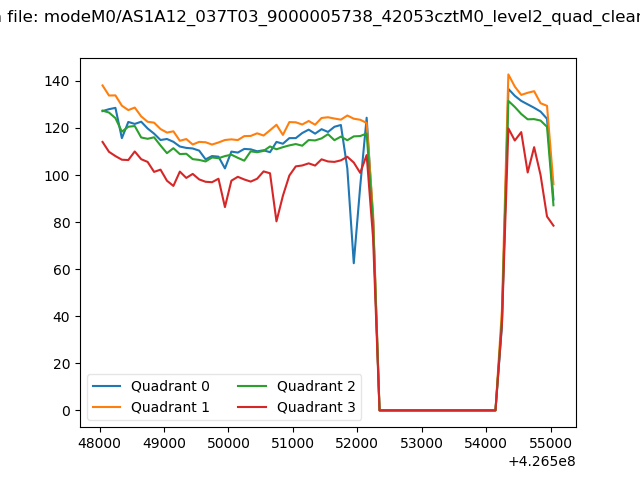
| Quadrant-wise count rates Data is divided into 100 sec bins |
 |
|
| Module-wise count rates for Quadrant A Data is divided into 100 sec bins |
 |
 |
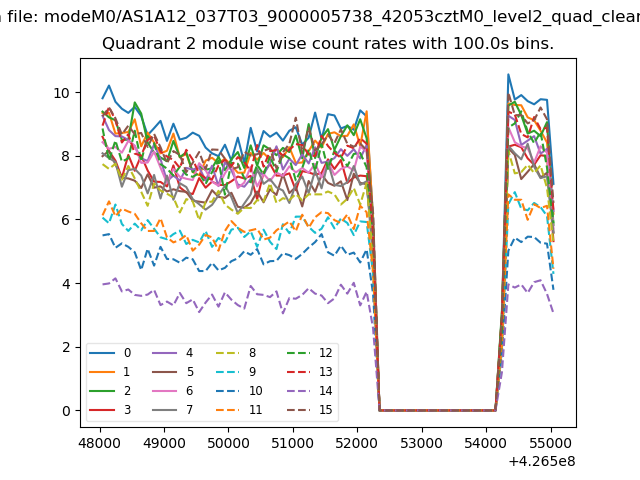
| Module-wise count rates for Quadrant B Data is divided into 100 sec bins |
 |
 |
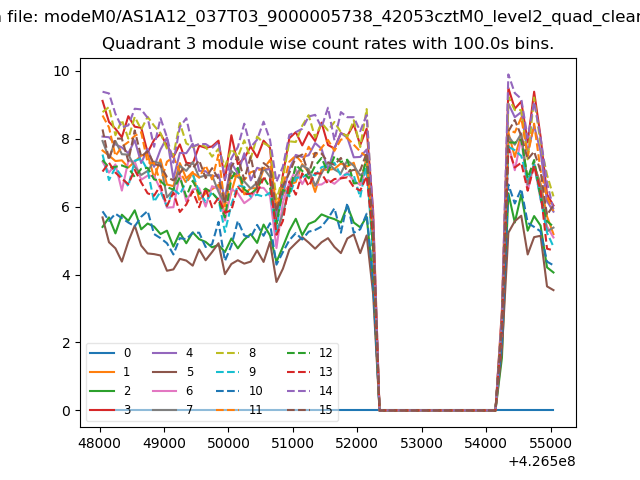
| Module-wise count rates for Quadrant C Data is divided into 100 sec bins |
 |
 |
| Module-wise count rates for Quadrant D Data is divided into 100 sec bins |
 |
 |
| Parameter | Plot |
|---|---|
| CZT HV Monitor | 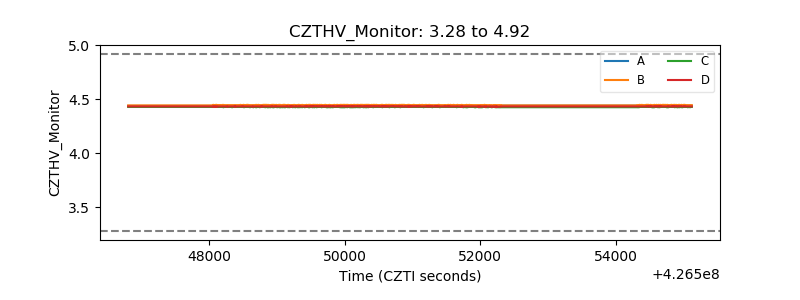 |
| D_VDD | 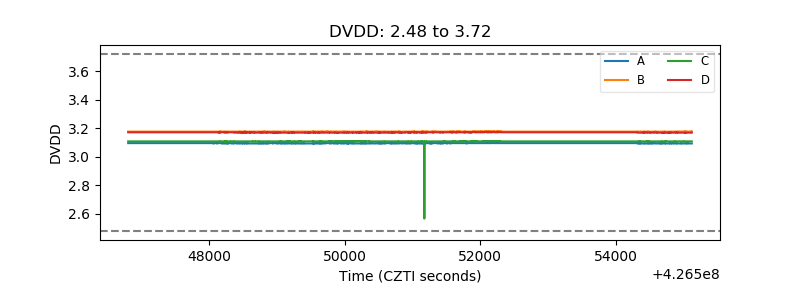 |
| Temperature 1 | 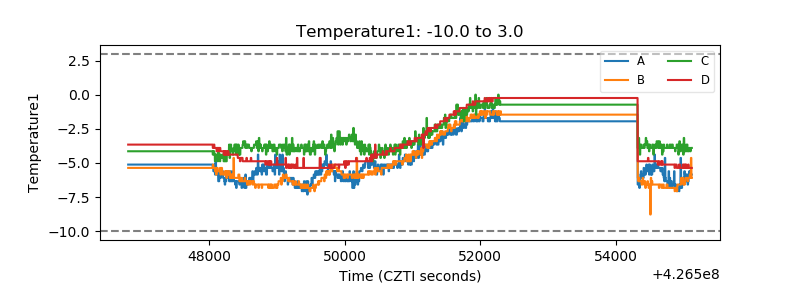 |
| Veto HV Monitor | 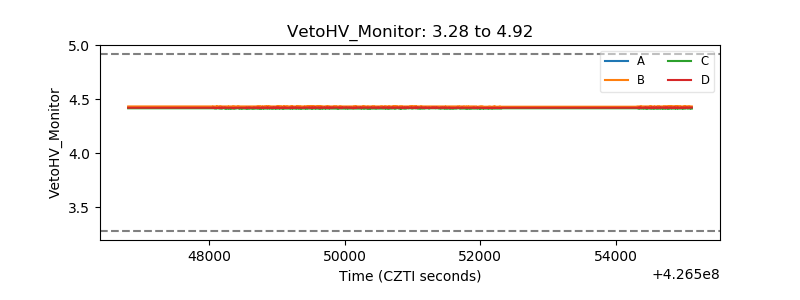 |
| Veto LLD | 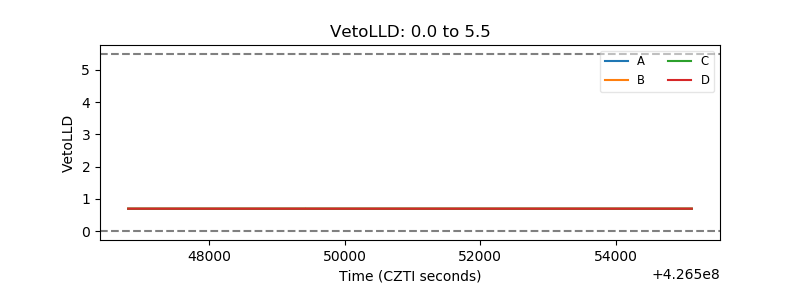 |
| Alpha Counter |  |
| _CPM_Rate |  |
| CZT Counter | 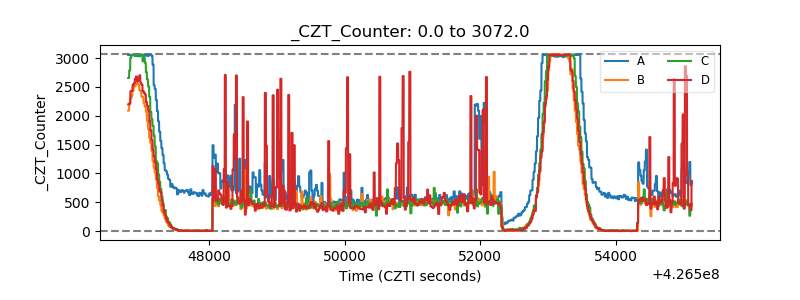 |
| +2.5 Volts monitor | 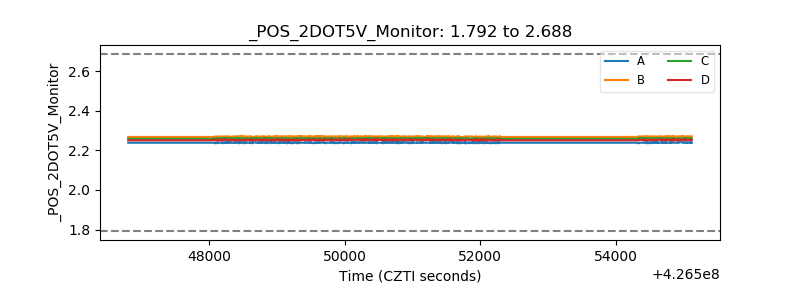 |
| +5 Volts monitor |  |
| _ROLL_ROT | 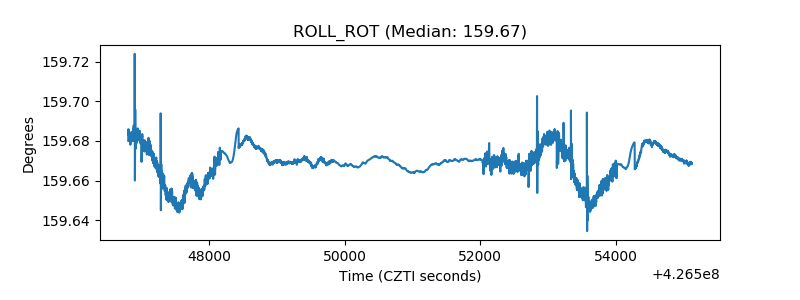 |
| _Roll_DEC | 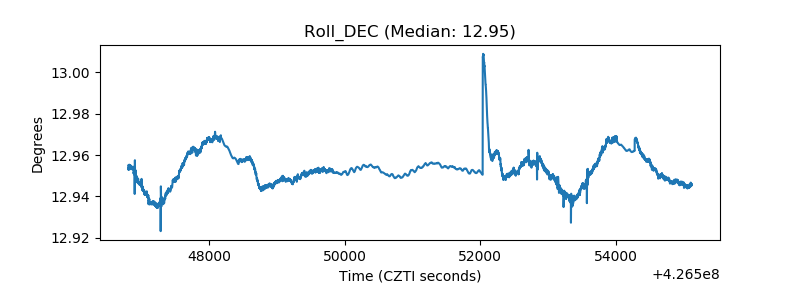 |
| _Roll_RA | 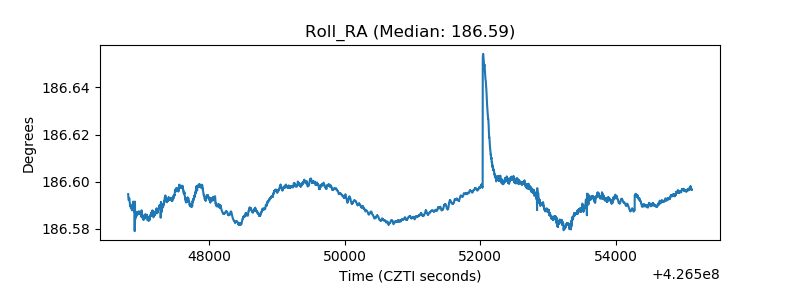 |
| Veto Counter | 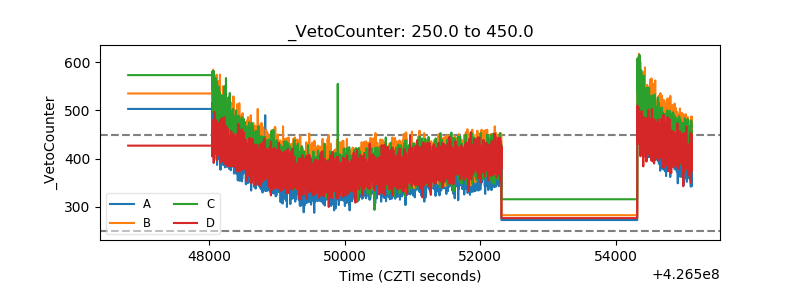 |