| Param | Original file | Final file |
|---|---|---|
| Filename | modeM0/AS1A12_037T03_9000005738_42072cztM0_level2.fits | modeM0/AS1A12_037T03_9000005738_42072cztM0_level2_quad_clean.evt |
| Size (bytes) | 356,264,640 | 87,261,120 |
| Size | 339.8 MB | 83.2 MB |
| Events in quadrant A | 4,406,140 | 577,832 |
| Events in quadrant B | 2,552,412 | 603,640 |
| Events in quadrant C | 2,497,493 | 572,291 |
| Events in quadrant D | 3,316,156 | 514,632 |
| Mode SS | |||
|---|---|---|---|
| Quadrant | BADHDUFLAG | Total packets | Discarded packets |
| A | 0 | 108 | 0 |
| B | 0 | 108 | 0 |
| C | 0 | 108 | 0 |
| D | 0 | 108 | 0 |
| Mode M9 | |||
|---|---|---|---|
| Quadrant | BADHDUFLAG | Total packets | Discarded packets |
| A | 0 | 27 | 0 |
| B | 0 | 27 | 0 |
| C | 0 | 27 | 0 |
| D | 0 | 28 | 0 |
| Mode M0 | |||
|---|---|---|---|
| Quadrant | BADHDUFLAG | Total packets | Discarded packets |
| A | 0 | 16680 | 3 |
| B | 0 | 11291 | 2 |
| C | 0 | 10754 | 2 |
| D | 0 | 13559 | 2 |
| Quadrant | Total seconds | Saturated seconds | Saturation percentage |
|---|---|---|---|
| A | 5342 | 121 | 2.265069% |
| B | 5342 | 46 | 0.861101% |
| C | 5342 | 5 | 0.093598% |
| D | 5342 | 177 | 3.313366% |
Noise dominated data is calculated using 1-second bins in cleaned event files. If a bin has >2000 counts, and if more than 50% of those come from <1% of pixels, then it is considered to be noise-dominated and hence unusable.
| Quadrant | # 1 sec bins | Bins with >0 counts | Bins with >2000 counts | High rate bins dominated by noise | Noise dominated (total time) | Noise dominated (detector-on time) | Marked lightcurve |
|---|---|---|---|---|---|---|---|
| A | 7044 | 5343 | 113 | 113 | 1.60% | 2.11% | 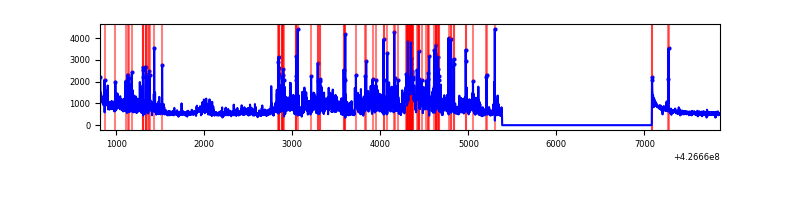 |
| B | 7044 | 5343 | 32 | 32 | 0.45% | 0.60% | 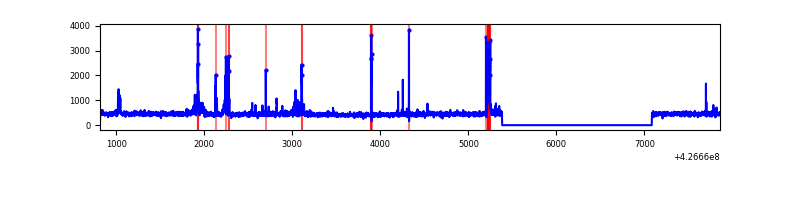 |
| C | 7044 | 5343 | 0 | 0 | 0.00% | 0.00% | 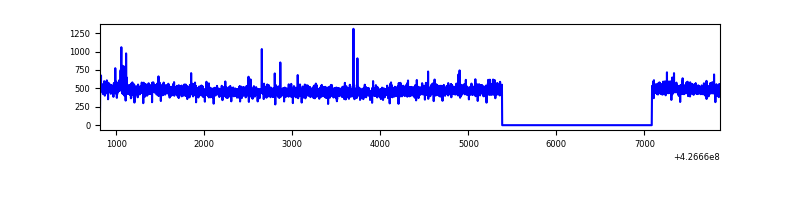 |
| D | 7044 | 5343 | 133 | 133 | 1.89% | 2.49% | 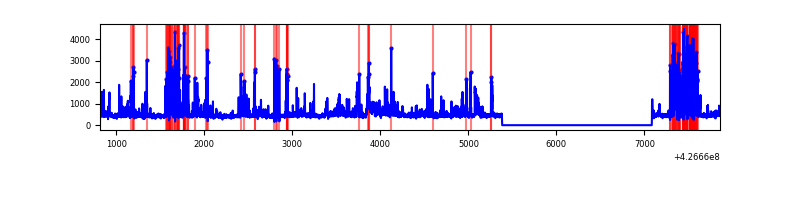 |
Top three noisy pixels from each quadrant. If the there are fewer than three noisy pixels in the level2.evt file, extra rows are filled as -1
| Pixel properties | Quadrant properties | ||||||
|---|---|---|---|---|---|---|---|
| Quadrant | DetID | PixID | Counts | Sigma | Mean | Median | Sigma |
| A | 15 | 222 | 1394942 | 11443.93 | 589 | 575 | 121.8 |
| A | 10 | 83 | 563243 | 4617.96 | 589 | 575 | 121.8 |
| A | 15 | 223 | 133848 | 1093.81 | 589 | 575 | 121.8 |
| B | 3 | 112 | 127784 | 1101.0 | 589 | 572 | 115.5 |
| B | 5 | 255 | 89889 | 773.02 | 589 | 572 | 115.5 |
| B | 15 | 85 | 22280 | 187.88 | 589 | 572 | 115.5 |
| C | 15 | 214 | 225786 | 1671.06 | 576 | 581 | 134.8 |
| C | 12 | 249 | 16663 | 119.33 | 576 | 581 | 134.8 |
| C | 7 | 220 | 4405 | 28.37 | 576 | 581 | 134.8 |
| D | 12 | 6 | 434204 | 3070.19 | 569 | 553 | 141.2 |
| D | 1 | 52 | 316524 | 2237.03 | 569 | 553 | 141.2 |
| D | 12 | 233 | 125632 | 885.54 | 569 | 553 | 141.2 |
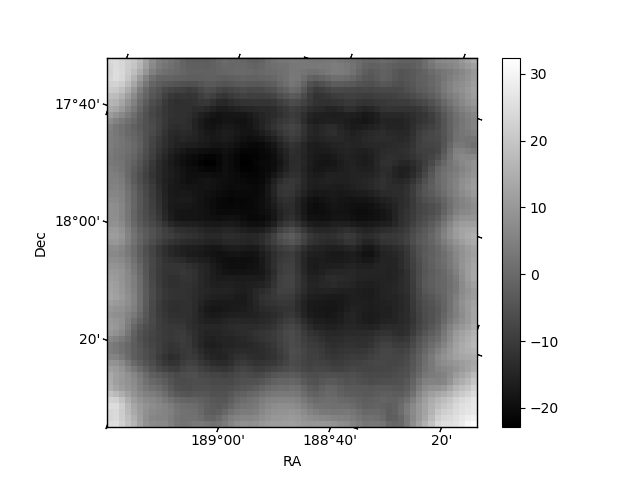
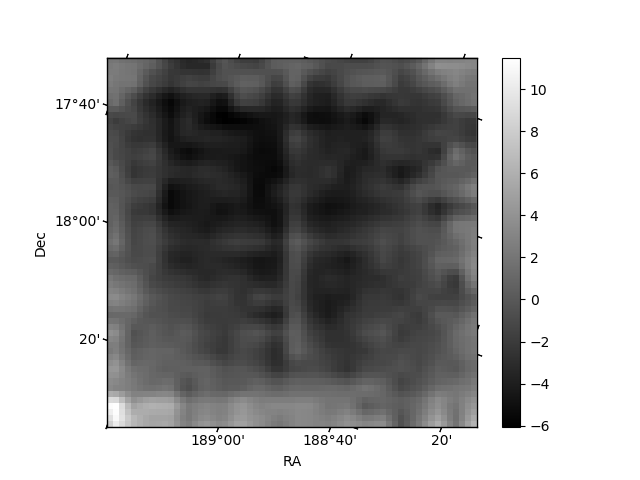
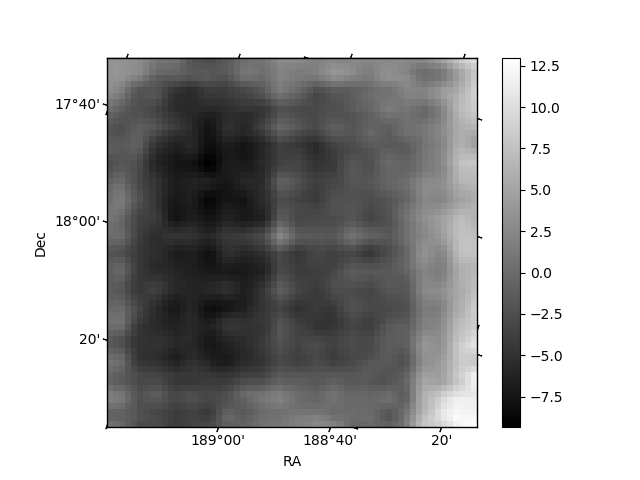
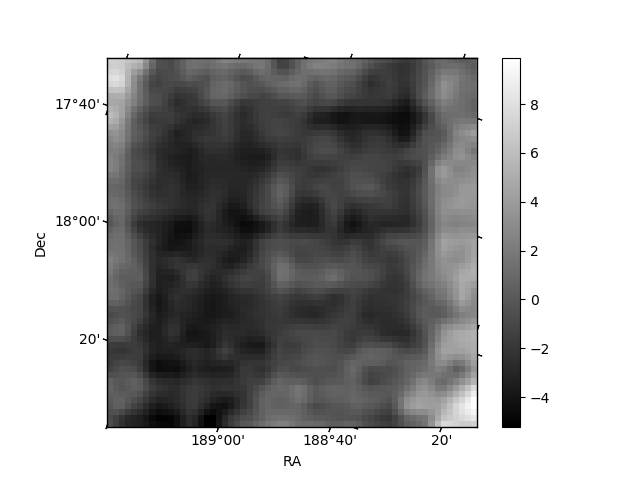
Histogram calculated using DETX and DETY for each event in the final _common_clean file
| Quadrant A | 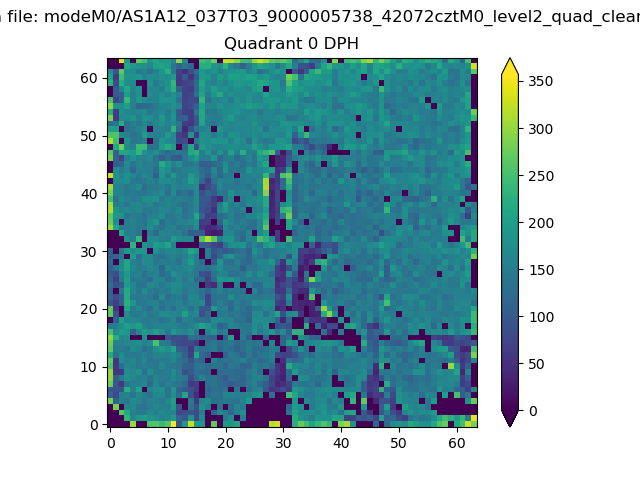 |
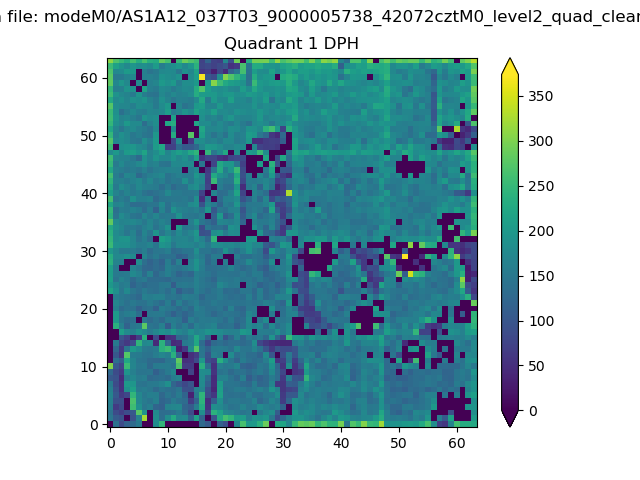 |
Quadrant B |
|---|---|---|---|
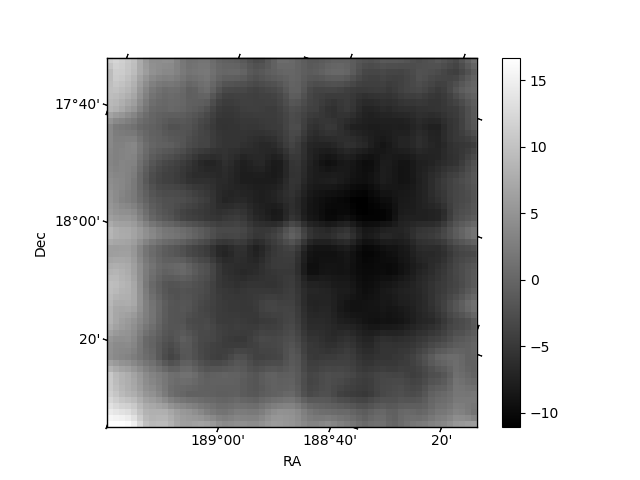
| Quadrant D | 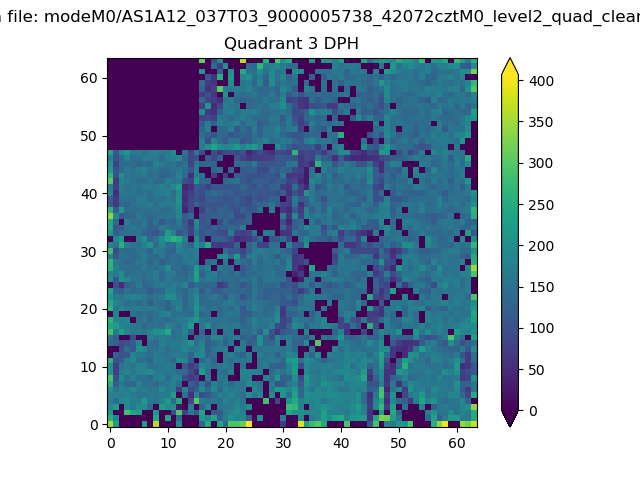 |
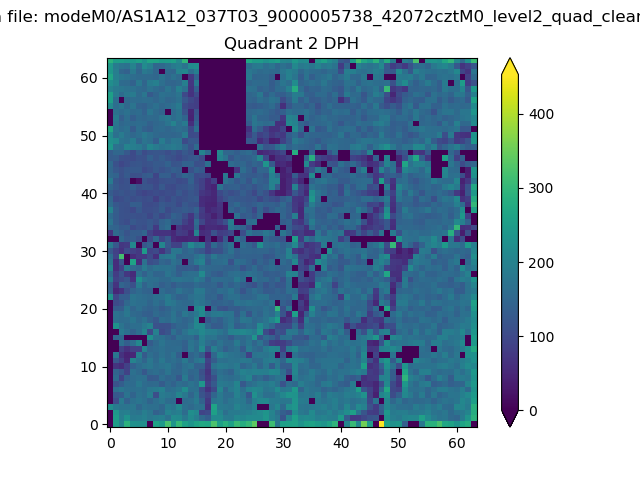 |
Quadrant C |
| Plot type | Count rate plots | Images |
|---|---|---|
| Comparison with Poisson distribution Blue bars denote a histogram of data divided into 1 sec bins. Red curve is a Poisson curve with rate = median count rate of data. |
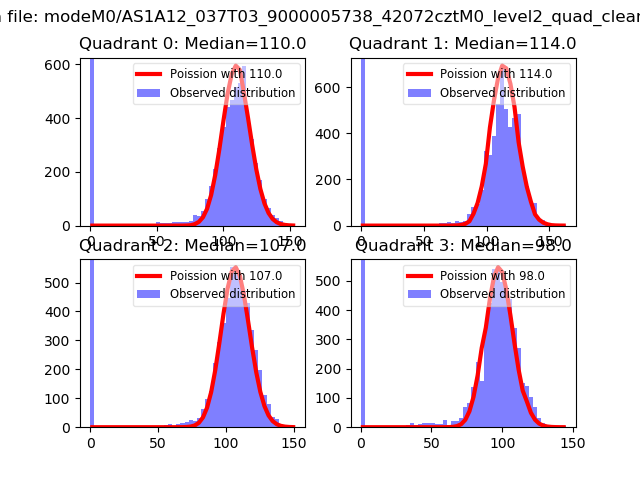 |
 |
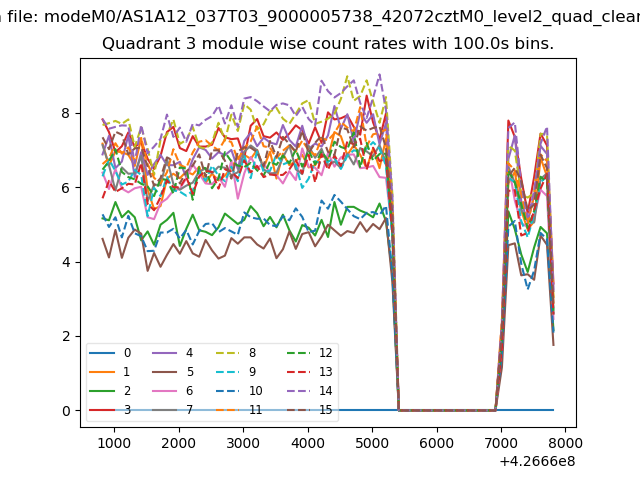
| Quadrant-wise count rates Data is divided into 100 sec bins |
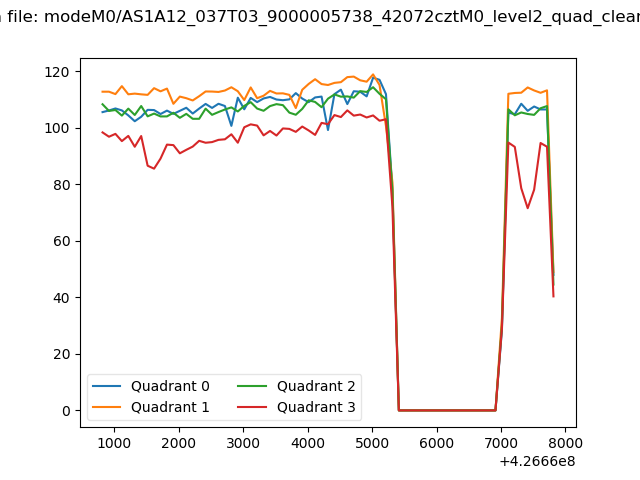 |
|
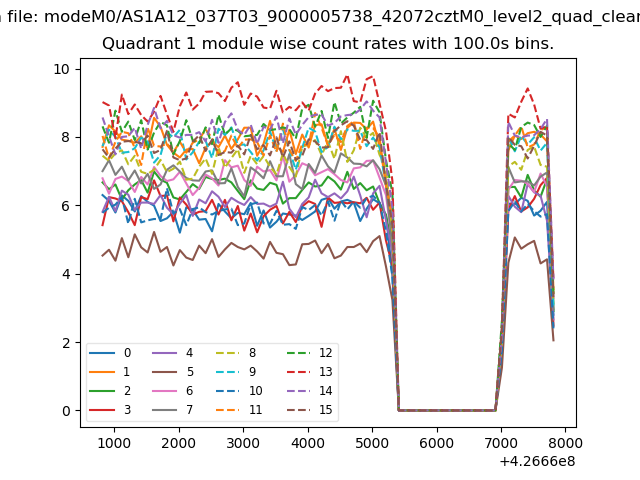
| Module-wise count rates for Quadrant A Data is divided into 100 sec bins |
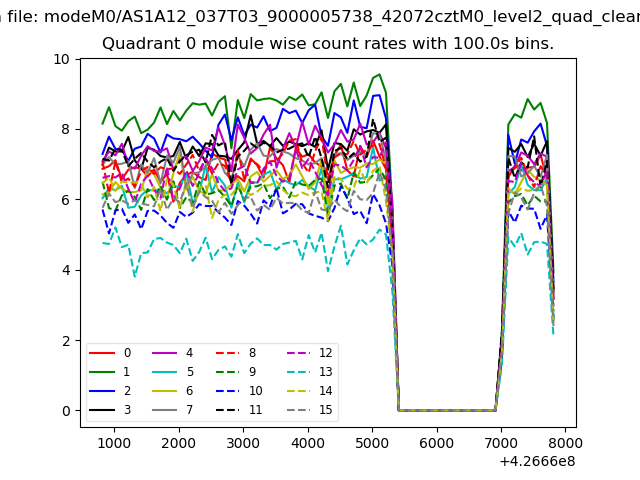 |
 |
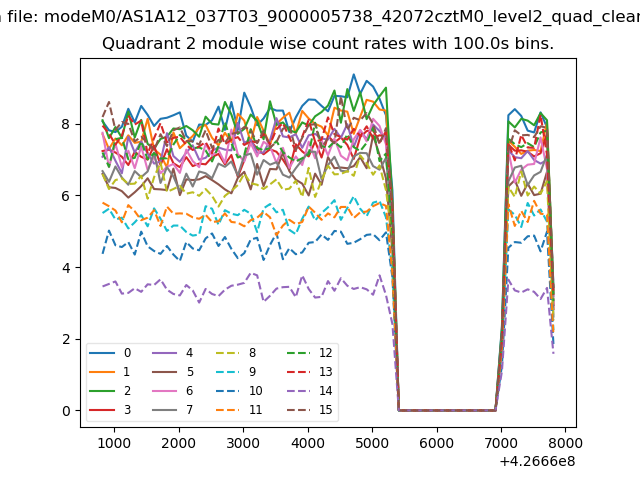
| Module-wise count rates for Quadrant B Data is divided into 100 sec bins |
 |
 |
| Module-wise count rates for Quadrant C Data is divided into 100 sec bins |
 |
 |
| Module-wise count rates for Quadrant D Data is divided into 100 sec bins |
 |
 |
| Parameter | Plot |
|---|---|
| CZT HV Monitor | 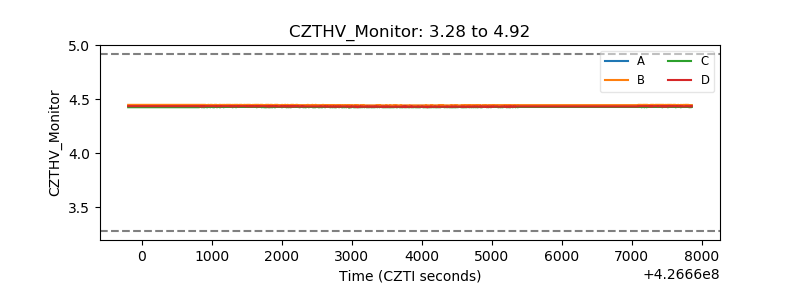 |
| D_VDD | 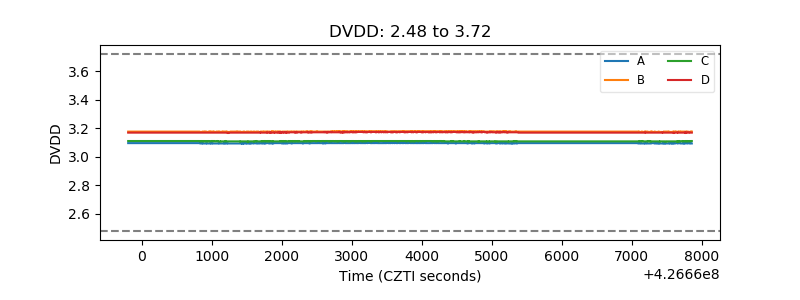 |
| Temperature 1 | 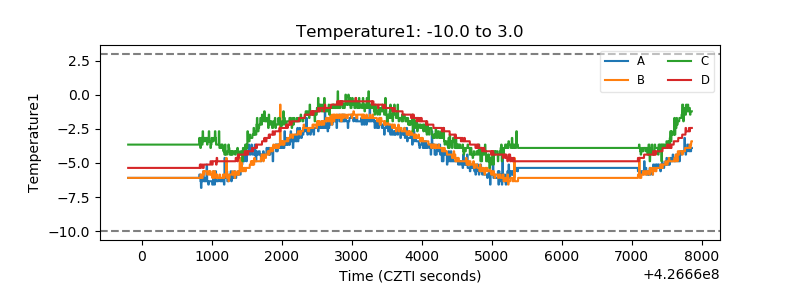 |
| Veto HV Monitor | 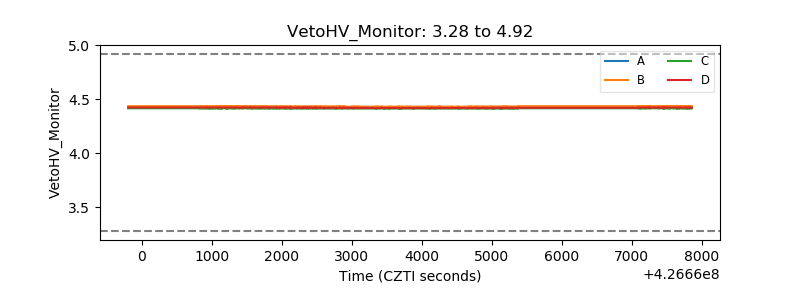 |
| Veto LLD | 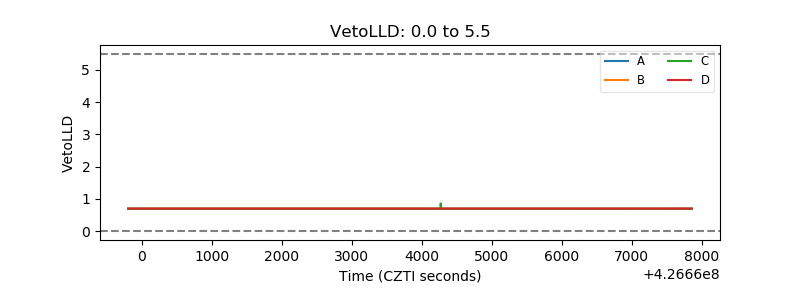 |
| Alpha Counter |  |
| _CPM_Rate | 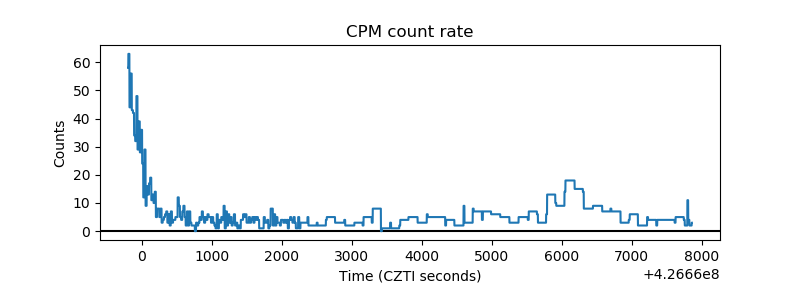 |
| CZT Counter | 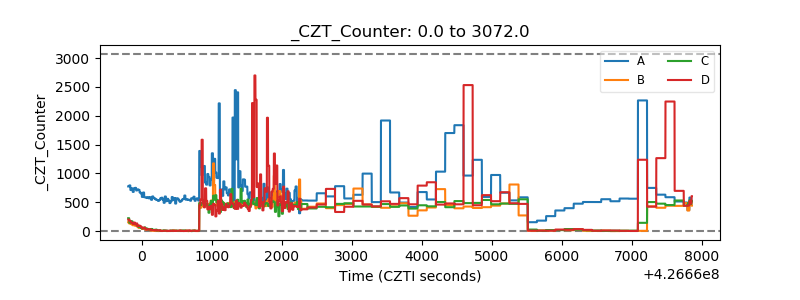 |
| +2.5 Volts monitor |  |
| +5 Volts monitor | 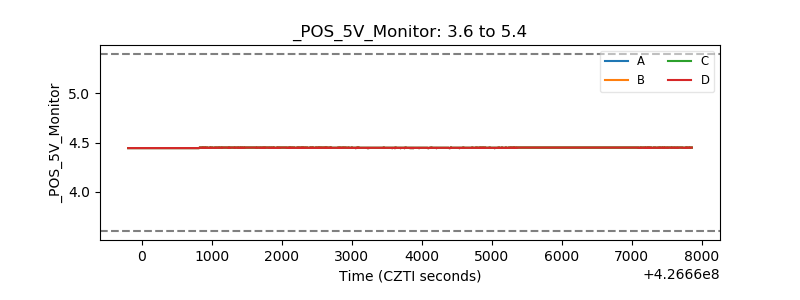 |
| _ROLL_ROT | 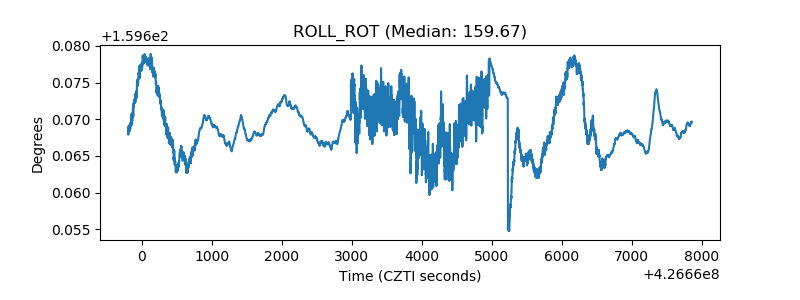 |
| _Roll_DEC | 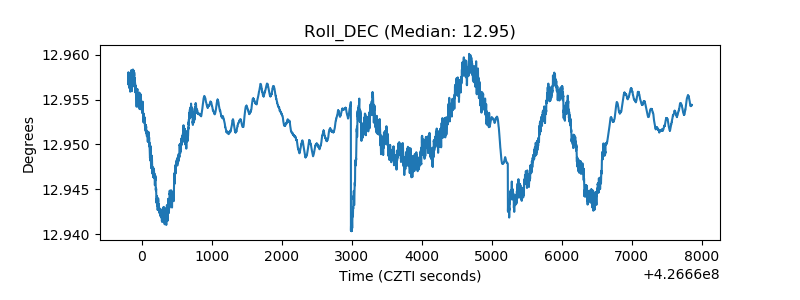 |
| _Roll_RA | 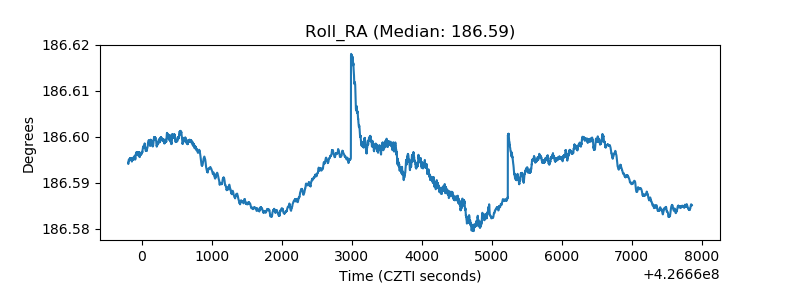 |
| Veto Counter | 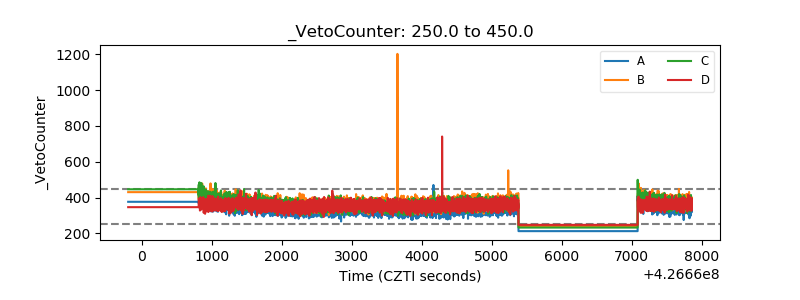 |