| Param | Original file | Final file |
|---|---|---|
| Filename | modeM0/AS1A12_037T03_9000005738_42054cztM0_level2.fits | modeM0/AS1A12_037T03_9000005738_42054cztM0_level2_quad_clean.evt |
| Size (bytes) | 209,004,480 | 48,660,480 |
| Size | 199.3 MB | 46.4 MB |
| Events in quadrant A | 3,073,616 | 321,892 |
| Events in quadrant B | 1,355,126 | 345,474 |
| Events in quadrant C | 1,353,222 | 320,931 |
| Events in quadrant D | 1,741,354 | 290,193 |
| Mode SS | |||
|---|---|---|---|
| Quadrant | BADHDUFLAG | Total packets | Discarded packets |
| A | 0 | 58 | 0 |
| B | 0 | 58 | 0 |
| C | 0 | 58 | 0 |
| D | 0 | 58 | 0 |
| Mode M9 | |||
|---|---|---|---|
| Quadrant | BADHDUFLAG | Total packets | Discarded packets |
| A | 0 | 21 | 0 |
| B | 0 | 21 | 0 |
| C | 0 | 21 | 0 |
| D | 0 | 21 | 0 |
| Mode M0 | |||
|---|---|---|---|
| Quadrant | BADHDUFLAG | Total packets | Discarded packets |
| A | 0 | 11064 | 1 |
| B | 0 | 5655 | 1 |
| C | 0 | 5498 | 1 |
| D | 0 | 6941 | 1 |
| Quadrant | Total seconds | Saturated seconds | Saturation percentage |
|---|---|---|---|
| A | 2721 | 193 | 7.092981% |
| B | 2721 | 9 | 0.330761% |
| C | 2721 | 2 | 0.073502% |
| D | 2721 | 80 | 2.940096% |
Noise dominated data is calculated using 1-second bins in cleaned event files. If a bin has >2000 counts, and if more than 50% of those come from <1% of pixels, then it is considered to be noise-dominated and hence unusable.
| Quadrant | # 1 sec bins | Bins with >0 counts | Bins with >2000 counts | High rate bins dominated by noise | Noise dominated (total time) | Noise dominated (detector-on time) | Marked lightcurve |
|---|---|---|---|---|---|---|---|
| A | 4815 | 2722 | 156 | 156 | 3.24% | 5.73% | 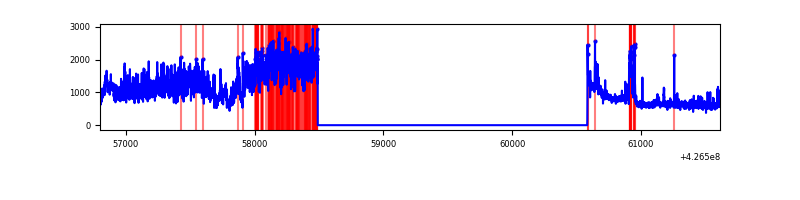 |
| B | 4815 | 2722 | 6 | 6 | 0.12% | 0.22% | 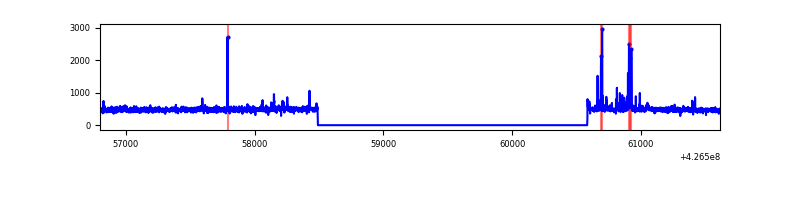 |
| C | 4815 | 2722 | 0 | 0 | 0.00% | 0.00% | 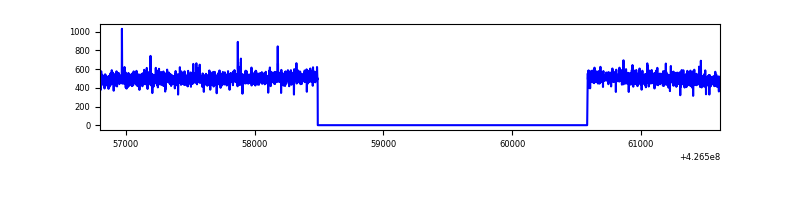 |
| D | 4815 | 2722 | 64 | 64 | 1.33% | 2.35% | 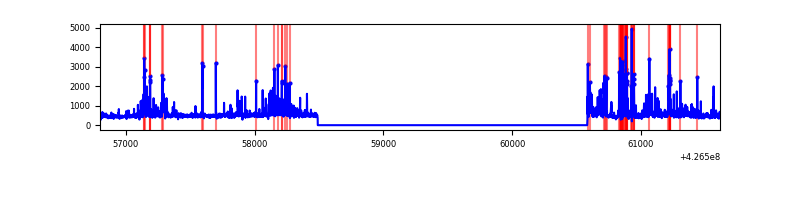 |
Top three noisy pixels from each quadrant. If the there are fewer than three noisy pixels in the level2.evt file, extra rows are filled as -1
| Pixel properties | Quadrant properties | ||||||
|---|---|---|---|---|---|---|---|
| Quadrant | DetID | PixID | Counts | Sigma | Mean | Median | Sigma |
| A | 15 | 223 | 1524047 | 22395.68 | 323 | 317 | 68.0 |
| A | 10 | 83 | 269650 | 3958.64 | 323 | 317 | 68.0 |
| A | 12 | 189 | 10501 | 149.68 | 323 | 317 | 68.0 |
| B | 5 | 255 | 52636 | 808.12 | 327 | 318 | 64.7 |
| B | 3 | 112 | 7828 | 116.0 | 327 | 318 | 64.7 |
| B | 12 | 111 | 7777 | 115.21 | 327 | 318 | 64.7 |
| C | 15 | 214 | 113271 | 1506.88 | 316 | 319 | 75.0 |
| C | 12 | 249 | 2859 | 33.89 | 316 | 319 | 75.0 |
| C | 0 | 207 | 2467 | 28.66 | 316 | 319 | 75.0 |
| D | 13 | 249 | 164764 | 2104.24 | 312 | 304 | 78.2 |
| D | 12 | 6 | 163331 | 2085.91 | 312 | 304 | 78.2 |
| D | 1 | 52 | 105113 | 1341.02 | 312 | 304 | 78.2 |
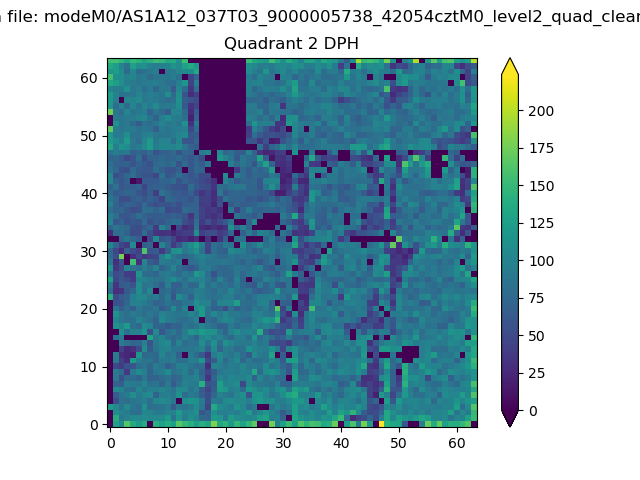
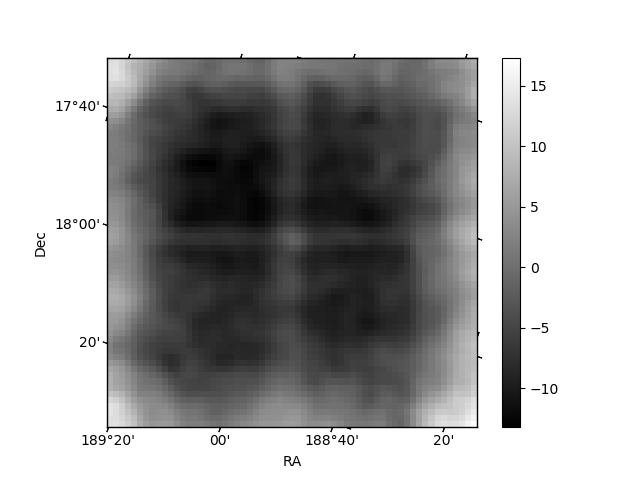
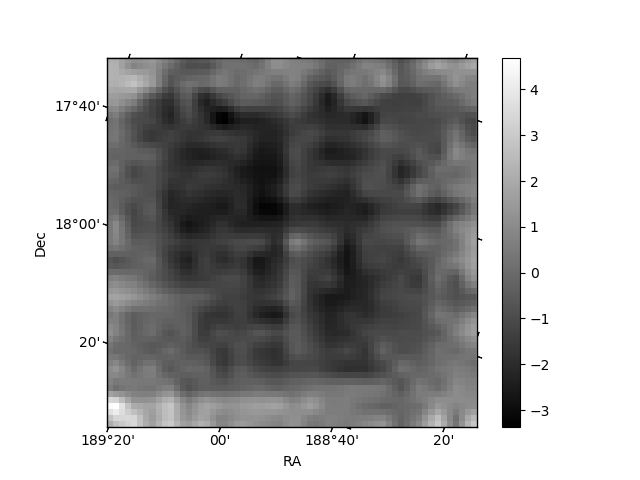
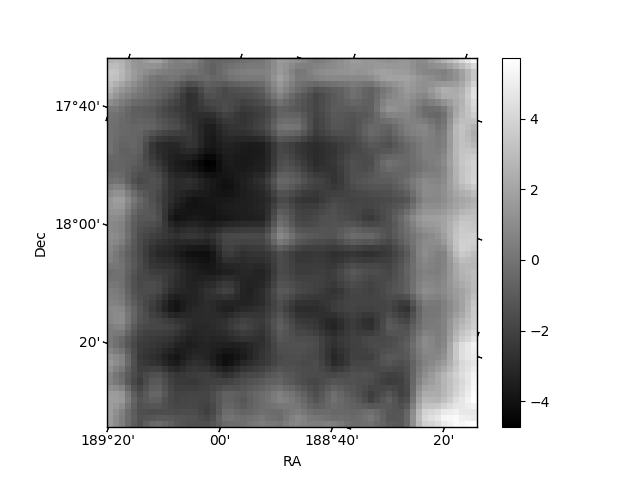
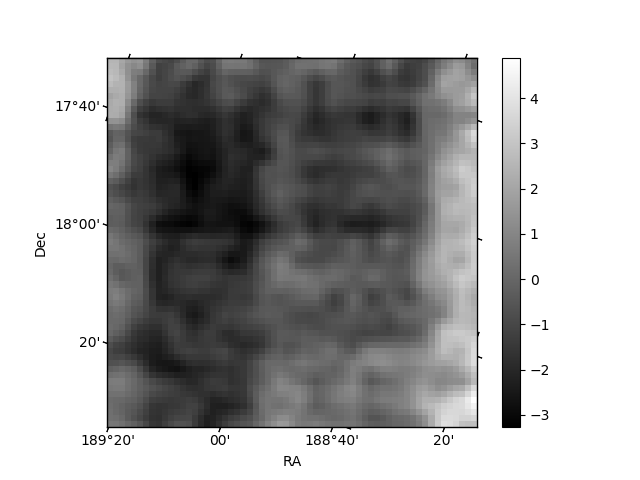
Histogram calculated using DETX and DETY for each event in the final _common_clean file
| Quadrant A | 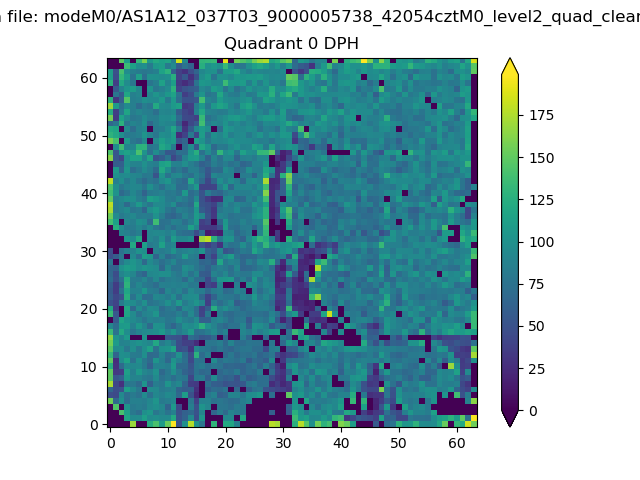 |
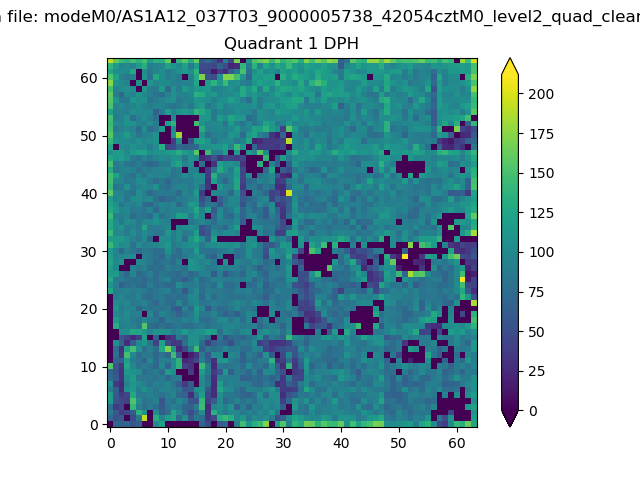 |
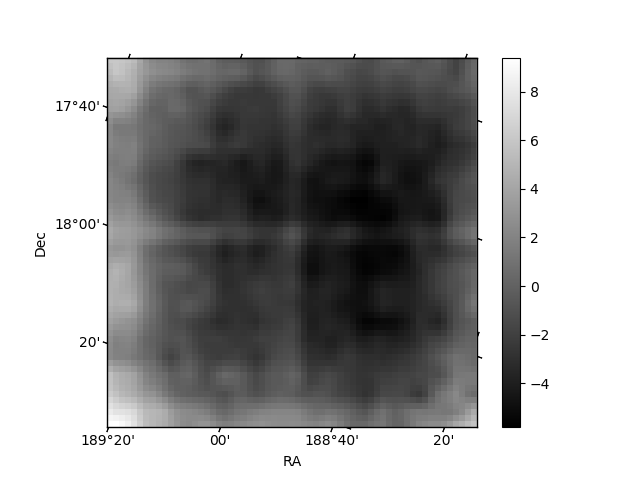
Quadrant B |
|---|---|---|---|
| Quadrant D | 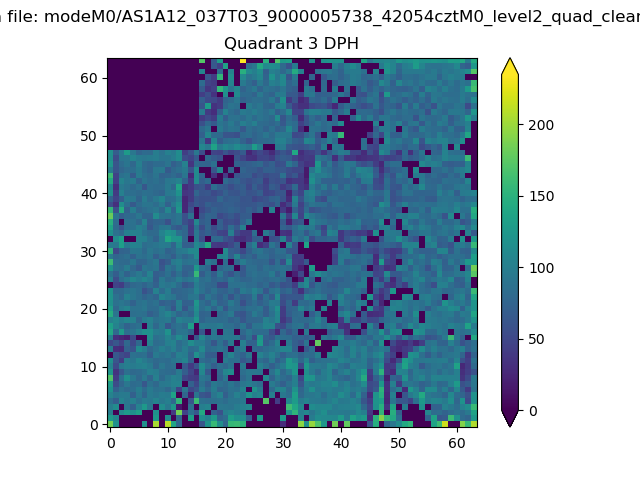 |
 |
Quadrant C |
| Plot type | Count rate plots | Images |
|---|---|---|
| Comparison with Poisson distribution Blue bars denote a histogram of data divided into 1 sec bins. Red curve is a Poisson curve with rate = median count rate of data. |
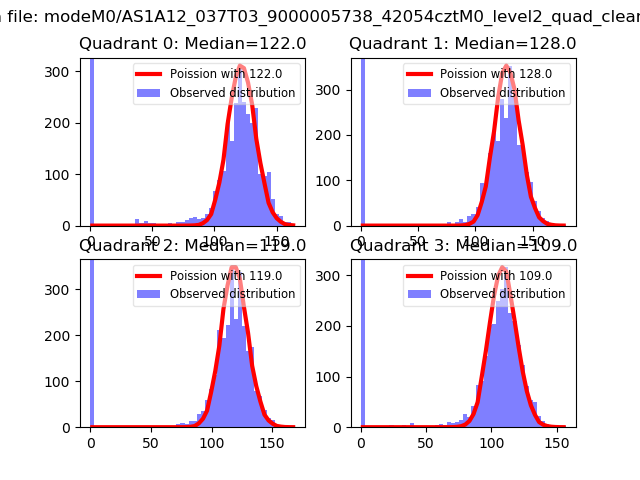 |
 |
| Quadrant-wise count rates Data is divided into 100 sec bins |
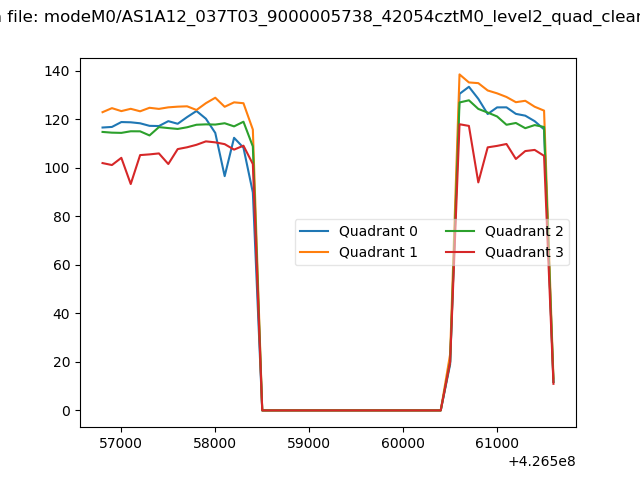 |
|
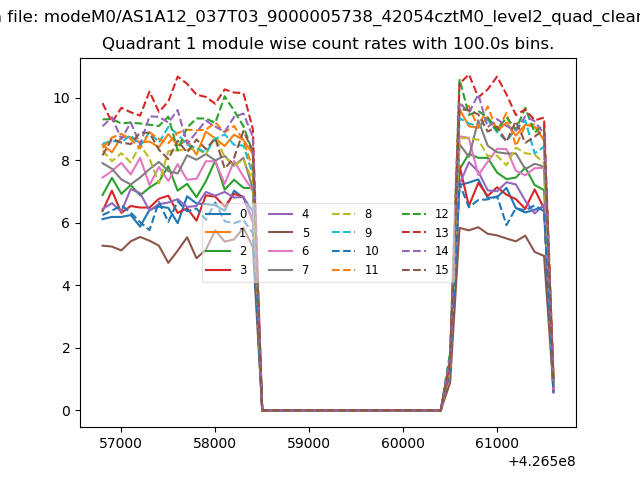
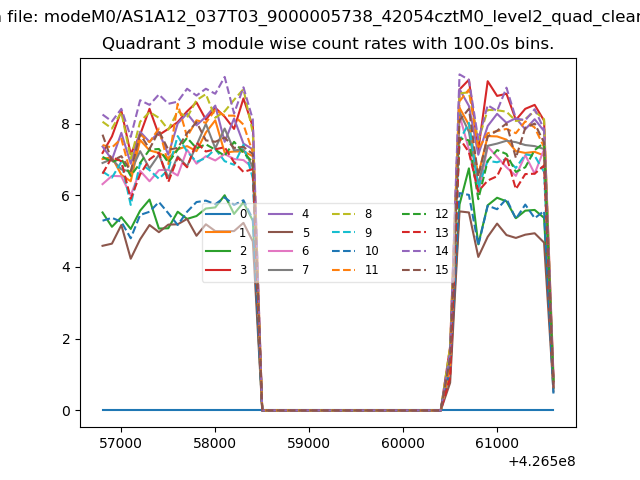
| Module-wise count rates for Quadrant A Data is divided into 100 sec bins |
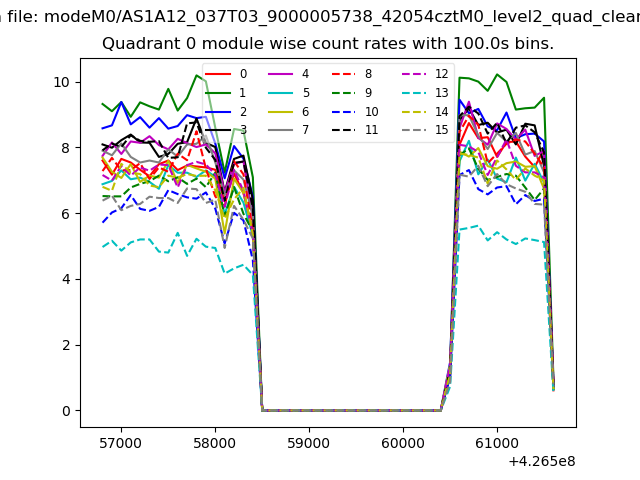 |
 |
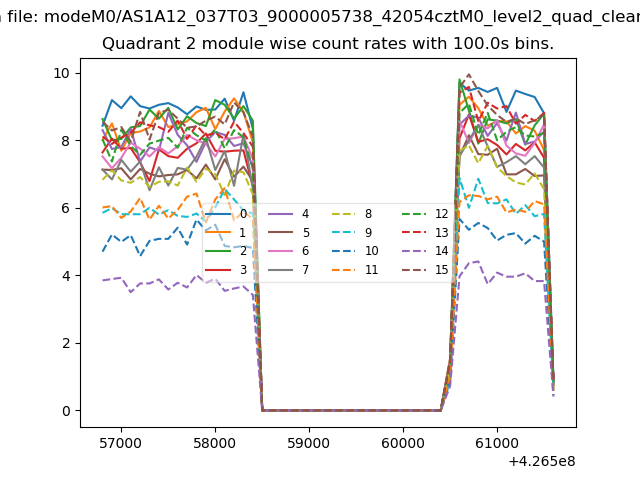
| Module-wise count rates for Quadrant B Data is divided into 100 sec bins |
 |
 |
| Module-wise count rates for Quadrant C Data is divided into 100 sec bins |
 |
 |
| Module-wise count rates for Quadrant D Data is divided into 100 sec bins |
 |
 |
| Parameter | Plot |
|---|---|
| CZT HV Monitor | 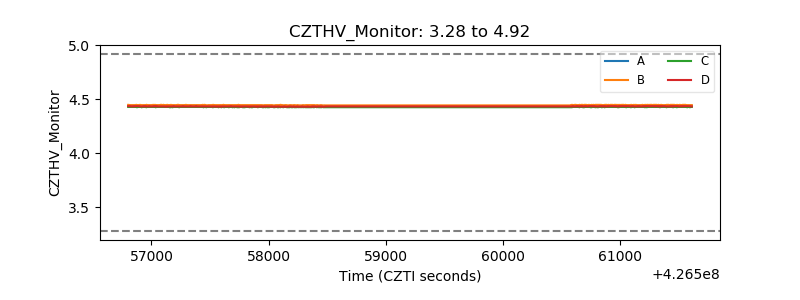 |
| D_VDD | 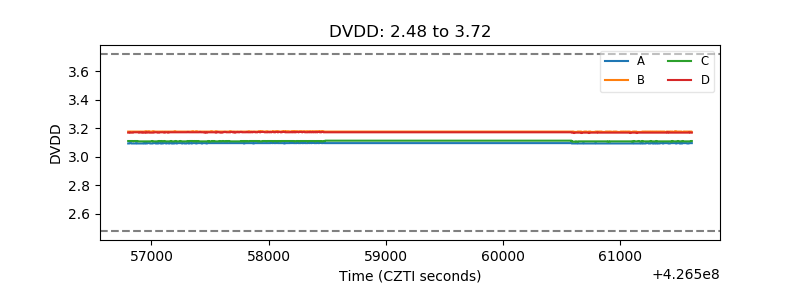 |
| Temperature 1 | 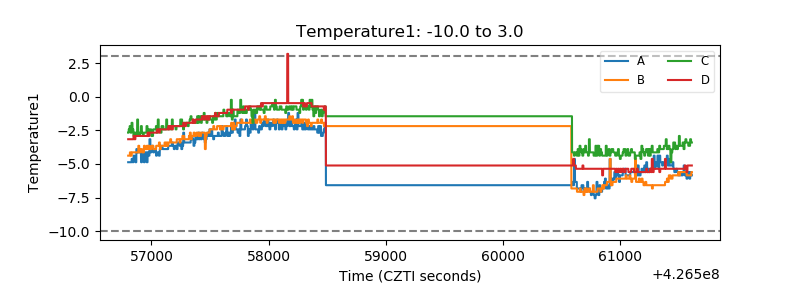 |
| Veto HV Monitor | 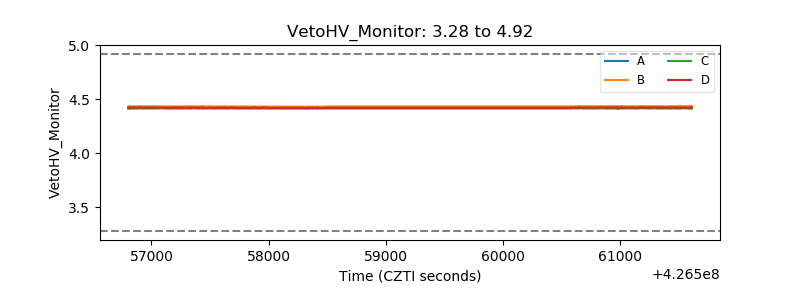 |
| Veto LLD | 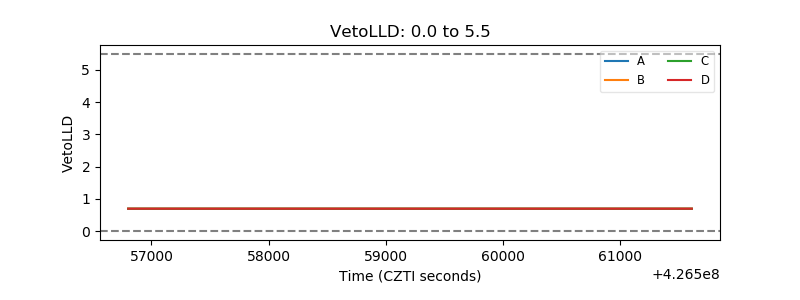 |
| Alpha Counter | 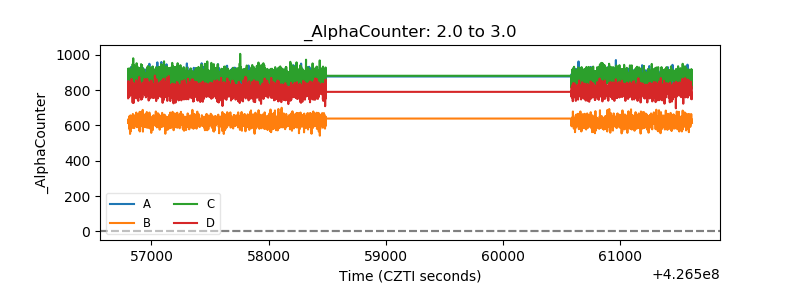 |
| _CPM_Rate |  |
| CZT Counter |  |
| +2.5 Volts monitor |  |
| +5 Volts monitor | 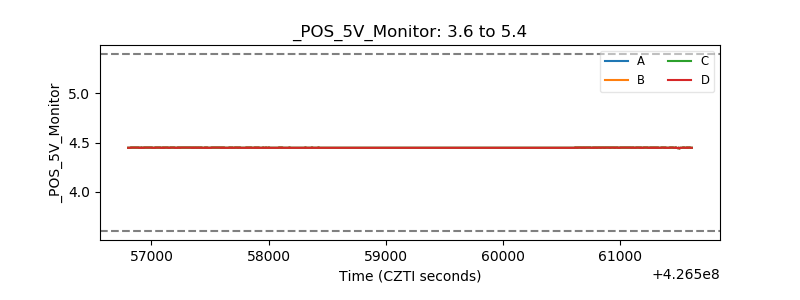 |
| _ROLL_ROT | 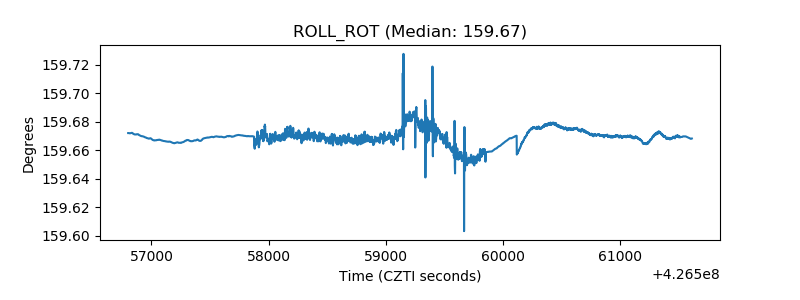 |
| _Roll_DEC | 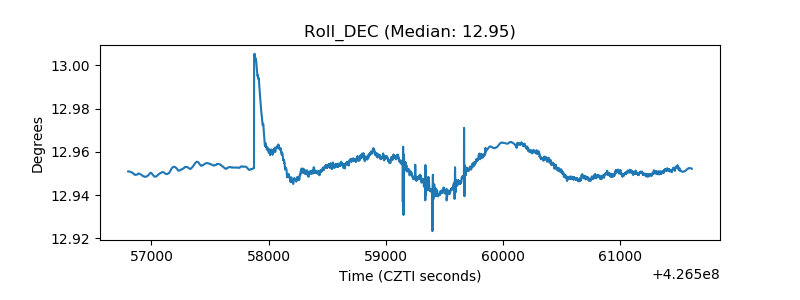 |
| _Roll_RA | 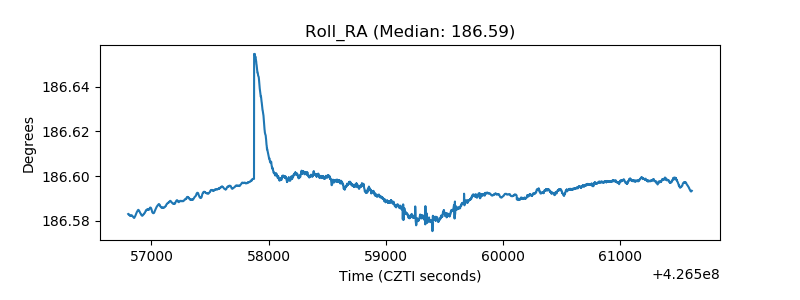 |
| Veto Counter | 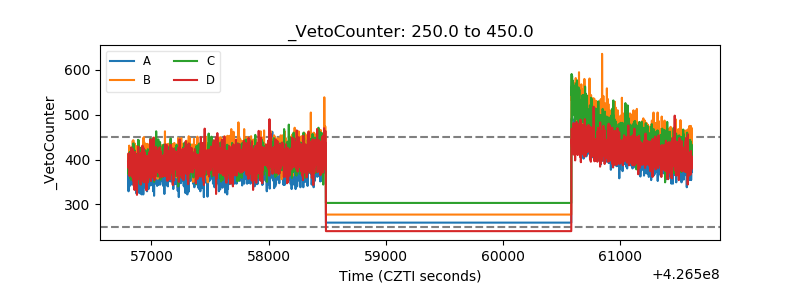 |