| Param | Original file | Final file |
|---|---|---|
| Filename | modeM0/AS1A12_037T03_9000005738_42055cztM0_level2.fits | modeM0/AS1A12_037T03_9000005738_42055cztM0_level2_quad_clean.evt |
| Size (bytes) | 352,903,680 | 87,419,520 |
| Size | 336.6 MB | 83.4 MB |
| Events in quadrant A | 4,623,629 | 561,645 |
| Events in quadrant B | 2,431,151 | 628,323 |
| Events in quadrant C | 2,448,076 | 584,229 |
| Events in quadrant D | 3,167,464 | 519,438 |
| Mode SS | |||
|---|---|---|---|
| Quadrant | BADHDUFLAG | Total packets | Discarded packets |
| A | 0 | 102 | 0 |
| B | 0 | 102 | 0 |
| C | 0 | 102 | 0 |
| D | 0 | 102 | 0 |
| Mode M9 | |||
|---|---|---|---|
| Quadrant | BADHDUFLAG | Total packets | Discarded packets |
| A | 0 | 30 | 0 |
| B | 0 | 30 | 0 |
| C | 0 | 31 | 0 |
| D | 0 | 31 | 0 |
| Mode M0 | |||
|---|---|---|---|
| Quadrant | BADHDUFLAG | Total packets | Discarded packets |
| A | 0 | 17152 | 2 |
| B | 0 | 10396 | 2 |
| C | 0 | 10163 | 2 |
| D | 0 | 12842 | 2 |
| Quadrant | Total seconds | Saturated seconds | Saturation percentage |
|---|---|---|---|
| A | 5048 | 463 | 9.171949% |
| B | 5048 | 15 | 0.297147% |
| C | 5048 | 4 | 0.079239% |
| D | 5048 | 192 | 3.803487% |
Noise dominated data is calculated using 1-second bins in cleaned event files. If a bin has >2000 counts, and if more than 50% of those come from <1% of pixels, then it is considered to be noise-dominated and hence unusable.
| Quadrant | # 1 sec bins | Bins with >0 counts | Bins with >2000 counts | High rate bins dominated by noise | Noise dominated (total time) | Noise dominated (detector-on time) | Marked lightcurve |
|---|---|---|---|---|---|---|---|
| A | 7201 | 5049 | 357 | 357 | 4.96% | 7.07% | 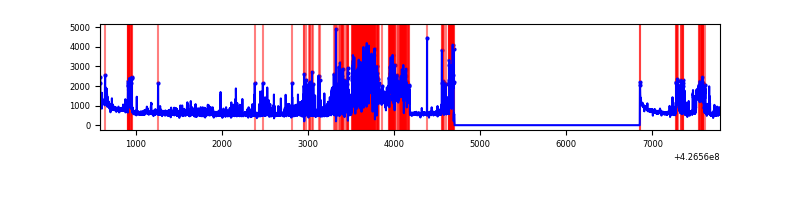 |
| B | 7201 | 5049 | 7 | 7 | 0.10% | 0.14% | 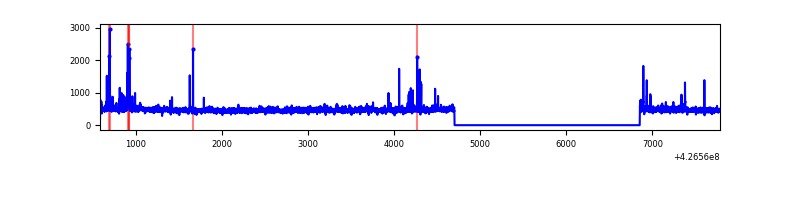 |
| C | 7201 | 5049 | 0 | 0 | 0.00% | 0.00% | 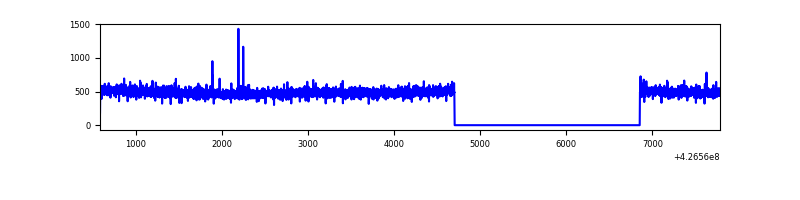 |
| D | 7201 | 5049 | 155 | 155 | 2.15% | 3.07% | 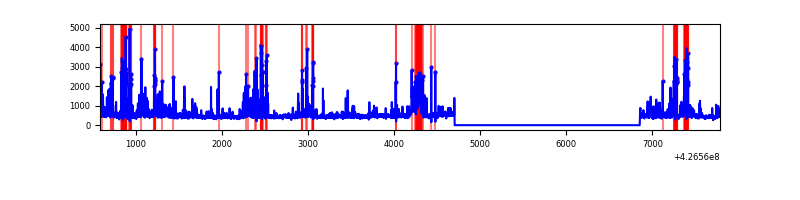 |
Top three noisy pixels from each quadrant. If the there are fewer than three noisy pixels in the level2.evt file, extra rows are filled as -1
| Pixel properties | Quadrant properties | ||||||
|---|---|---|---|---|---|---|---|
| Quadrant | DetID | PixID | Counts | Sigma | Mean | Median | Sigma |
| A | 15 | 223 | 1858435 | 15930.63 | 572 | 562 | 116.6 |
| A | 10 | 83 | 508797 | 4357.94 | 572 | 562 | 116.6 |
| A | 15 | 222 | 22741 | 190.18 | 572 | 562 | 116.6 |
| B | 5 | 255 | 56381 | 487.48 | 590 | 574 | 114.5 |
| B | 3 | 112 | 32612 | 279.86 | 590 | 574 | 114.5 |
| B | 0 | 229 | 23160 | 197.29 | 590 | 574 | 114.5 |
| C | 15 | 214 | 212170 | 1597.23 | 571 | 573 | 132.5 |
| C | 0 | 207 | 4843 | 32.23 | 571 | 573 | 132.5 |
| C | 13 | 61 | 3805 | 24.4 | 571 | 573 | 132.5 |
| D | 13 | 249 | 291846 | 2099.77 | 559 | 542 | 138.7 |
| D | 12 | 6 | 283030 | 2036.23 | 559 | 542 | 138.7 |
| D | 1 | 52 | 253607 | 1824.14 | 559 | 542 | 138.7 |
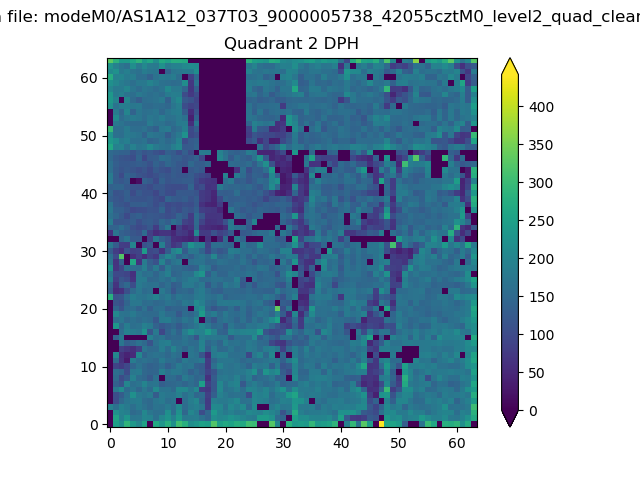
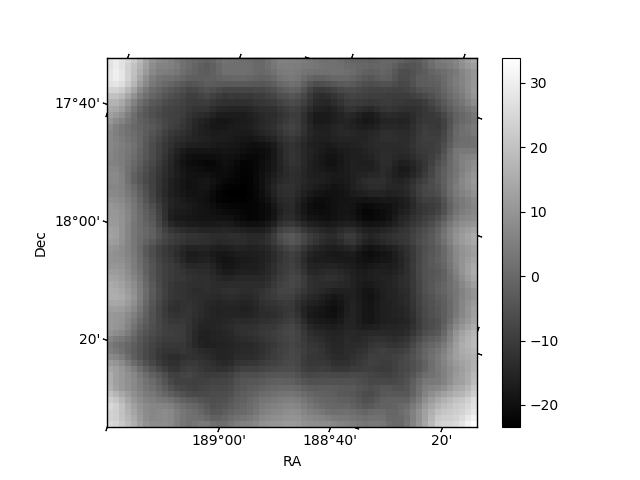
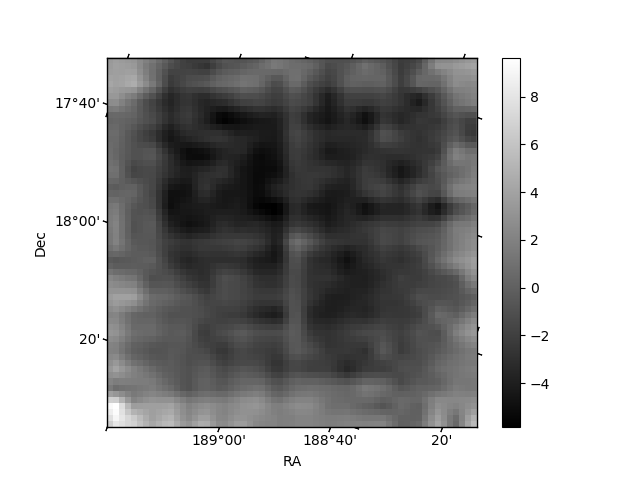
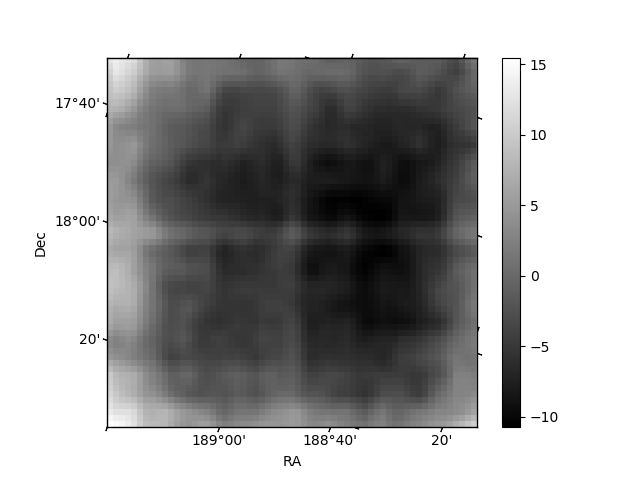
Histogram calculated using DETX and DETY for each event in the final _common_clean file
| Quadrant A | 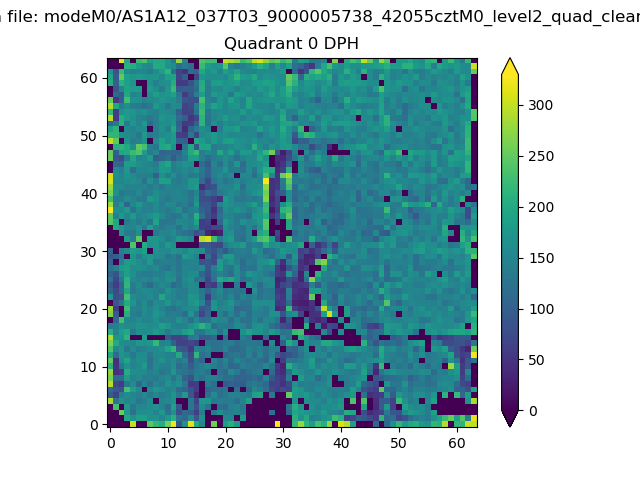 |
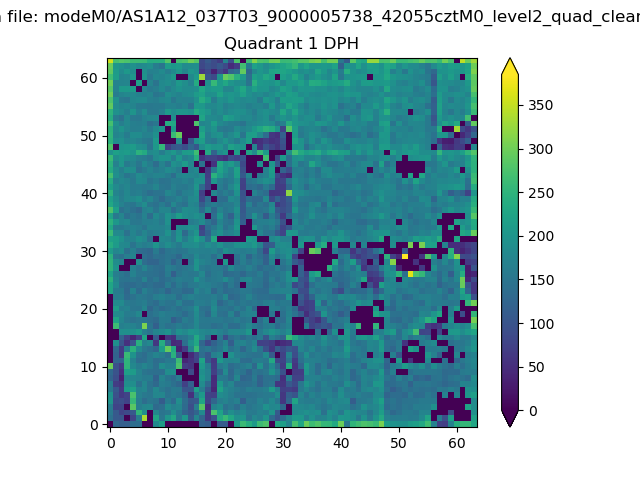 |
Quadrant B |
|---|---|---|---|
| Quadrant D | 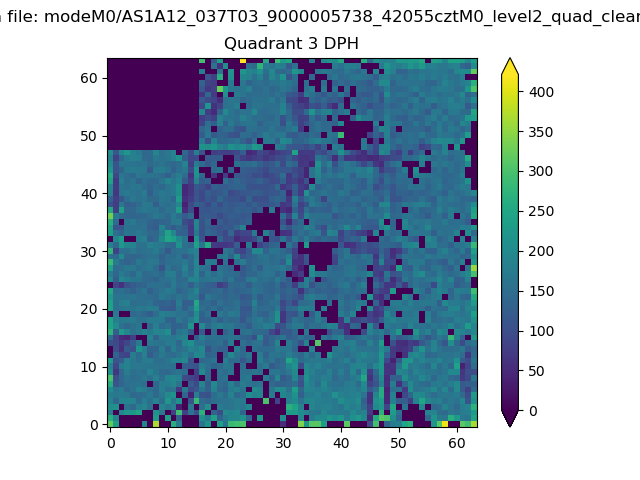 |
 |
Quadrant C |
| Plot type | Count rate plots | Images |
|---|---|---|
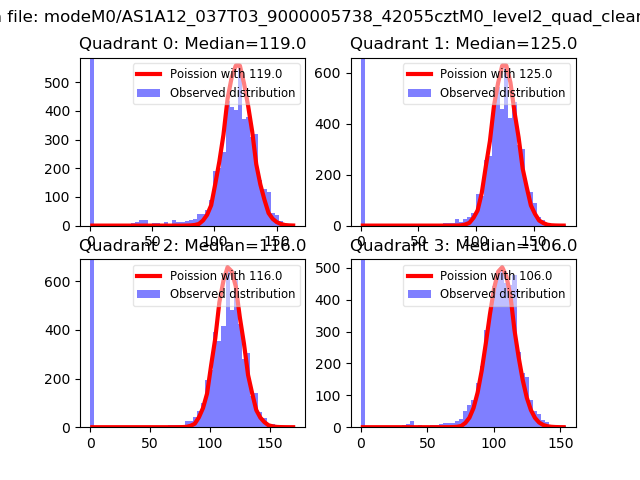
| Comparison with Poisson distribution Blue bars denote a histogram of data divided into 1 sec bins. Red curve is a Poisson curve with rate = median count rate of data. |
 |
 |
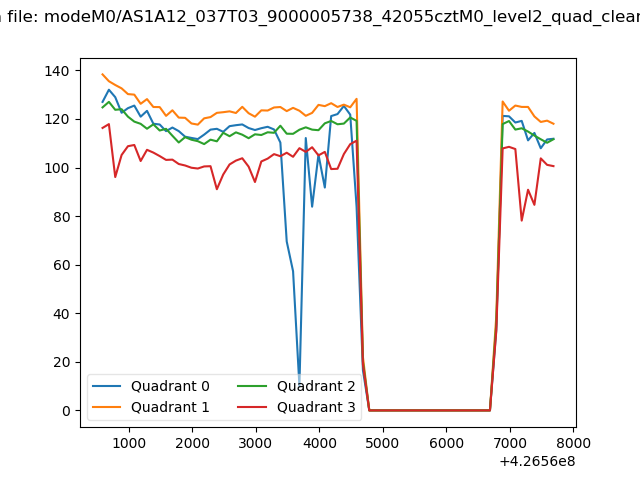
| Quadrant-wise count rates Data is divided into 100 sec bins |
 |
|
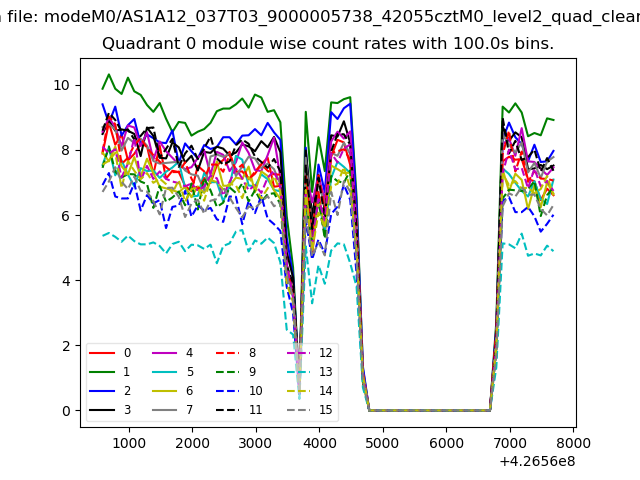
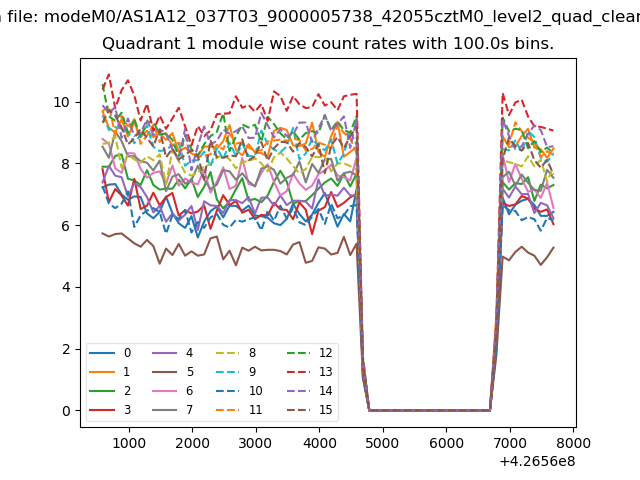
| Module-wise count rates for Quadrant A Data is divided into 100 sec bins |
 |
 |
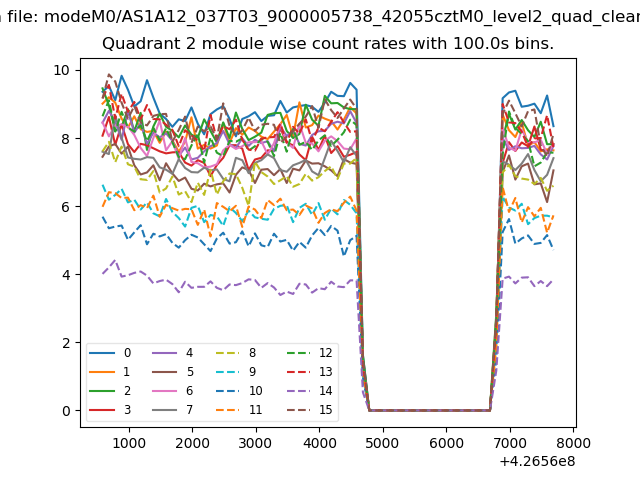
| Module-wise count rates for Quadrant B Data is divided into 100 sec bins |
 |
 |
| Module-wise count rates for Quadrant C Data is divided into 100 sec bins |
 |
 |
| Module-wise count rates for Quadrant D Data is divided into 100 sec bins |
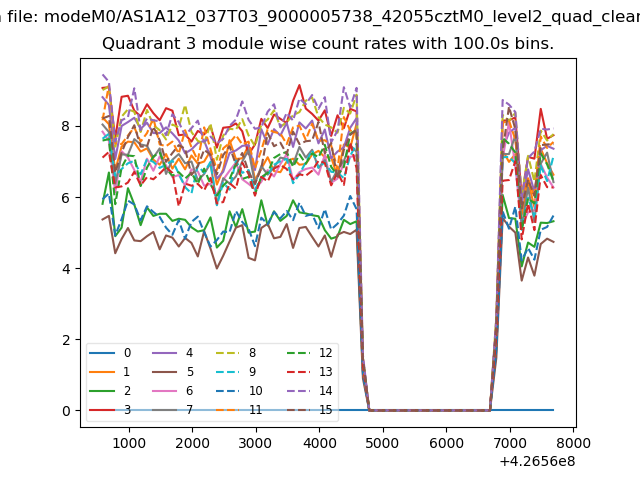 |
 |
| Parameter | Plot |
|---|---|
| CZT HV Monitor | 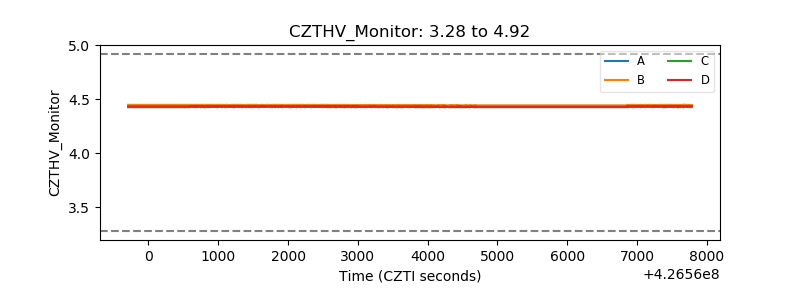 |
| D_VDD | 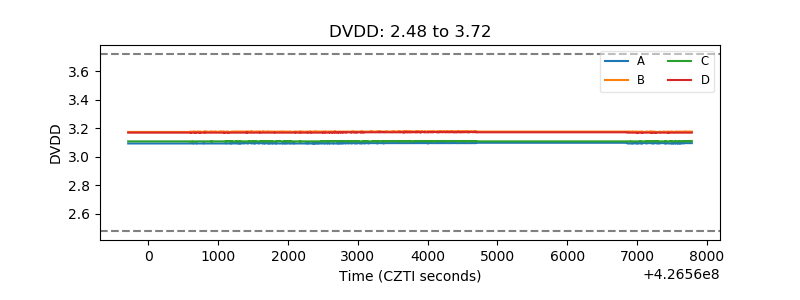 |
| Temperature 1 | 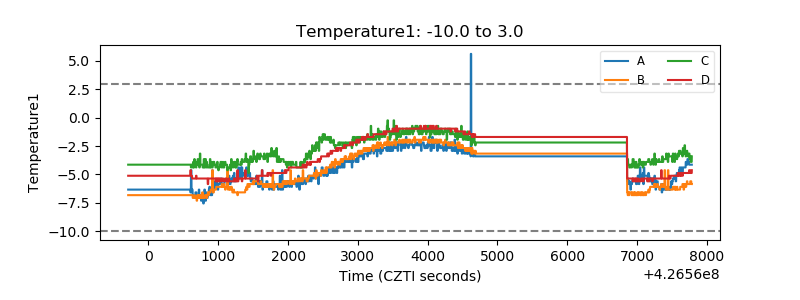 |
| Veto HV Monitor | 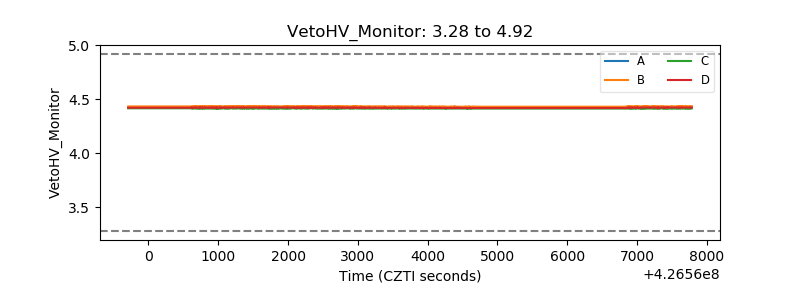 |
| Veto LLD | 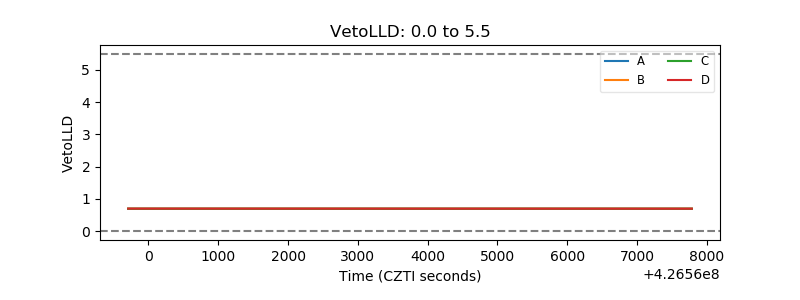 |
| Alpha Counter | 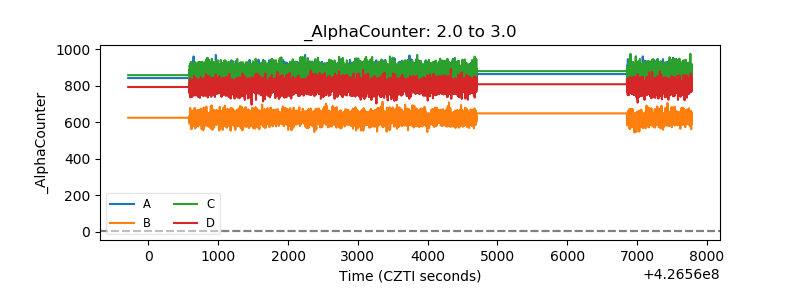 |
| _CPM_Rate |  |
| CZT Counter | 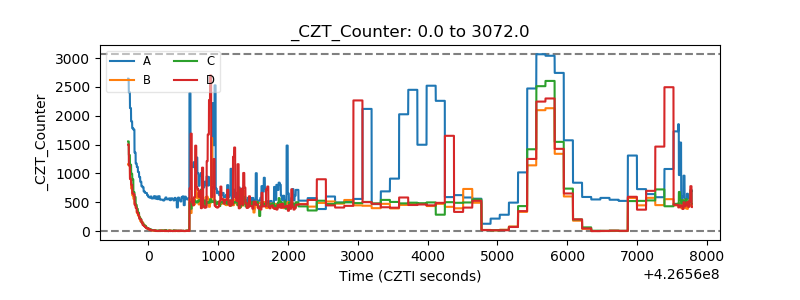 |
| +2.5 Volts monitor |  |
| +5 Volts monitor | 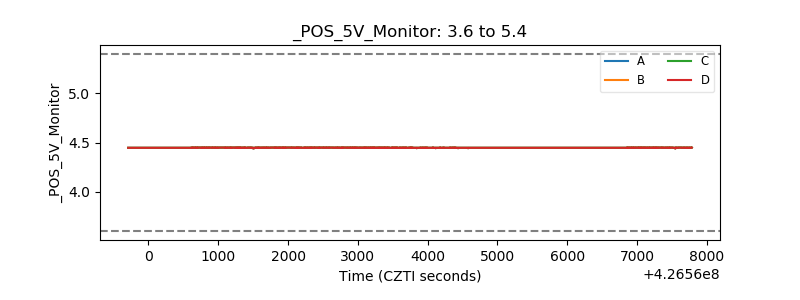 |
| _ROLL_ROT | 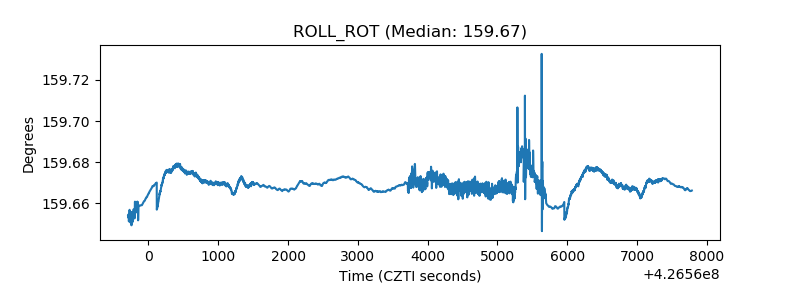 |
| _Roll_DEC | 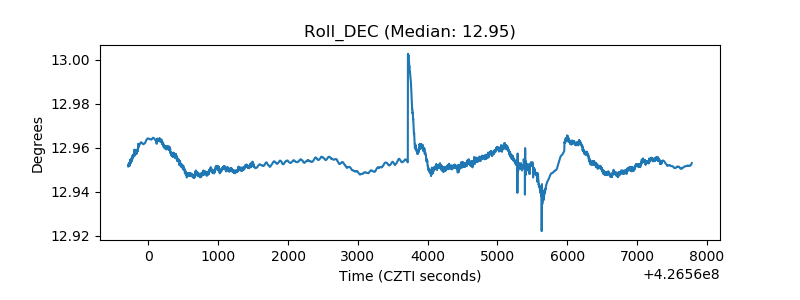 |
| _Roll_RA | 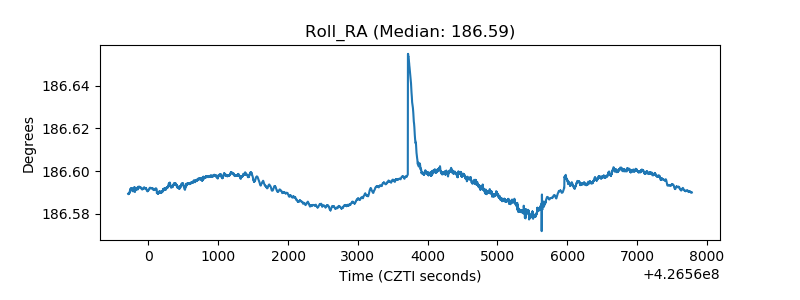 |
| Veto Counter | 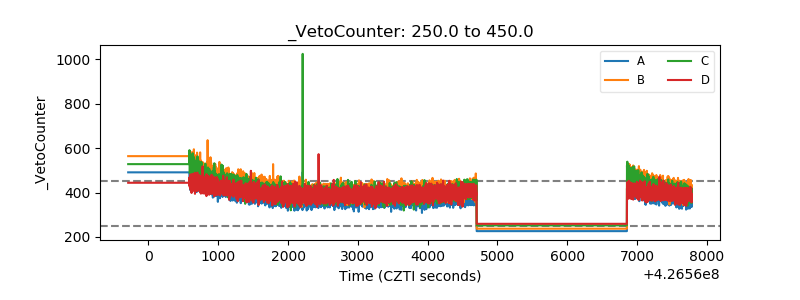 |