| Param | Original file | Final file |
|---|---|---|
| Filename | modeM0/AS1A12_037T03_9000005738_42056cztM0_level2.fits | modeM0/AS1A12_037T03_9000005738_42056cztM0_level2_quad_clean.evt |
| Size (bytes) | 329,028,480 | 85,066,560 |
| Size | 313.8 MB | 81.1 MB |
| Events in quadrant A | 3,681,488 | 574,831 |
| Events in quadrant B | 2,371,280 | 601,600 |
| Events in quadrant C | 2,401,906 | 561,889 |
| Events in quadrant D | 3,331,759 | 483,867 |
| Mode SS | |||
|---|---|---|---|
| Quadrant | BADHDUFLAG | Total packets | Discarded packets |
| A | 0 | 102 | 0 |
| B | 0 | 102 | 0 |
| C | 0 | 102 | 0 |
| D | 0 | 102 | 0 |
| Mode M9 | |||
|---|---|---|---|
| Quadrant | BADHDUFLAG | Total packets | Discarded packets |
| A | 0 | 33 | 0 |
| B | 0 | 34 | 0 |
| C | 0 | 34 | 0 |
| D | 0 | 34 | 0 |
| Mode M0 | |||
|---|---|---|---|
| Quadrant | BADHDUFLAG | Total packets | Discarded packets |
| A | 0 | 14537 | 2 |
| B | 0 | 10334 | 2 |
| C | 0 | 10144 | 2 |
| D | 0 | 13371 | 2 |
| Quadrant | Total seconds | Saturated seconds | Saturation percentage |
|---|---|---|---|
| A | 5046 | 79 | 1.565597% |
| B | 5046 | 18 | 0.356718% |
| C | 5045 | 3 | 0.059465% |
| D | 5045 | 381 | 7.552032% |
Noise dominated data is calculated using 1-second bins in cleaned event files. If a bin has >2000 counts, and if more than 50% of those come from <1% of pixels, then it is considered to be noise-dominated and hence unusable.
| Quadrant | # 1 sec bins | Bins with >0 counts | Bins with >2000 counts | High rate bins dominated by noise | Noise dominated (total time) | Noise dominated (detector-on time) | Marked lightcurve |
|---|---|---|---|---|---|---|---|
| A | 7138 | 5047 | 43 | 43 | 0.60% | 0.85% | 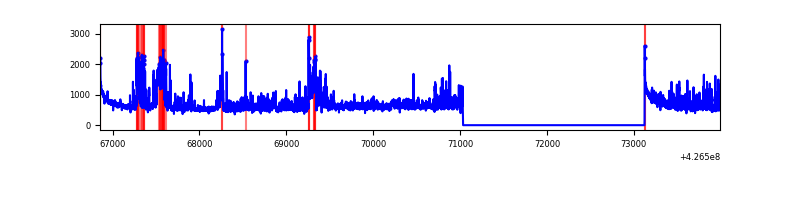 |
| B | 7138 | 5047 | 11 | 11 | 0.15% | 0.22% | 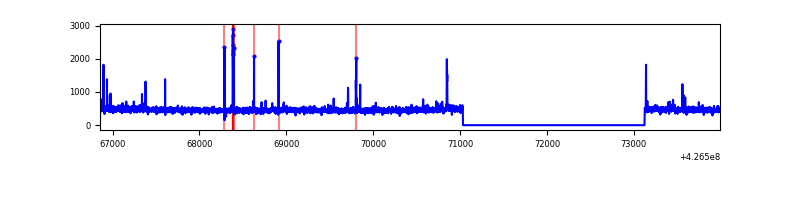 |
| C | 7137 | 5046 | 0 | 0 | 0.00% | 0.00% | 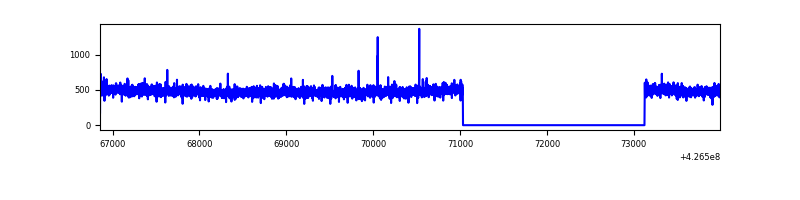 |
| D | 7137 | 5046 | 297 | 297 | 4.16% | 5.89% | 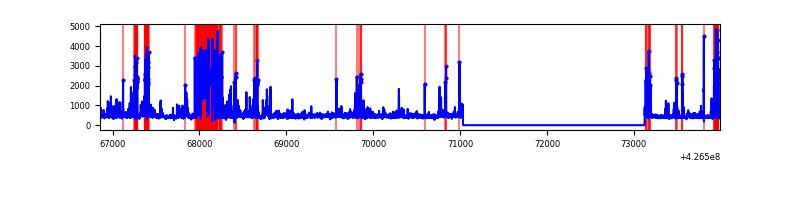 |
Top three noisy pixels from each quadrant. If the there are fewer than three noisy pixels in the level2.evt file, extra rows are filled as -1
| Pixel properties | Quadrant properties | ||||||
|---|---|---|---|---|---|---|---|
| Quadrant | DetID | PixID | Counts | Sigma | Mean | Median | Sigma |
| A | 15 | 223 | 866385 | 7275.21 | 577 | 566 | 119.0 |
| A | 10 | 83 | 551324 | 4627.85 | 577 | 566 | 119.0 |
| A | 15 | 222 | 16936 | 137.55 | 577 | 566 | 119.0 |
| B | 3 | 112 | 33425 | 294.97 | 575 | 560 | 111.4 |
| B | 5 | 255 | 32205 | 284.02 | 575 | 560 | 111.4 |
| B | 0 | 229 | 22335 | 195.43 | 575 | 560 | 111.4 |
| C | 15 | 214 | 212155 | 1607.08 | 559 | 562 | 131.7 |
| C | 12 | 249 | 7372 | 51.72 | 559 | 562 | 131.7 |
| C | 13 | 61 | 3645 | 23.42 | 559 | 562 | 131.7 |
| D | 1 | 52 | 746240 | 5695.0 | 533 | 517 | 130.9 |
| D | 13 | 249 | 232499 | 1771.62 | 533 | 517 | 130.9 |
| D | 12 | 6 | 208630 | 1589.33 | 533 | 517 | 130.9 |
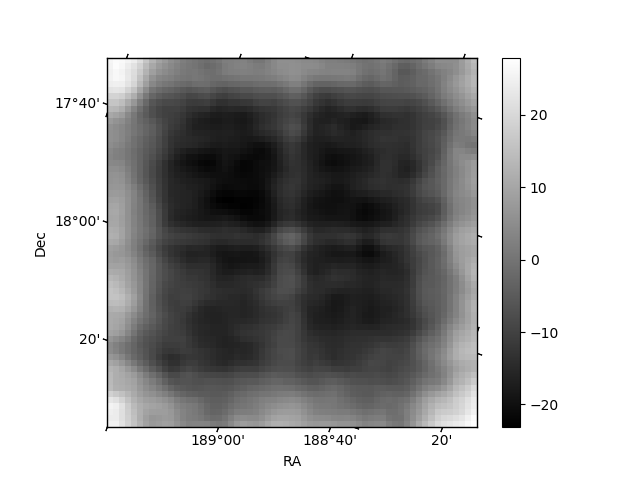
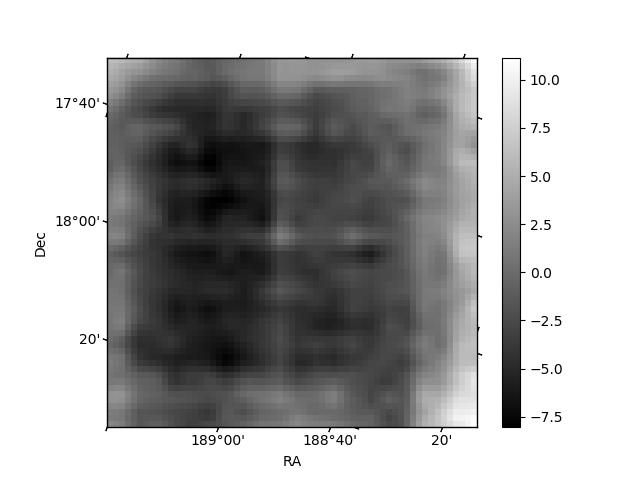
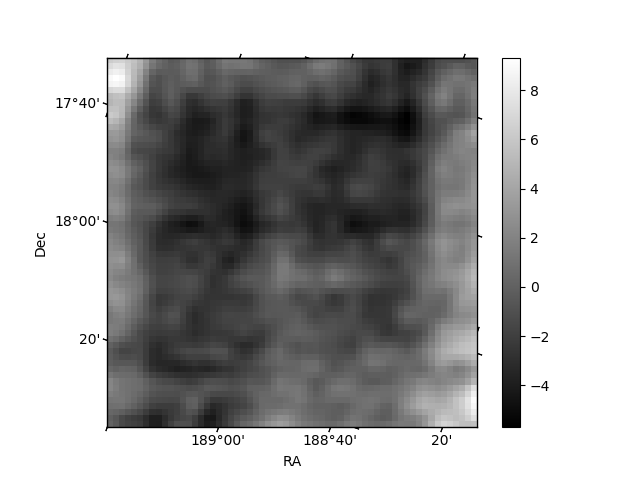
Histogram calculated using DETX and DETY for each event in the final _common_clean file
| Quadrant A | 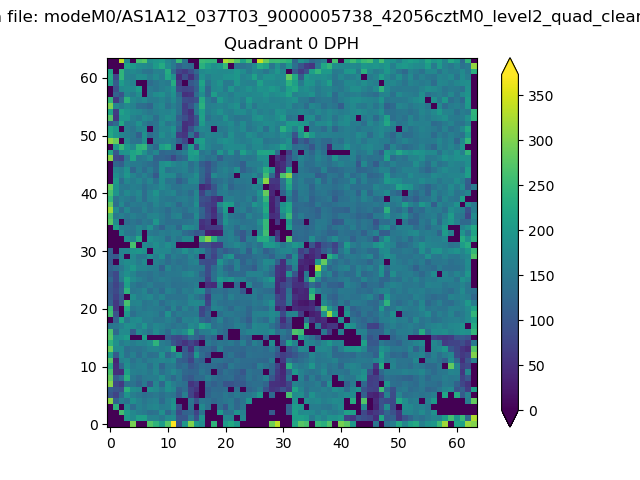 |
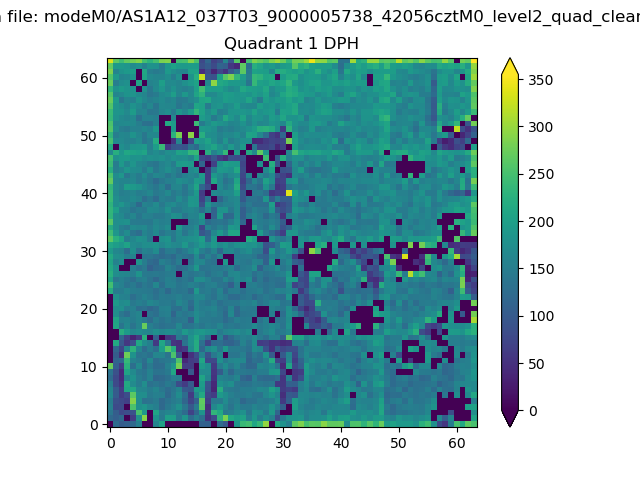 |
Quadrant B |
|---|---|---|---|
| Quadrant D | 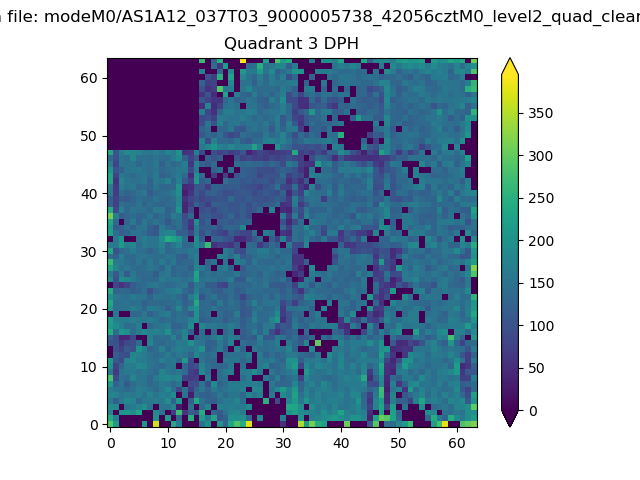 |
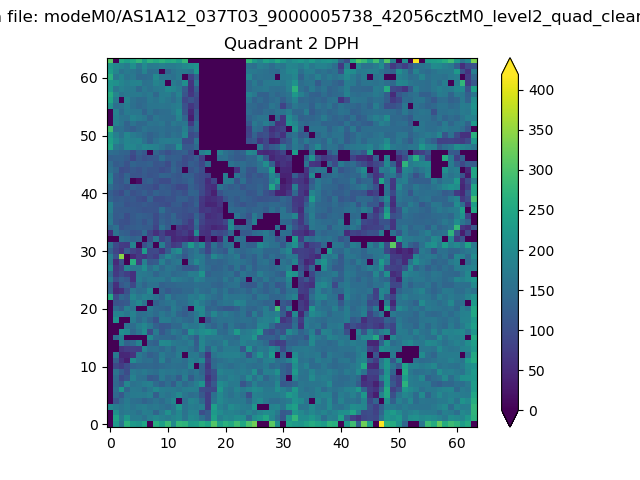 |
Quadrant C |
| Plot type | Count rate plots | Images |
|---|---|---|
| Comparison with Poisson distribution Blue bars denote a histogram of data divided into 1 sec bins. Red curve is a Poisson curve with rate = median count rate of data. |
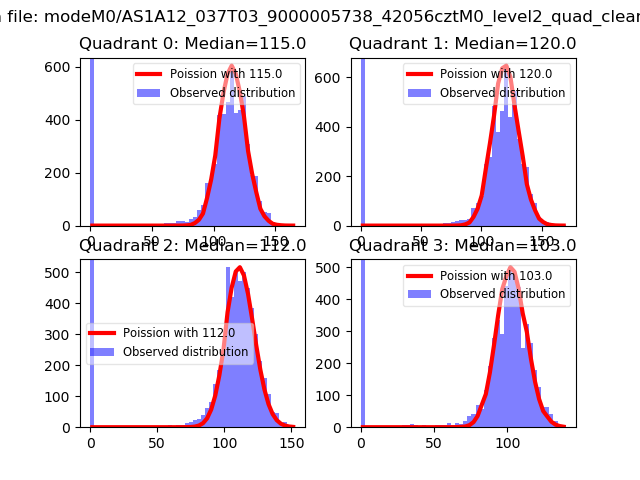 |
 |
| Quadrant-wise count rates Data is divided into 100 sec bins |
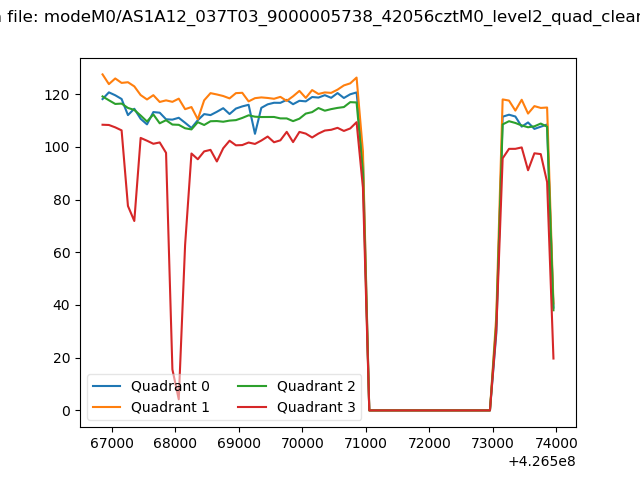 |
|
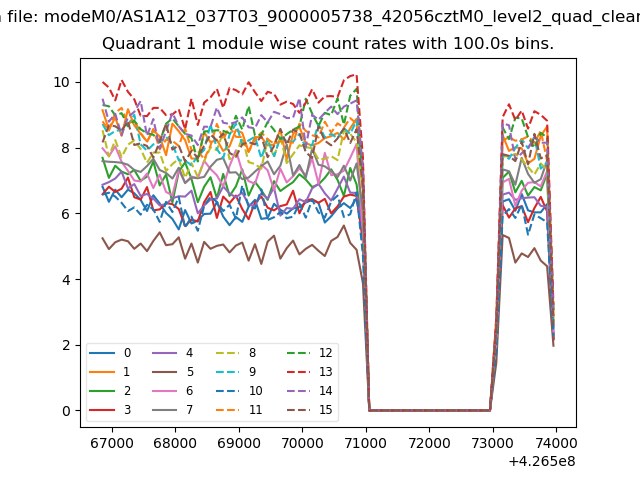
| Module-wise count rates for Quadrant A Data is divided into 100 sec bins |
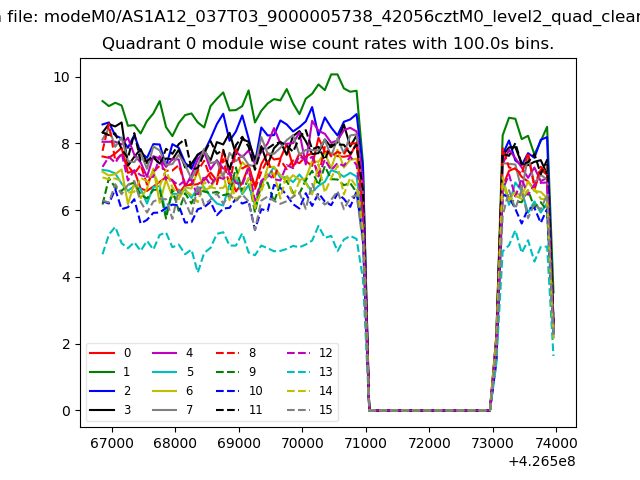 |
 |
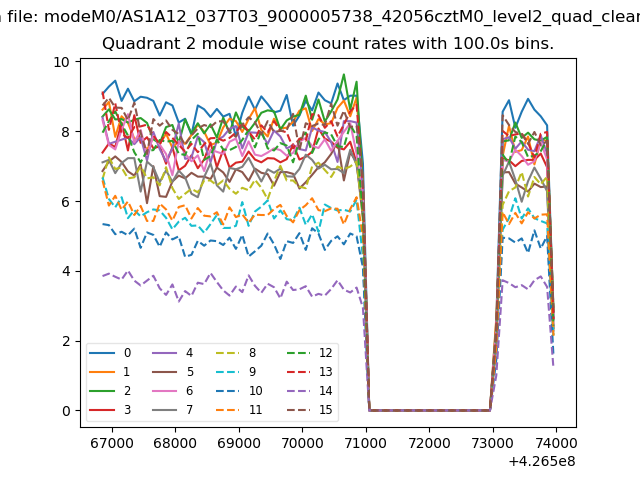
| Module-wise count rates for Quadrant B Data is divided into 100 sec bins |
 |
 |
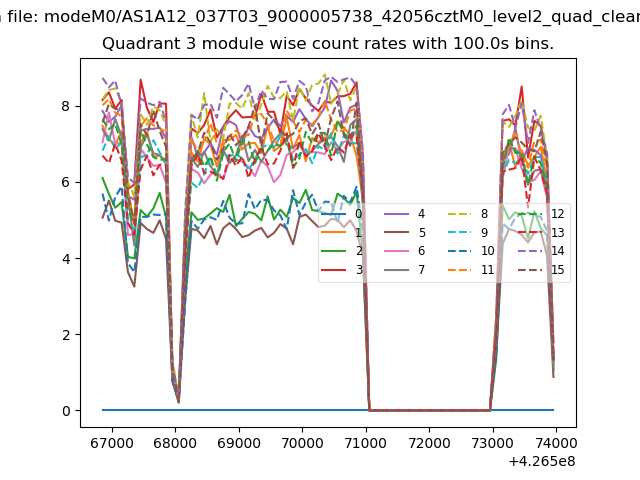
| Module-wise count rates for Quadrant C Data is divided into 100 sec bins |
 |
 |
| Module-wise count rates for Quadrant D Data is divided into 100 sec bins |
 |
 |
| Parameter | Plot |
|---|---|
| CZT HV Monitor | 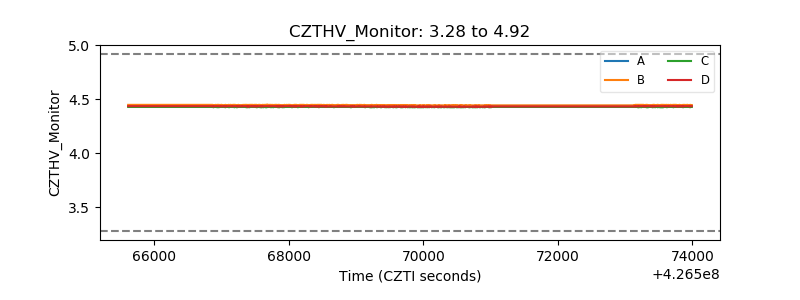 |
| D_VDD | 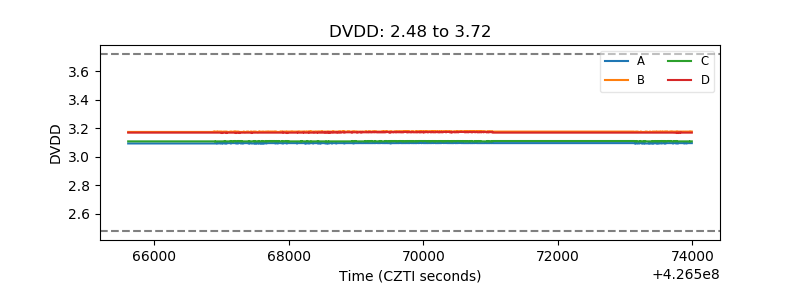 |
| Temperature 1 | 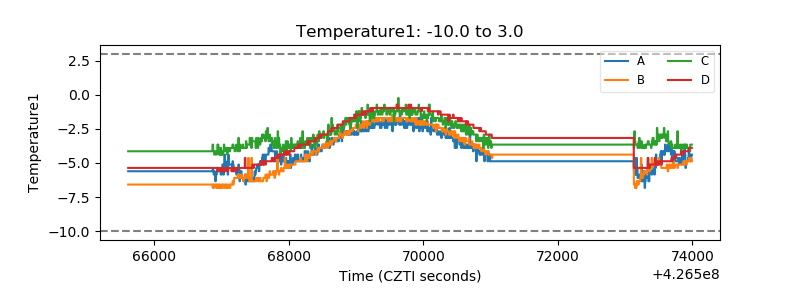 |
| Veto HV Monitor | 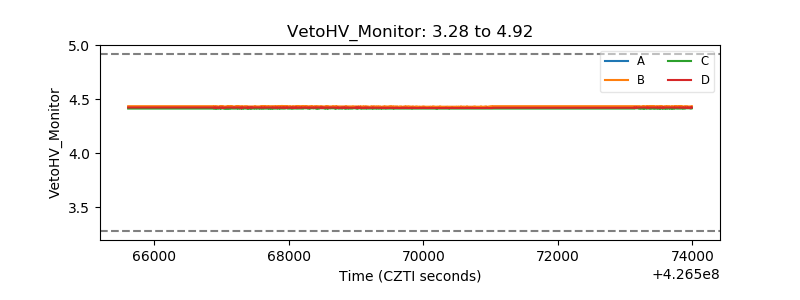 |
| Veto LLD | 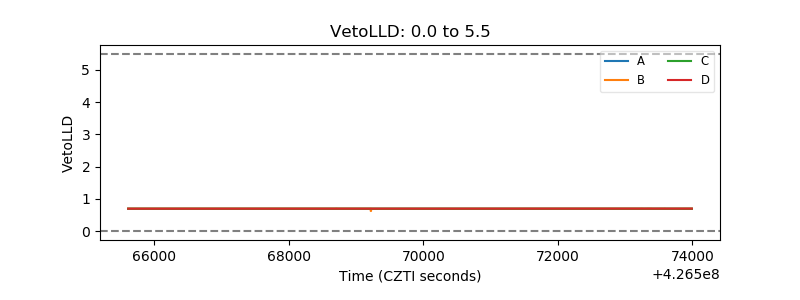 |
| Alpha Counter | 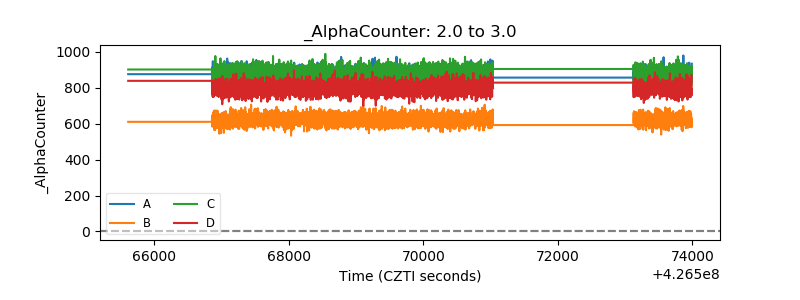 |
| _CPM_Rate | 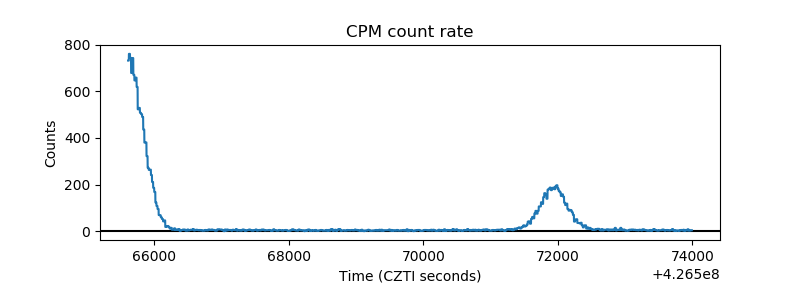 |
| CZT Counter | 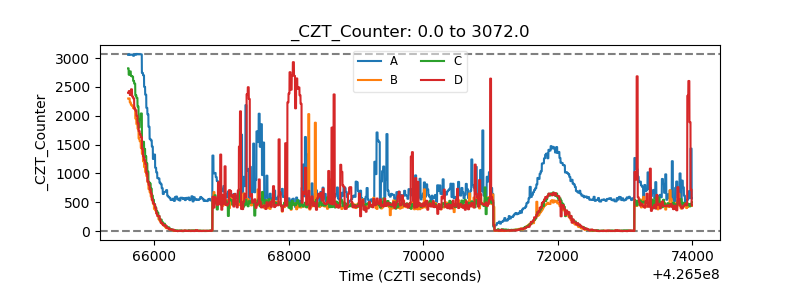 |
| +2.5 Volts monitor |  |
| +5 Volts monitor |  |
| _ROLL_ROT | 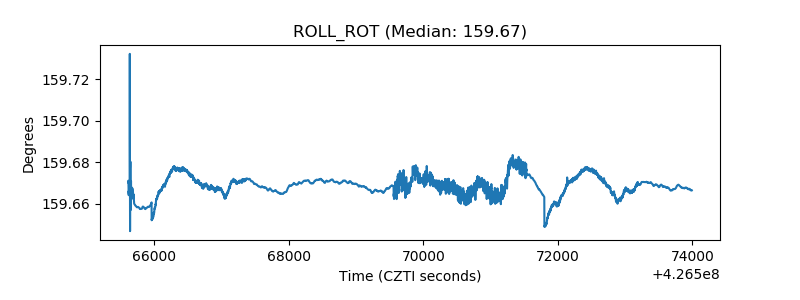 |
| _Roll_DEC | 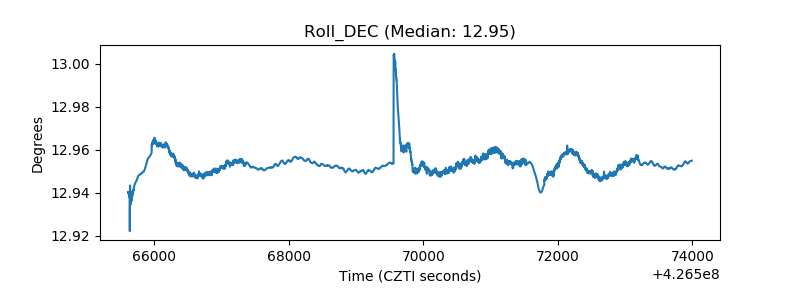 |
| _Roll_RA | 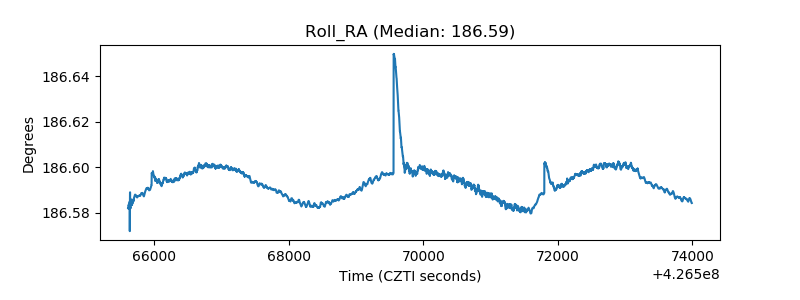 |
| Veto Counter | 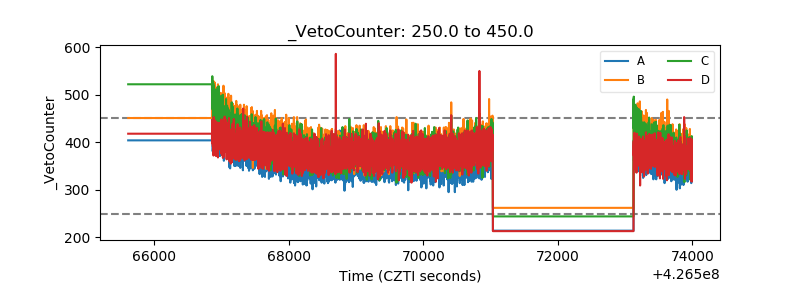 |