| Param | Original file | Final file |
|---|---|---|
| Filename | modeM0/AS1A12_037T03_9000005738_42057cztM0_level2.fits | modeM0/AS1A12_037T03_9000005738_42057cztM0_level2_quad_clean.evt |
| Size (bytes) | 333,311,040 | 84,579,840 |
| Size | 317.9 MB | 80.7 MB |
| Events in quadrant A | 3,582,209 | 566,791 |
| Events in quadrant B | 2,404,942 | 590,519 |
| Events in quadrant C | 2,406,404 | 558,907 |
| Events in quadrant D | 3,541,834 | 482,540 |
| Mode SS | |||
|---|---|---|---|
| Quadrant | BADHDUFLAG | Total packets | Discarded packets |
| A | 0 | 106 | 0 |
| B | 0 | 106 | 0 |
| C | 0 | 106 | 0 |
| D | 0 | 106 | 0 |
| Mode M9 | |||
|---|---|---|---|
| Quadrant | BADHDUFLAG | Total packets | Discarded packets |
| A | 0 | 34 | 0 |
| B | 0 | 35 | 0 |
| C | 0 | 35 | 0 |
| D | 0 | 35 | 0 |
| Mode M0 | |||
|---|---|---|---|
| Quadrant | BADHDUFLAG | Total packets | Discarded packets |
| A | 0 | 14010 | 2 |
| B | 0 | 10640 | 3 |
| C | 0 | 10370 | 2 |
| D | 0 | 14097 | 2 |
| Quadrant | Total seconds | Saturated seconds | Saturation percentage |
|---|---|---|---|
| A | 5168 | 82 | 1.586687% |
| B | 5167 | 21 | 0.406425% |
| C | 5167 | 4 | 0.077414% |
| D | 5167 | 356 | 6.889878% |
Noise dominated data is calculated using 1-second bins in cleaned event files. If a bin has >2000 counts, and if more than 50% of those come from <1% of pixels, then it is considered to be noise-dominated and hence unusable.
| Quadrant | # 1 sec bins | Bins with >0 counts | Bins with >2000 counts | High rate bins dominated by noise | Noise dominated (total time) | Noise dominated (detector-on time) | Marked lightcurve |
|---|---|---|---|---|---|---|---|
| A | 7050 | 5169 | 43 | 43 | 0.61% | 0.83% | 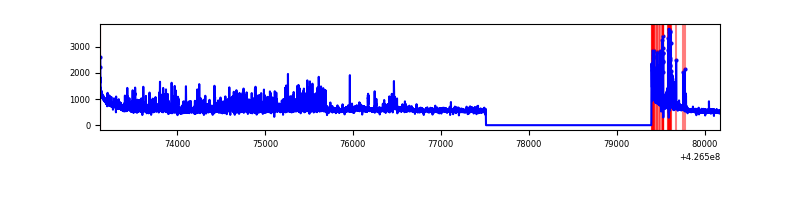 |
| B | 7049 | 5168 | 14 | 14 | 0.20% | 0.27% | 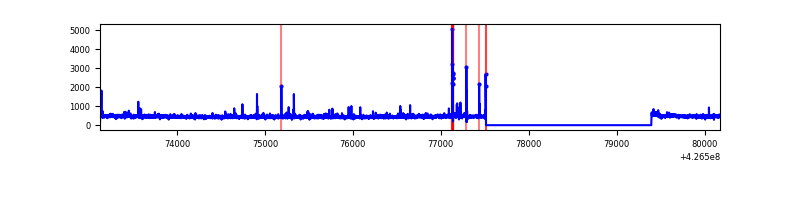 |
| C | 7049 | 5168 | 1 | 1 | 0.01% | 0.02% | 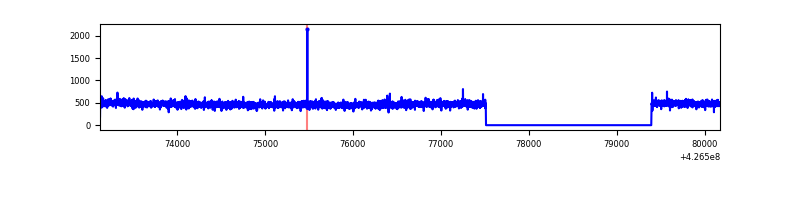 |
| D | 7049 | 5168 | 316 | 316 | 4.48% | 6.11% | 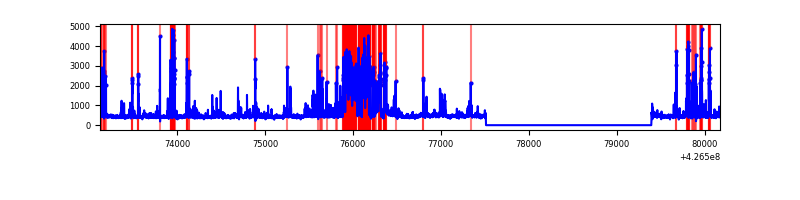 |
Top three noisy pixels from each quadrant. If the there are fewer than three noisy pixels in the level2.evt file, extra rows are filled as -1
| Pixel properties | Quadrant properties | ||||||
|---|---|---|---|---|---|---|---|
| Quadrant | DetID | PixID | Counts | Sigma | Mean | Median | Sigma |
| A | 15 | 223 | 704142 | 5932.56 | 575 | 563 | 118.6 |
| A | 10 | 83 | 563191 | 4744.07 | 575 | 563 | 118.6 |
| A | 12 | 189 | 73631 | 616.11 | 575 | 563 | 118.6 |
| B | 5 | 255 | 51837 | 455.86 | 573 | 557 | 112.5 |
| B | 0 | 190 | 44718 | 392.58 | 573 | 557 | 112.5 |
| B | 3 | 112 | 20963 | 181.4 | 573 | 557 | 112.5 |
| C | 15 | 214 | 217450 | 1650.77 | 559 | 562 | 131.4 |
| C | 12 | 249 | 5756 | 39.53 | 559 | 562 | 131.4 |
| C | 13 | 61 | 3779 | 24.49 | 559 | 562 | 131.4 |
| D | 1 | 52 | 688835 | 5076.24 | 547 | 531 | 135.6 |
| D | 12 | 6 | 269915 | 1986.71 | 547 | 531 | 135.6 |
| D | 12 | 233 | 238584 | 1755.64 | 547 | 531 | 135.6 |
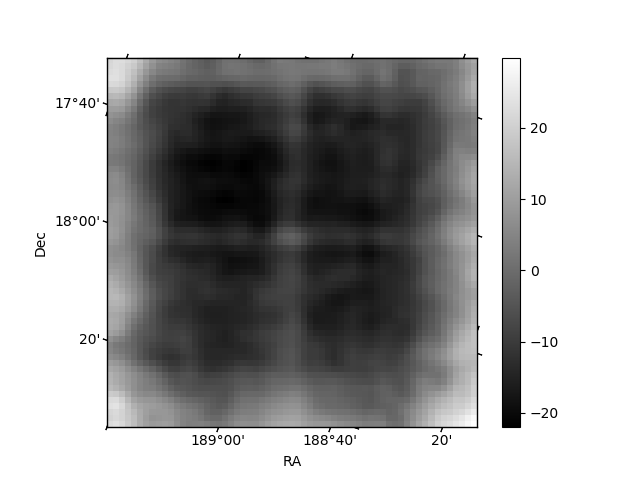
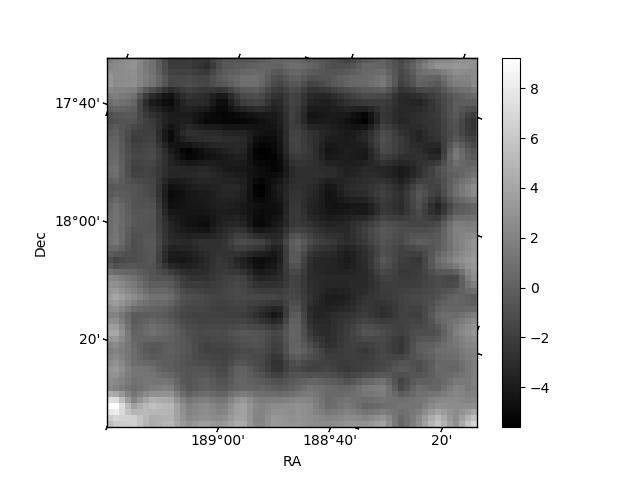
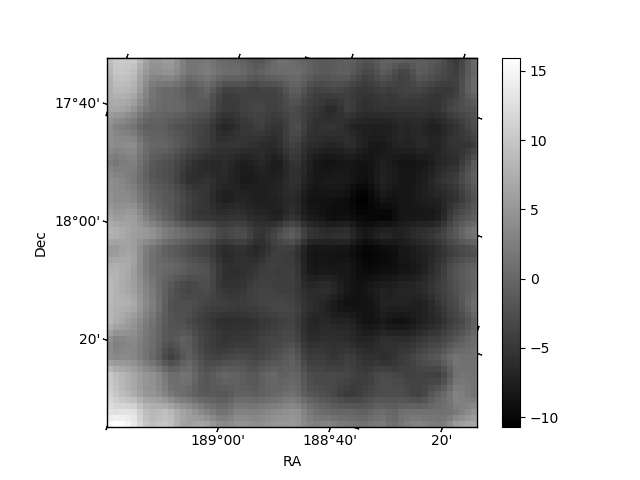
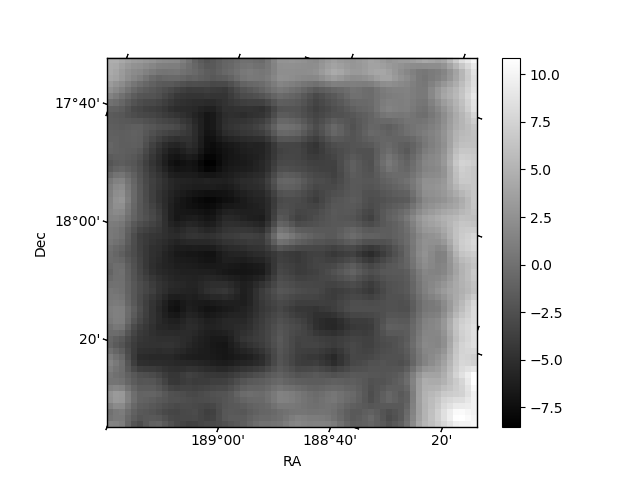
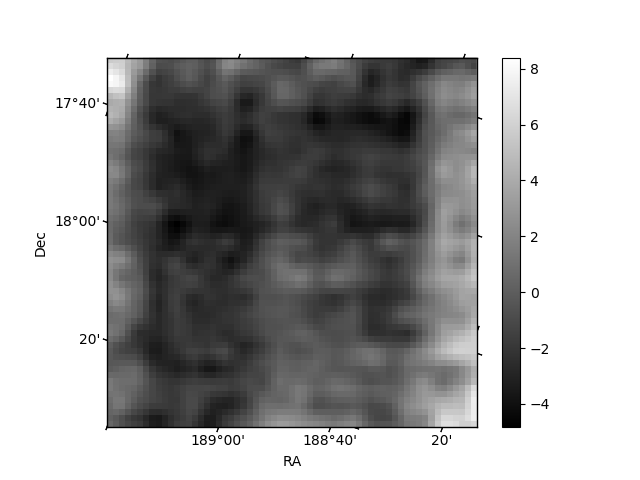
Histogram calculated using DETX and DETY for each event in the final _common_clean file
| Quadrant A | 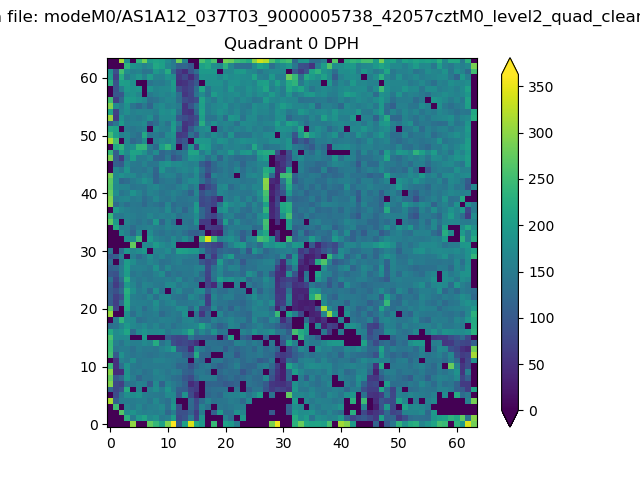 |
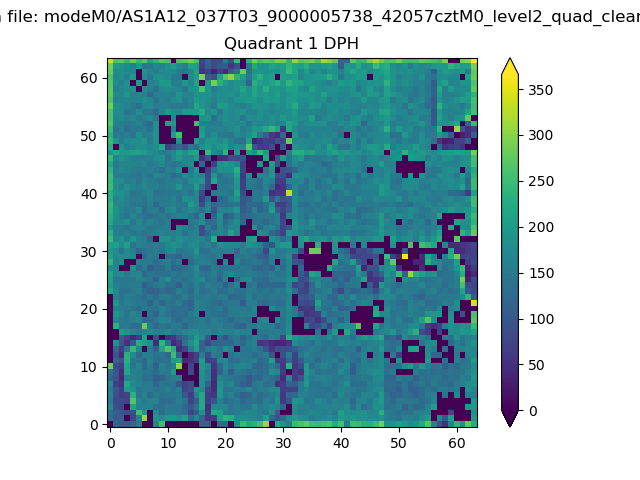 |
Quadrant B |
|---|---|---|---|
| Quadrant D | 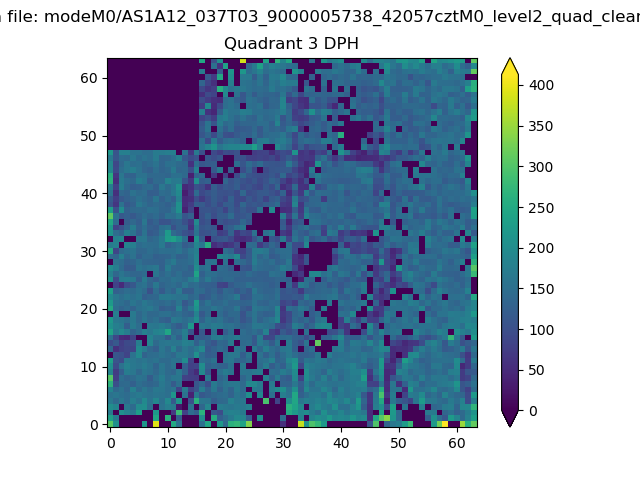 |
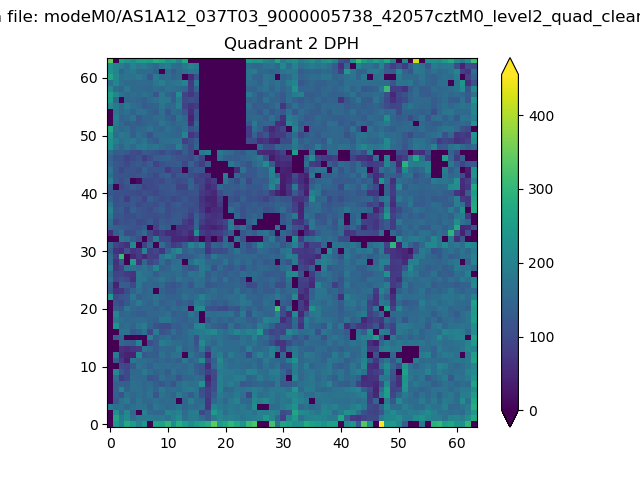 |
Quadrant C |
| Plot type | Count rate plots | Images |
|---|---|---|
| Comparison with Poisson distribution Blue bars denote a histogram of data divided into 1 sec bins. Red curve is a Poisson curve with rate = median count rate of data. |
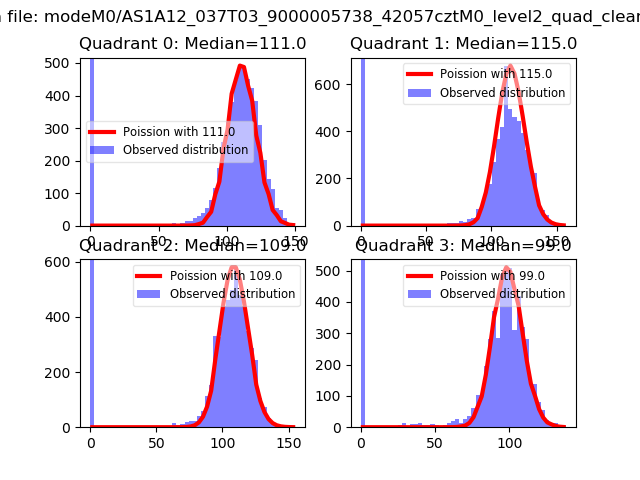 |
 |
| Quadrant-wise count rates Data is divided into 100 sec bins |
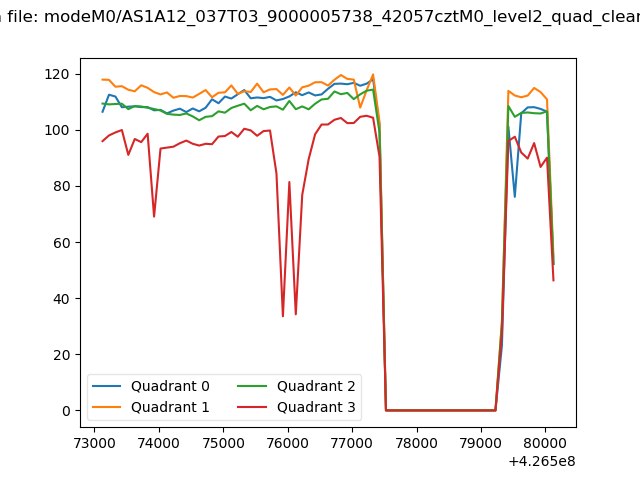 |
|
| Module-wise count rates for Quadrant A Data is divided into 100 sec bins |
 |
 |
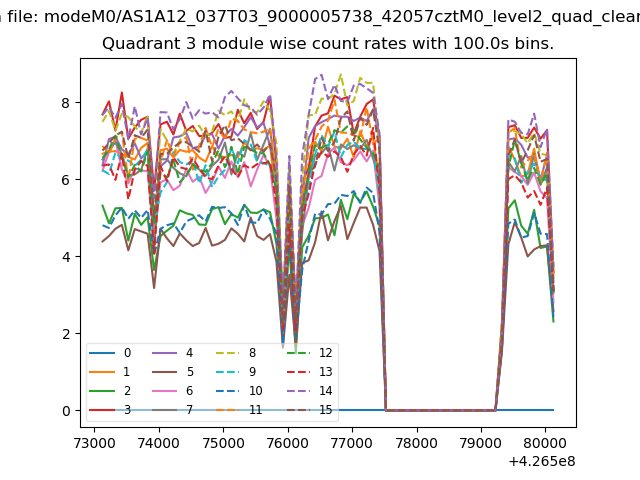
| Module-wise count rates for Quadrant B Data is divided into 100 sec bins |
 |
 |
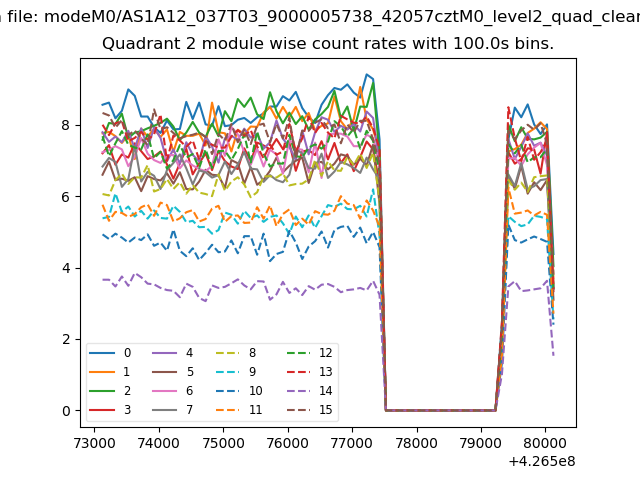
| Module-wise count rates for Quadrant C Data is divided into 100 sec bins |
 |
 |
| Module-wise count rates for Quadrant D Data is divided into 100 sec bins |
 |
 |
| Parameter | Plot |
|---|---|
| CZT HV Monitor | 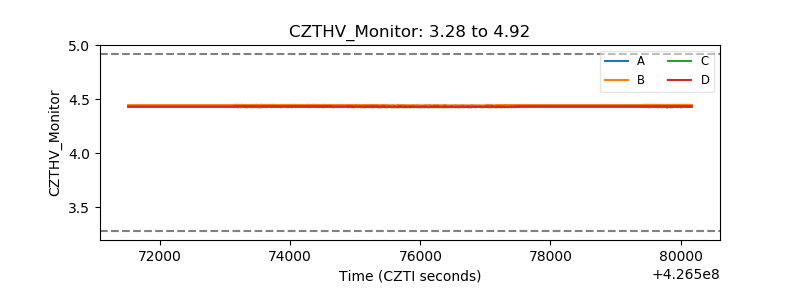 |
| D_VDD | 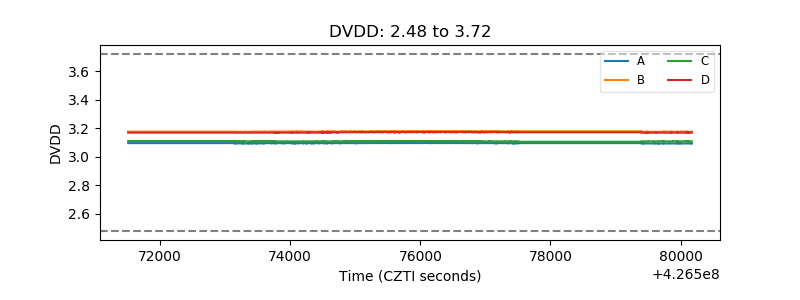 |
| Temperature 1 | 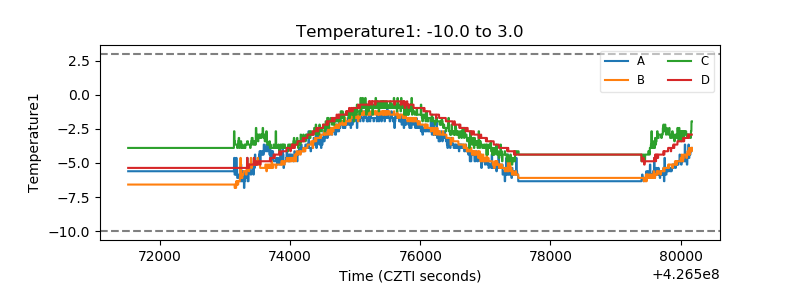 |
| Veto HV Monitor | 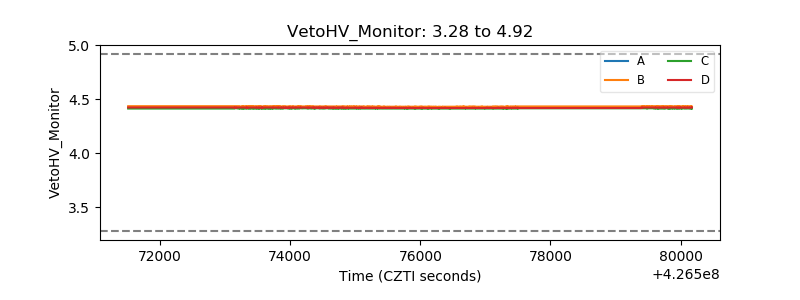 |
| Veto LLD | 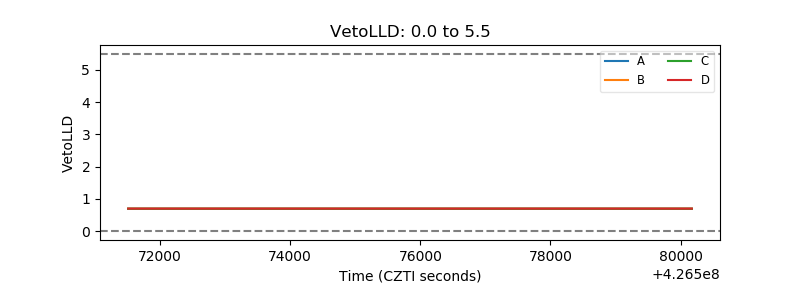 |
| Alpha Counter |  |
| _CPM_Rate |  |
| CZT Counter | 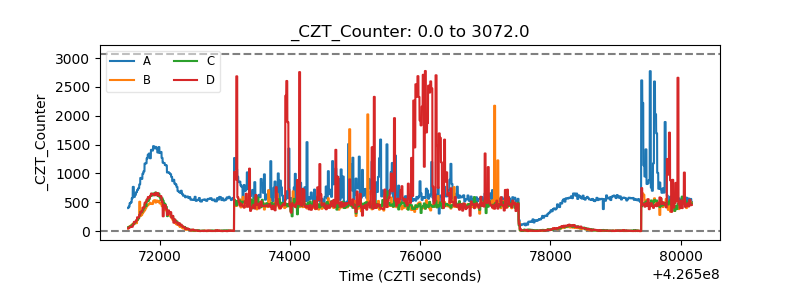 |
| +2.5 Volts monitor | 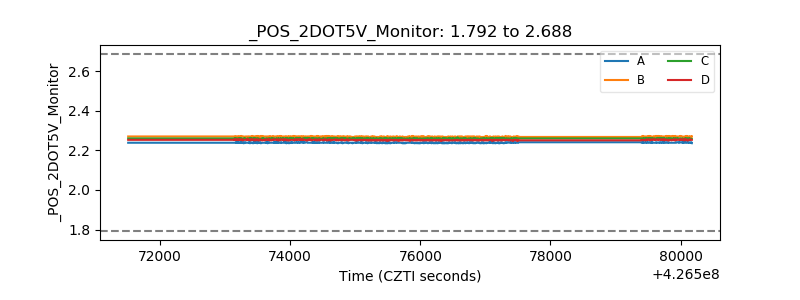 |
| +5 Volts monitor |  |
| _ROLL_ROT | 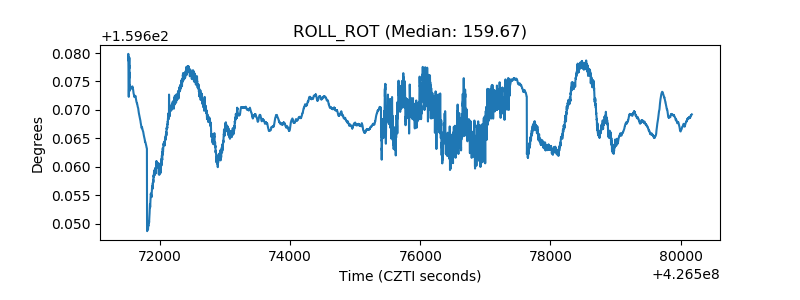 |
| _Roll_DEC | 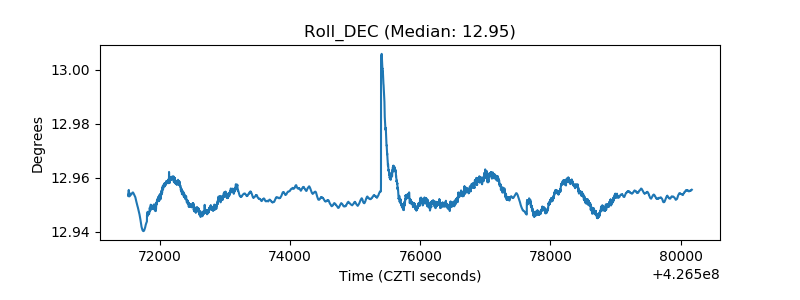 |
| _Roll_RA | 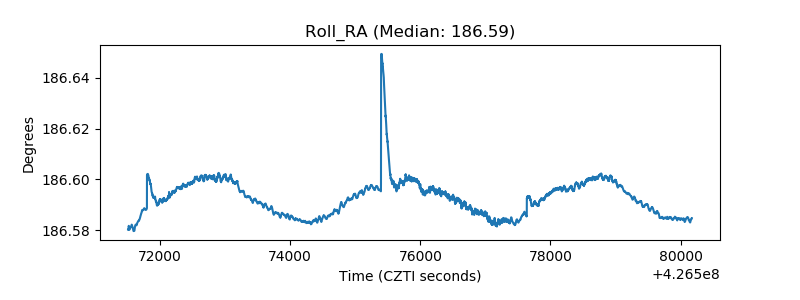 |
| Veto Counter | 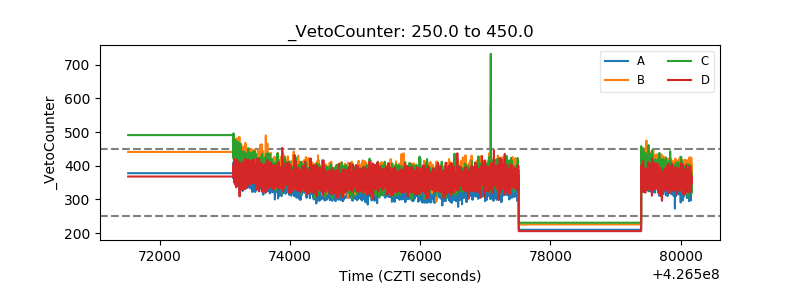 |