| Param | Original file | Final file |
|---|---|---|
| Filename | modeM0/AS1A12_037T03_9000005738_42058cztM0_level2.fits | modeM0/AS1A12_037T03_9000005738_42058cztM0_level2_quad_clean.evt |
| Size (bytes) | 316,972,800 | 91,964,160 |
| Size | 302.3 MB | 87.7 MB |
| Events in quadrant A | 3,293,544 | 611,660 |
| Events in quadrant B | 2,540,215 | 633,065 |
| Events in quadrant C | 2,603,941 | 599,180 |
| Events in quadrant D | 2,857,724 | 547,534 |
| Mode SS | |||
|---|---|---|---|
| Quadrant | BADHDUFLAG | Total packets | Discarded packets |
| A | 0 | 118 | 0 |
| B | 0 | 118 | 0 |
| C | 0 | 118 | 0 |
| D | 0 | 118 | 0 |
| Mode M9 | |||
|---|---|---|---|
| Quadrant | BADHDUFLAG | Total packets | Discarded packets |
| A | 0 | 32 | 0 |
| B | 0 | 33 | 0 |
| C | 0 | 33 | 0 |
| D | 0 | 33 | 0 |
| Mode M0 | |||
|---|---|---|---|
| Quadrant | BADHDUFLAG | Total packets | Discarded packets |
| A | 0 | 12946 | 2 |
| B | 0 | 11455 | 2 |
| C | 0 | 11280 | 2 |
| D | 0 | 12489 | 2 |
| Quadrant | Total seconds | Saturated seconds | Saturation percentage |
|---|---|---|---|
| A | 5618 | 78 | 1.388394% |
| B | 5618 | 14 | 0.249199% |
| C | 5618 | 3 | 0.053400% |
| D | 5618 | 78 | 1.388394% |
Noise dominated data is calculated using 1-second bins in cleaned event files. If a bin has >2000 counts, and if more than 50% of those come from <1% of pixels, then it is considered to be noise-dominated and hence unusable.
| Quadrant | # 1 sec bins | Bins with >0 counts | Bins with >2000 counts | High rate bins dominated by noise | Noise dominated (total time) | Noise dominated (detector-on time) | Marked lightcurve |
|---|---|---|---|---|---|---|---|
| A | 7141 | 5619 | 45 | 45 | 0.63% | 0.80% | 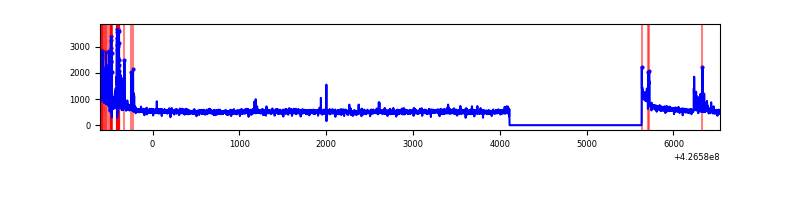 |
| B | 7141 | 5619 | 7 | 7 | 0.10% | 0.12% | 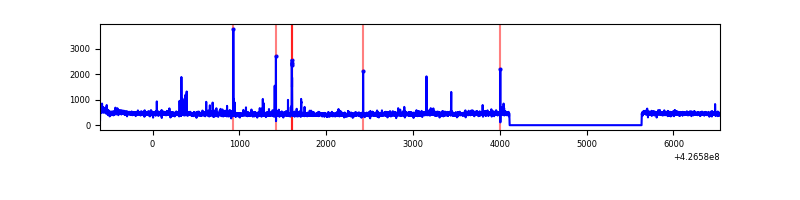 |
| C | 7141 | 5619 | 1 | 1 | 0.01% | 0.02% | 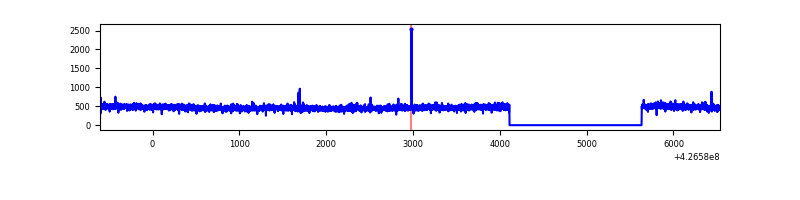 |
| D | 7141 | 5619 | 59 | 59 | 0.83% | 1.05% | 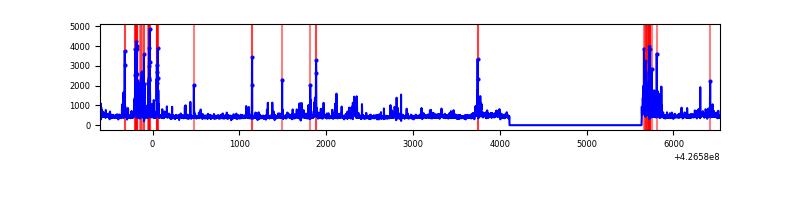 |
Top three noisy pixels from each quadrant. If the there are fewer than three noisy pixels in the level2.evt file, extra rows are filled as -1
| Pixel properties | Quadrant properties | ||||||
|---|---|---|---|---|---|---|---|
| Quadrant | DetID | PixID | Counts | Sigma | Mean | Median | Sigma |
| A | 10 | 83 | 570417 | 4425.99 | 618 | 606 | 128.7 |
| A | 15 | 223 | 309548 | 2399.7 | 618 | 606 | 128.7 |
| A | 12 | 189 | 12327 | 91.04 | 618 | 606 | 128.7 |
| B | 0 | 190 | 37976 | 309.86 | 617 | 600 | 120.6 |
| B | 5 | 255 | 36026 | 293.69 | 617 | 600 | 120.6 |
| B | 5 | 32 | 27222 | 220.7 | 617 | 600 | 120.6 |
| C | 15 | 214 | 237179 | 1658.31 | 604 | 606 | 142.7 |
| C | 12 | 249 | 7884 | 51.02 | 604 | 606 | 142.7 |
| C | 13 | 61 | 3968 | 23.57 | 604 | 606 | 142.7 |
| D | 12 | 6 | 222339 | 1498.16 | 600 | 583 | 148.0 |
| D | 1 | 52 | 139268 | 936.94 | 600 | 583 | 148.0 |
| D | 2 | 249 | 60091 | 402.03 | 600 | 583 | 148.0 |
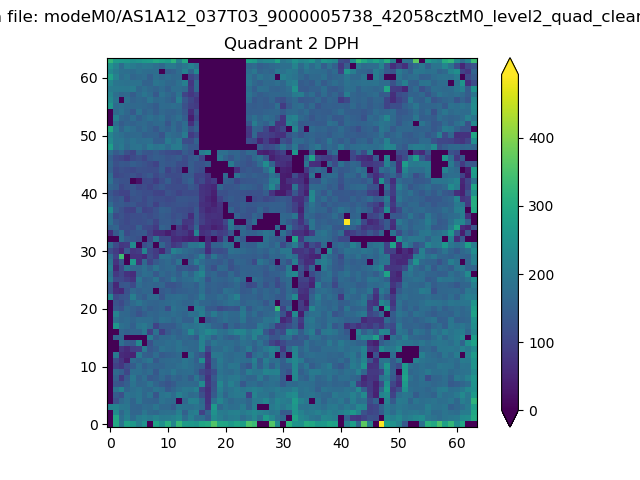
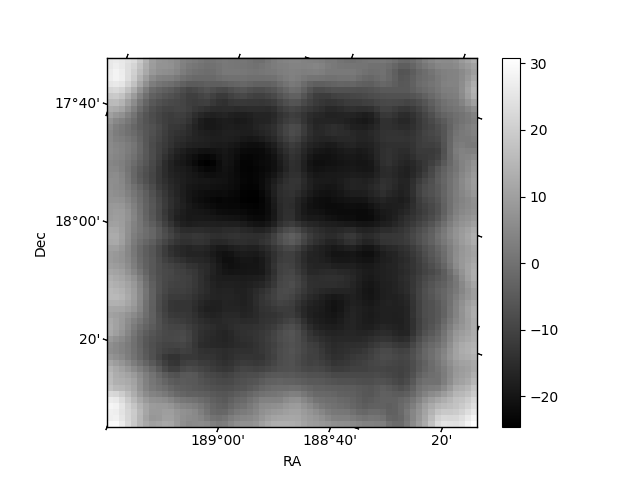
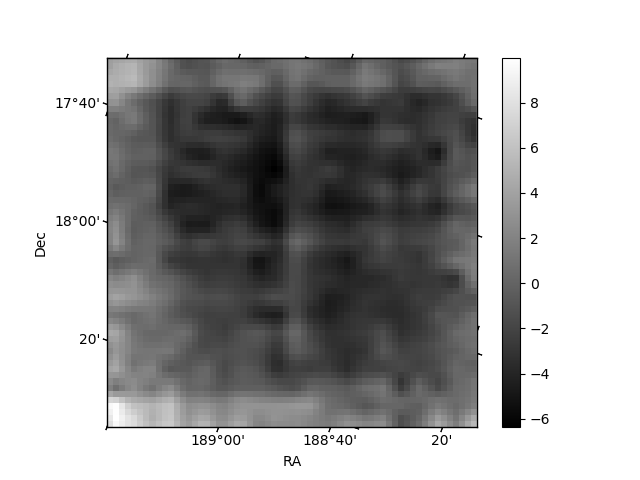
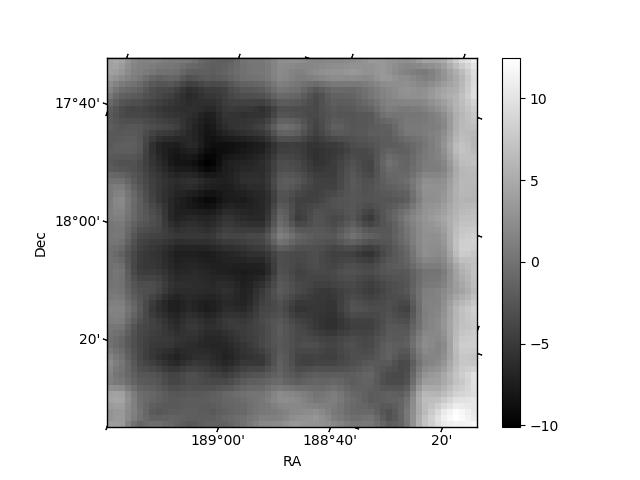
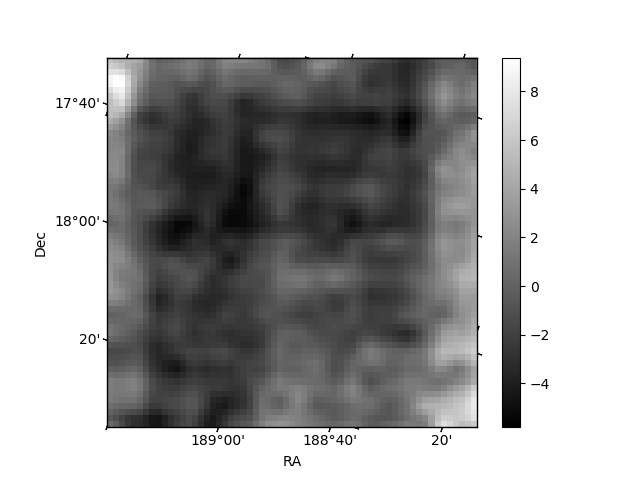
Histogram calculated using DETX and DETY for each event in the final _common_clean file
| Quadrant A | 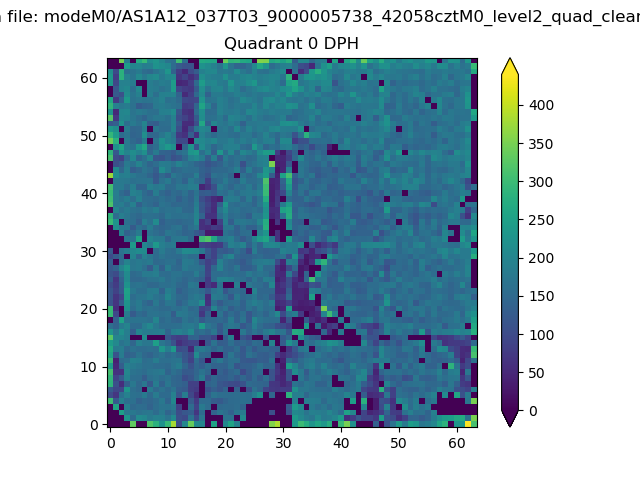 |
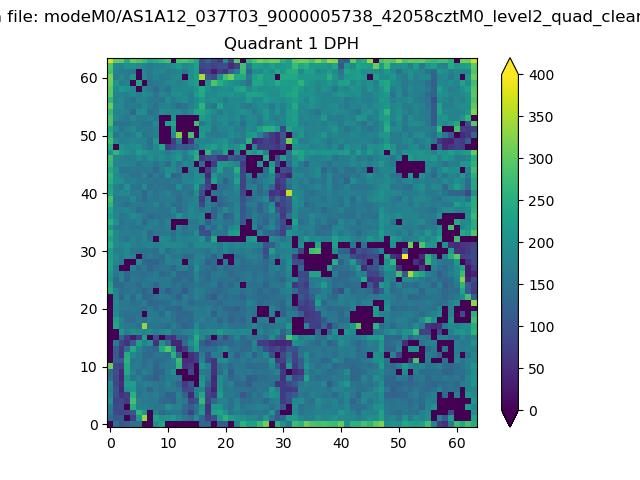 |
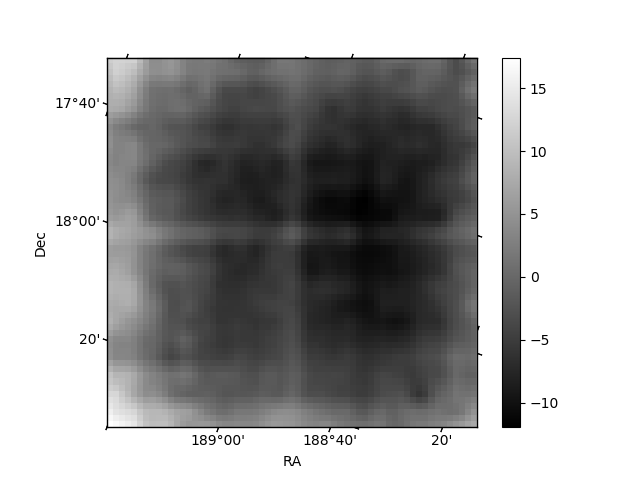
Quadrant B |
|---|---|---|---|
| Quadrant D | 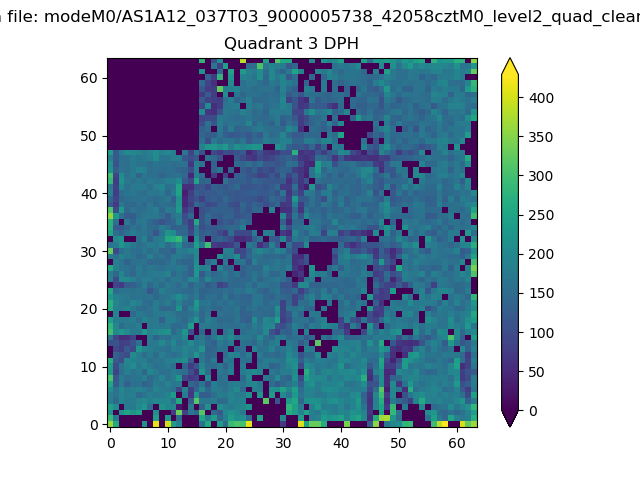 |
 |
Quadrant C |
| Plot type | Count rate plots | Images |
|---|---|---|
| Comparison with Poisson distribution Blue bars denote a histogram of data divided into 1 sec bins. Red curve is a Poisson curve with rate = median count rate of data. |
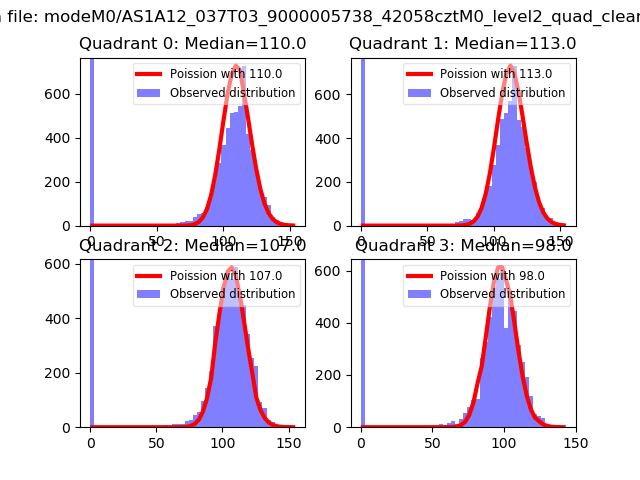 |
 |
| Quadrant-wise count rates Data is divided into 100 sec bins |
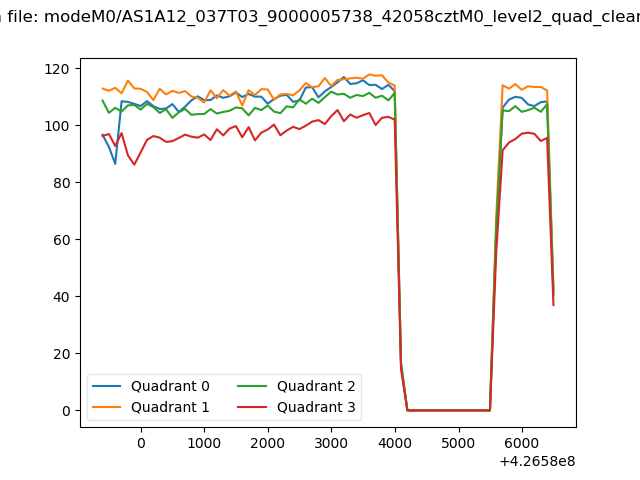 |
|
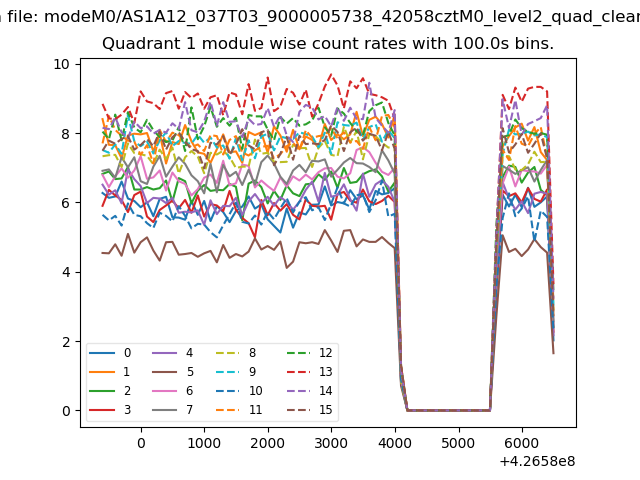
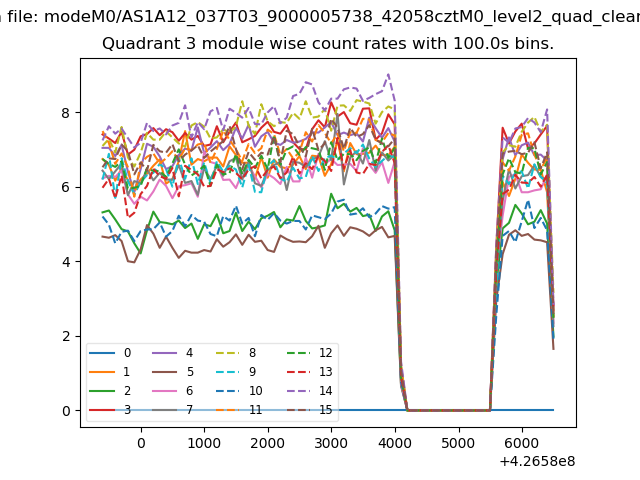
| Module-wise count rates for Quadrant A Data is divided into 100 sec bins |
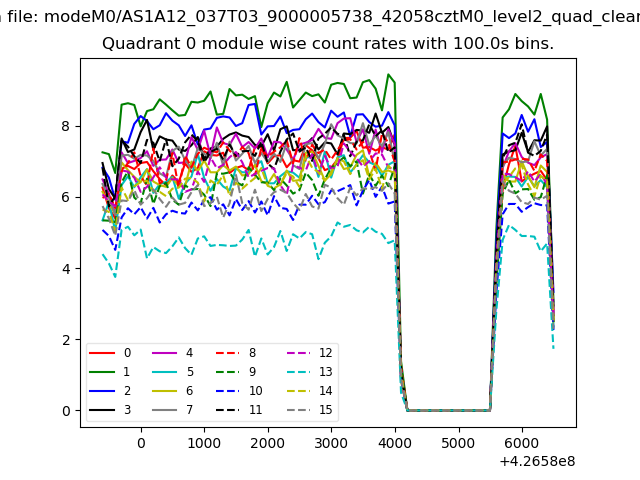 |
 |
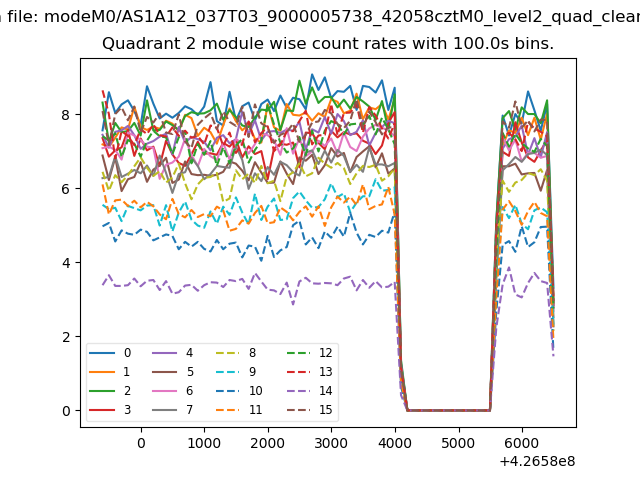
| Module-wise count rates for Quadrant B Data is divided into 100 sec bins |
 |
 |
| Module-wise count rates for Quadrant C Data is divided into 100 sec bins |
 |
 |
| Module-wise count rates for Quadrant D Data is divided into 100 sec bins |
 |
 |
| Parameter | Plot |
|---|---|
| CZT HV Monitor |  |
| D_VDD | 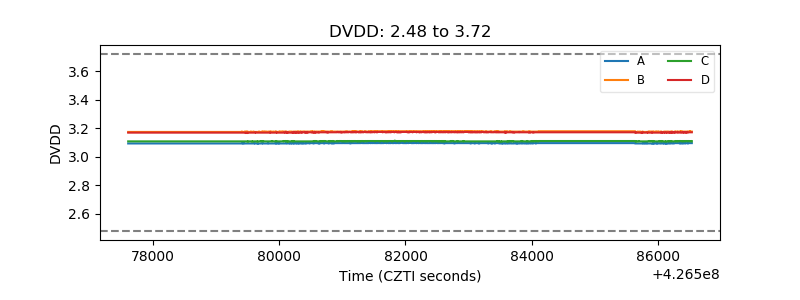 |
| Temperature 1 | 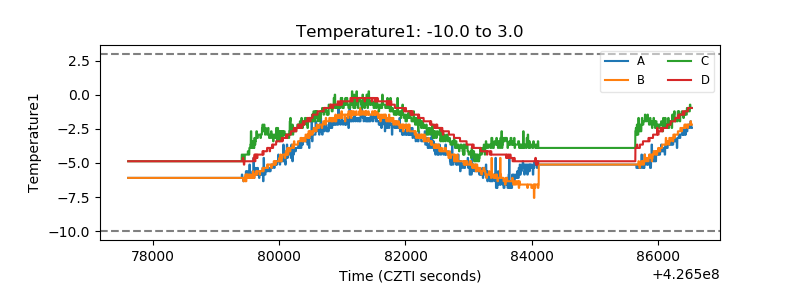 |
| Veto HV Monitor | 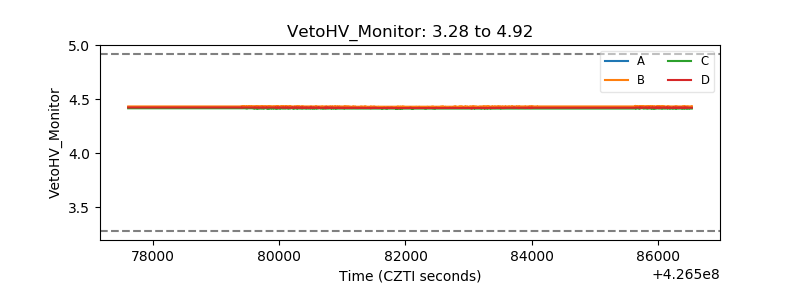 |
| Veto LLD | 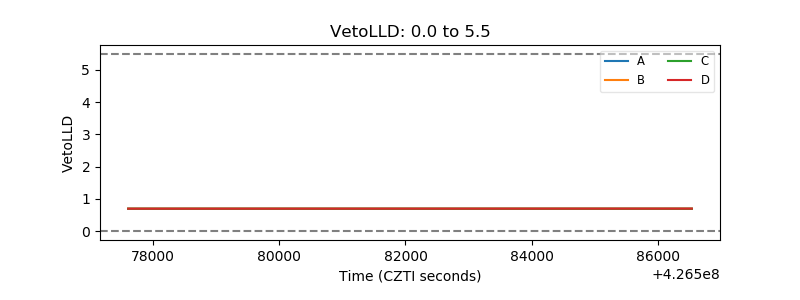 |
| Alpha Counter | 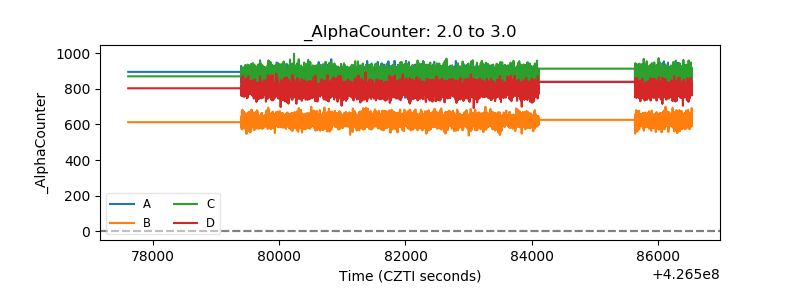 |
| _CPM_Rate |  |
| CZT Counter | 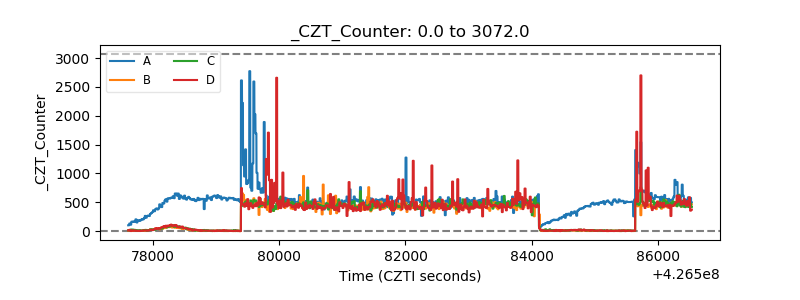 |
| +2.5 Volts monitor |  |
| +5 Volts monitor | 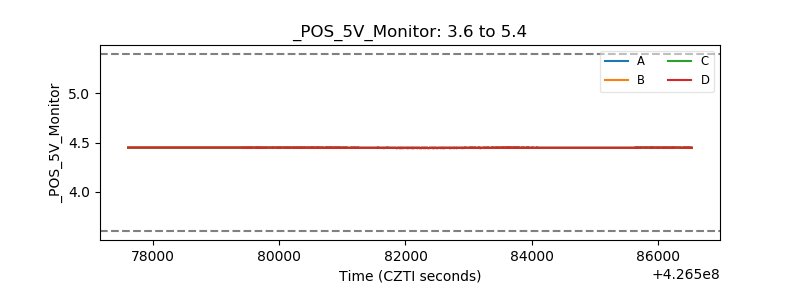 |
| _ROLL_ROT | 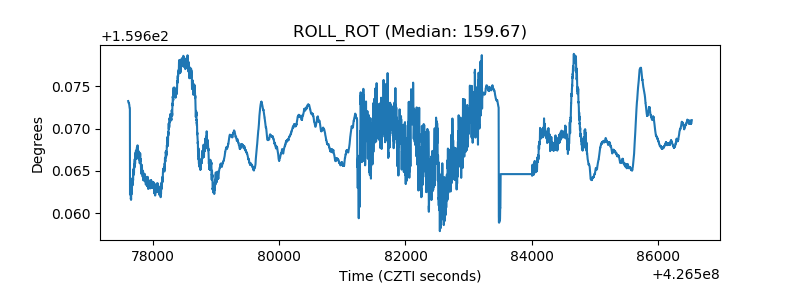 |
| _Roll_DEC | 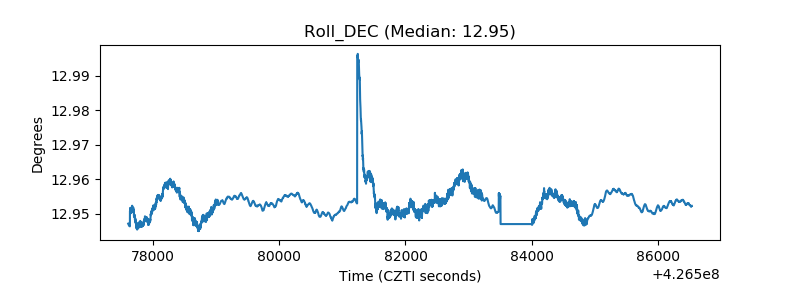 |
| _Roll_RA | 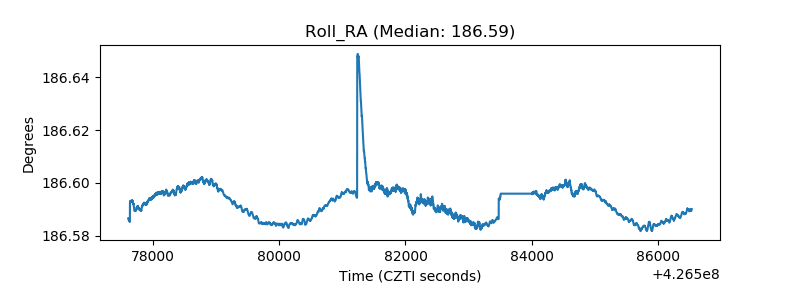 |
| Veto Counter | 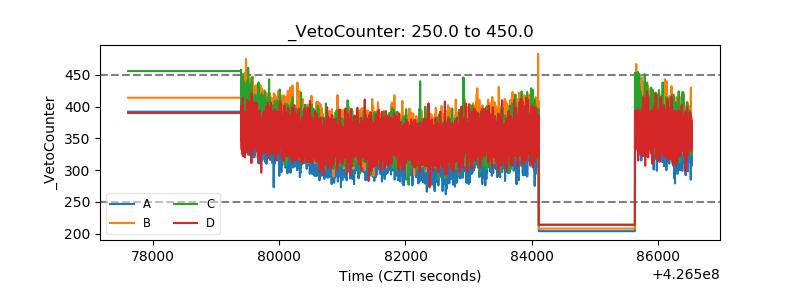 |