| Param | Original file | Final file |
|---|---|---|
| Filename | modeM0/AS1A12_037T03_9000005738_42059cztM0_level2.fits | modeM0/AS1A12_037T03_9000005738_42059cztM0_level2_quad_clean.evt |
| Size (bytes) | 385,240,320 | 98,352,000 |
| Size | 367.4 MB | 93.8 MB |
| Events in quadrant A | 3,443,804 | 660,894 |
| Events in quadrant B | 2,750,532 | 676,021 |
| Events in quadrant C | 2,808,373 | 641,757 |
| Events in quadrant D | 4,786,065 | 575,272 |
| Mode SS | |||
|---|---|---|---|
| Quadrant | BADHDUFLAG | Total packets | Discarded packets |
| A | 0 | 128 | 0 |
| B | 0 | 128 | 0 |
| C | 0 | 128 | 0 |
| D | 0 | 128 | 0 |
| Mode M9 | |||
|---|---|---|---|
| Quadrant | BADHDUFLAG | Total packets | Discarded packets |
| A | 0 | 28 | 0 |
| B | 0 | 28 | 0 |
| C | 0 | 28 | 0 |
| D | 0 | 28 | 0 |
| Mode M0 | |||
|---|---|---|---|
| Quadrant | BADHDUFLAG | Total packets | Discarded packets |
| A | 0 | 13742 | 5 |
| B | 0 | 12428 | 2 |
| C | 0 | 12176 | 2 |
| D | 0 | 18394 | 2 |
| Quadrant | Total seconds | Saturated seconds | Saturation percentage |
|---|---|---|---|
| A | 6062 | 17 | 0.280435% |
| B | 6062 | 24 | 0.395909% |
| C | 6062 | 2 | 0.032992% |
| D | 6062 | 269 | 4.437479% |
Noise dominated data is calculated using 1-second bins in cleaned event files. If a bin has >2000 counts, and if more than 50% of those come from <1% of pixels, then it is considered to be noise-dominated and hence unusable.
| Quadrant | # 1 sec bins | Bins with >0 counts | Bins with >2000 counts | High rate bins dominated by noise | Noise dominated (total time) | Noise dominated (detector-on time) | Marked lightcurve |
|---|---|---|---|---|---|---|---|
| A | 8929 | 6064 | 5 | 5 | 0.06% | 0.08% | 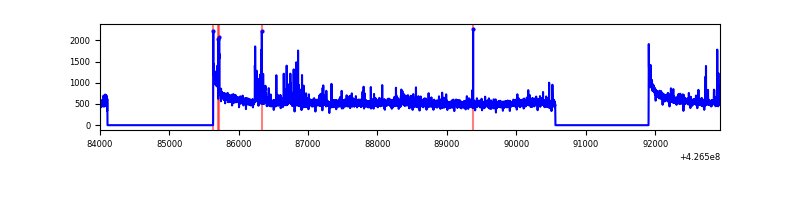 |
| B | 8929 | 6064 | 14 | 14 | 0.16% | 0.23% | 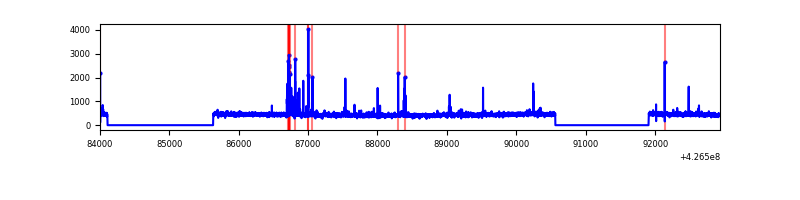 |
| C | 8929 | 6064 | 0 | 0 | 0.00% | 0.00% | 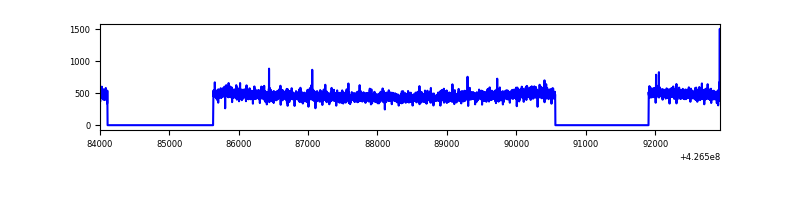 |
| D | 8929 | 6064 | 291 | 291 | 3.26% | 4.80% | 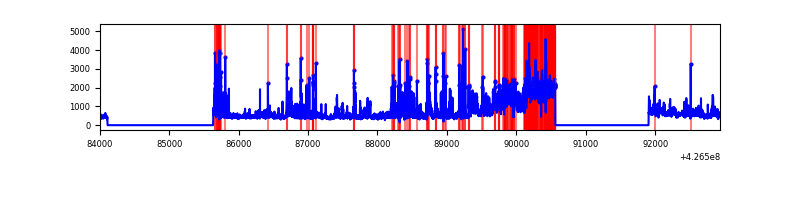 |
Top three noisy pixels from each quadrant. If the there are fewer than three noisy pixels in the level2.evt file, extra rows are filled as -1
| Pixel properties | Quadrant properties | ||||||
|---|---|---|---|---|---|---|---|
| Quadrant | DetID | PixID | Counts | Sigma | Mean | Median | Sigma |
| A | 10 | 83 | 623476 | 4510.15 | 668 | 654 | 138.1 |
| A | 15 | 223 | 166585 | 1201.59 | 668 | 654 | 138.1 |
| A | 12 | 189 | 36036 | 256.22 | 668 | 654 | 138.1 |
| B | 5 | 255 | 74773 | 572.3 | 663 | 644 | 129.5 |
| B | 15 | 85 | 27583 | 207.98 | 663 | 644 | 129.5 |
| B | 3 | 112 | 21296 | 159.44 | 663 | 644 | 129.5 |
| C | 15 | 214 | 256447 | 1664.8 | 651 | 654 | 153.6 |
| C | 12 | 249 | 8163 | 48.87 | 651 | 654 | 153.6 |
| C | 13 | 61 | 4372 | 24.2 | 651 | 654 | 153.6 |
| D | 1 | 52 | 1589449 | 10034.96 | 641 | 623 | 158.3 |
| D | 12 | 6 | 240105 | 1512.56 | 641 | 623 | 158.3 |
| D | 13 | 249 | 187943 | 1183.11 | 641 | 623 | 158.3 |
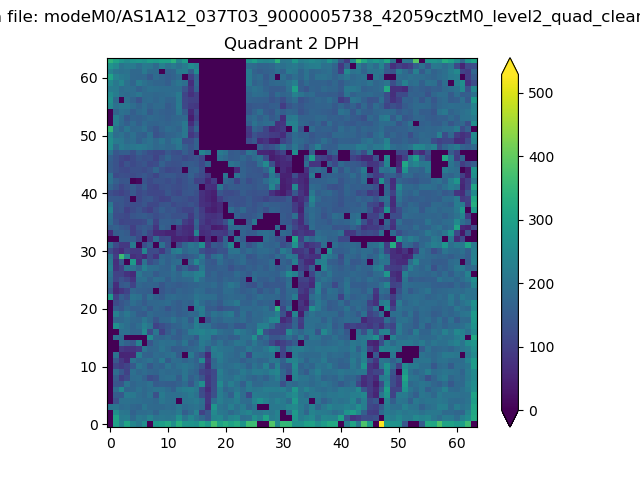
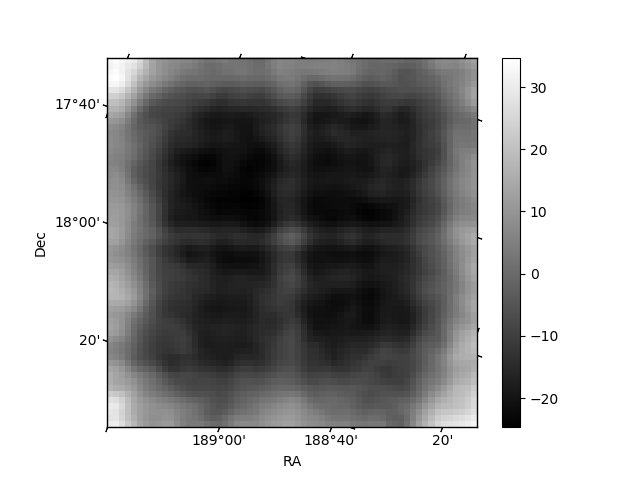
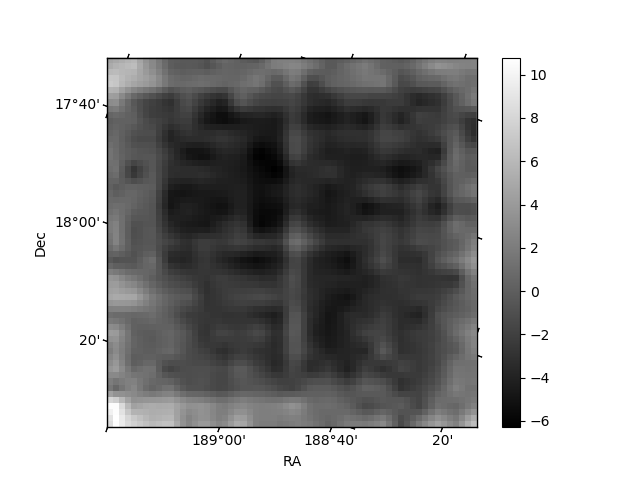
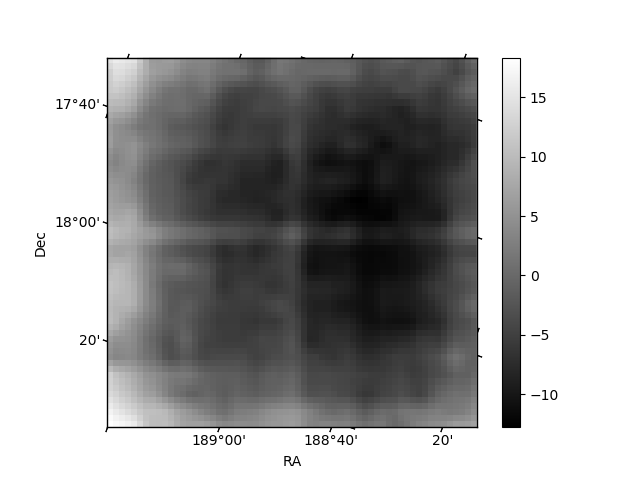
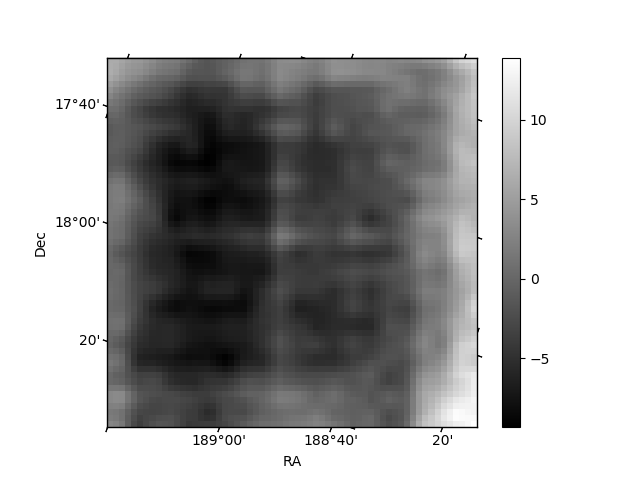
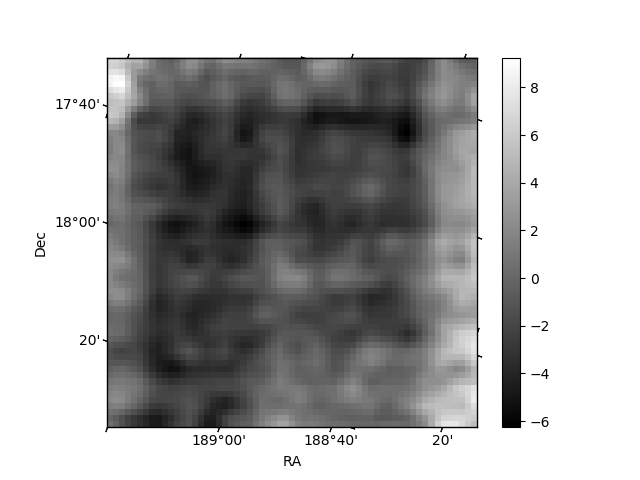
Histogram calculated using DETX and DETY for each event in the final _common_clean file
| Quadrant A | 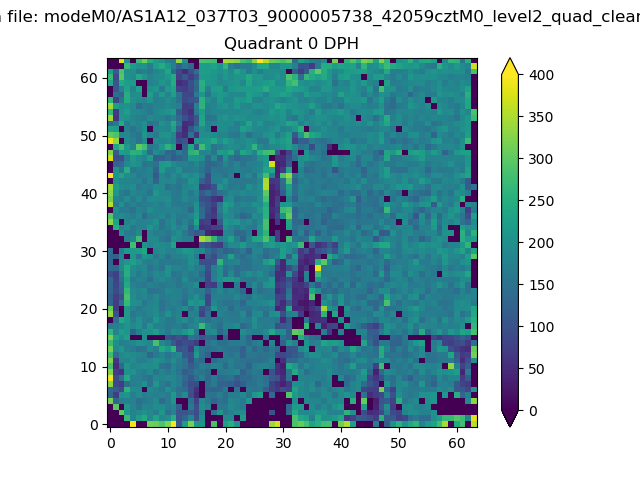 |
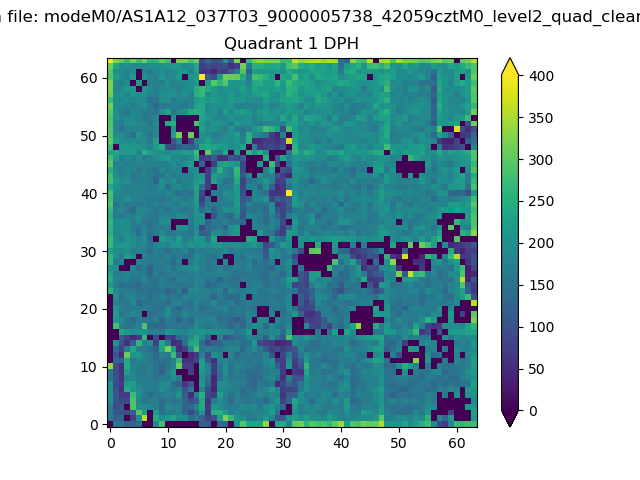 |
Quadrant B |
|---|---|---|---|
| Quadrant D | 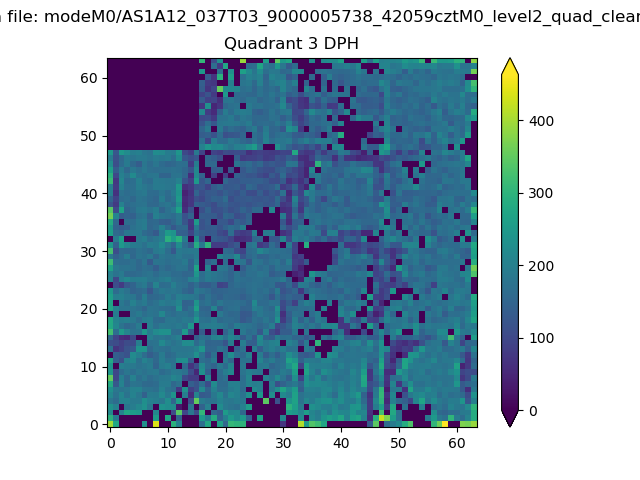 |
 |
Quadrant C |
| Plot type | Count rate plots | Images |
|---|---|---|
| Comparison with Poisson distribution Blue bars denote a histogram of data divided into 1 sec bins. Red curve is a Poisson curve with rate = median count rate of data. |
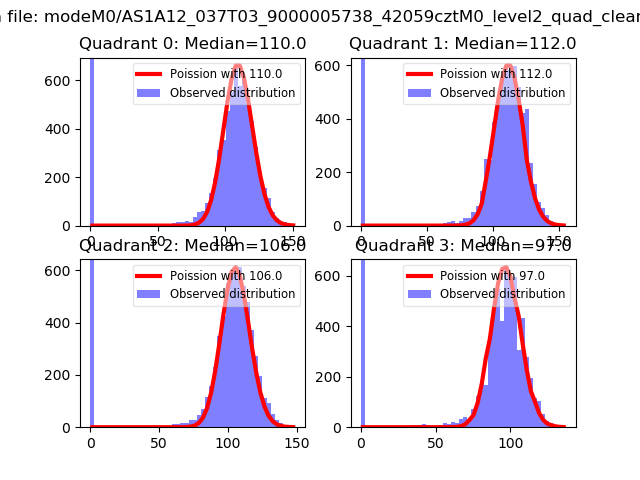 |
 |
| Quadrant-wise count rates Data is divided into 100 sec bins |
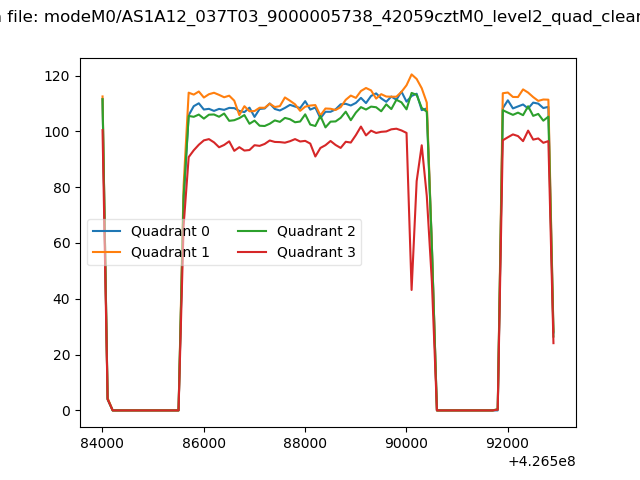 |
|
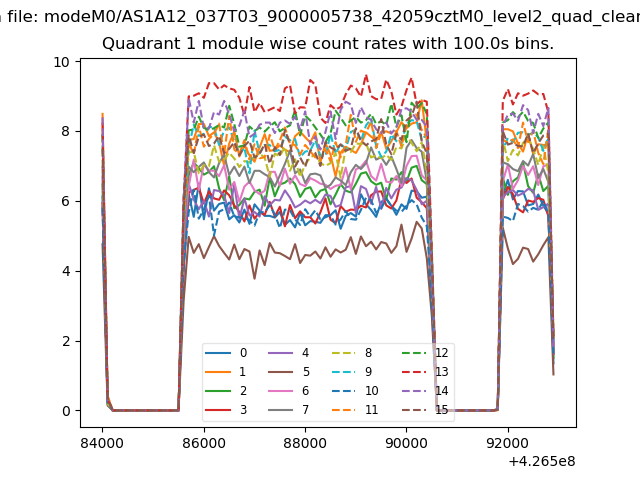
| Module-wise count rates for Quadrant A Data is divided into 100 sec bins |
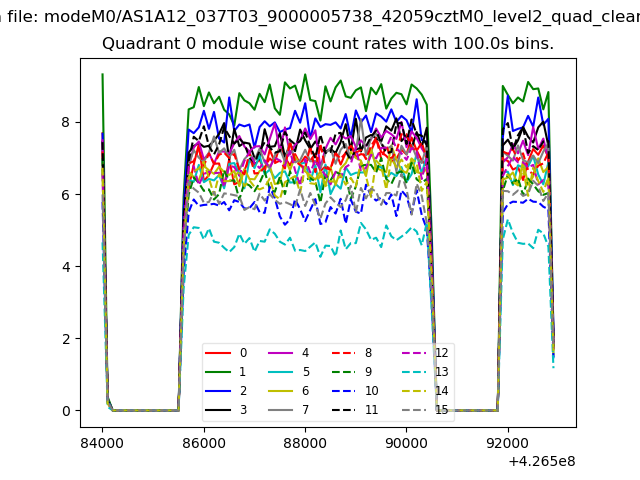 |
 |
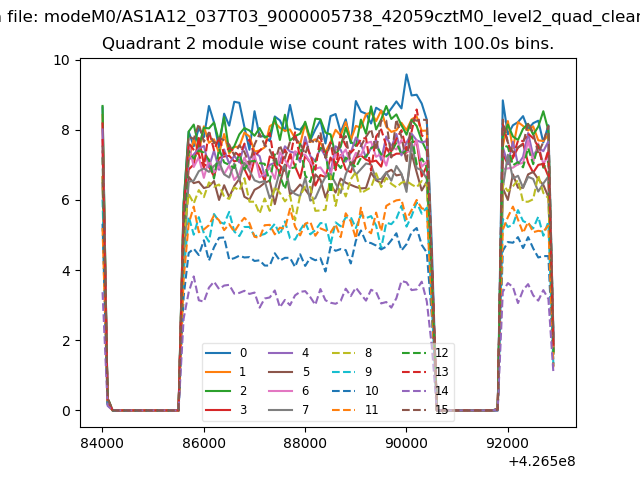
| Module-wise count rates for Quadrant B Data is divided into 100 sec bins |
 |
 |
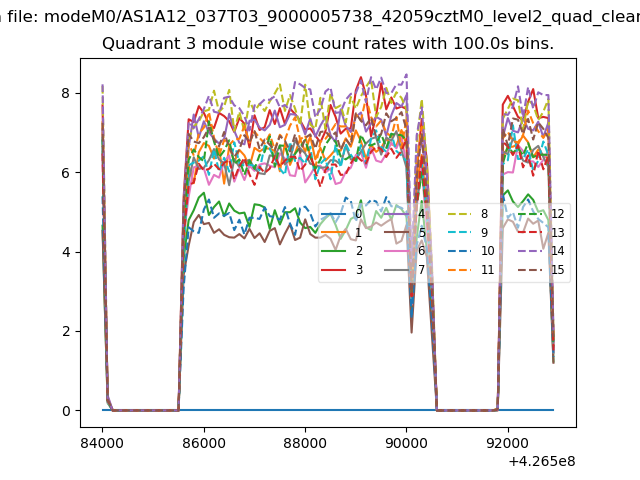
| Module-wise count rates for Quadrant C Data is divided into 100 sec bins |
 |
 |
| Module-wise count rates for Quadrant D Data is divided into 100 sec bins |
 |
 |
| Parameter | Plot |
|---|---|
| CZT HV Monitor | 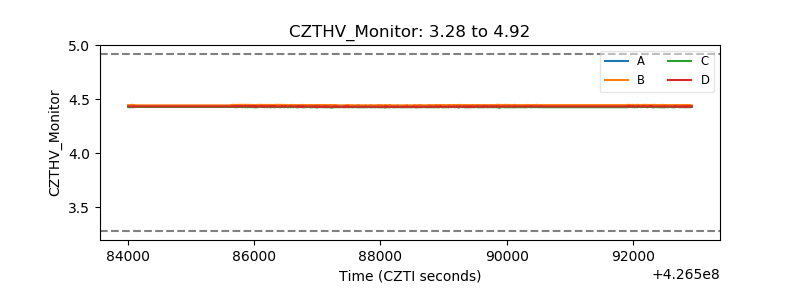 |
| D_VDD | 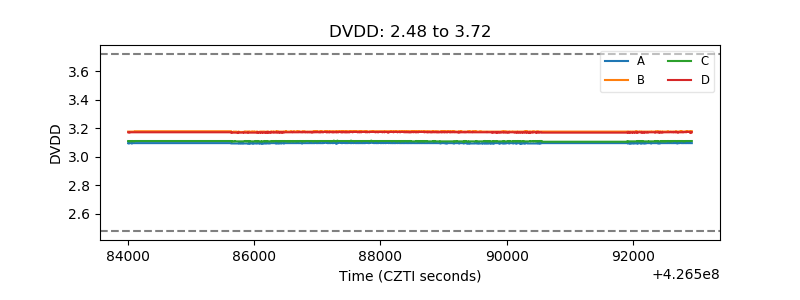 |
| Temperature 1 | 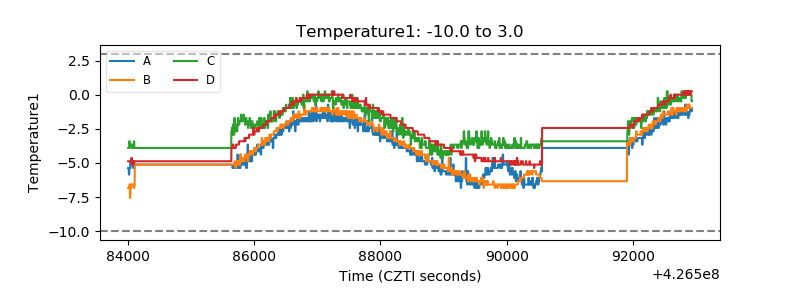 |
| Veto HV Monitor | 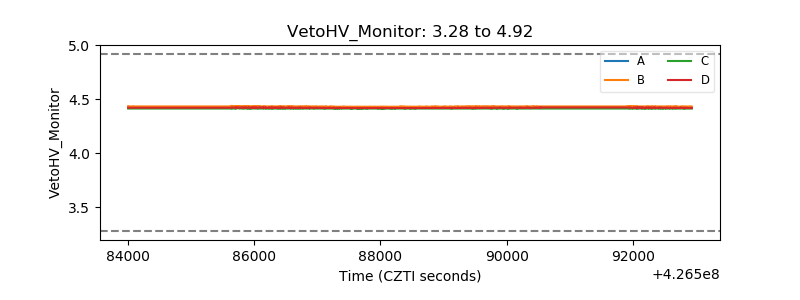 |
| Veto LLD | 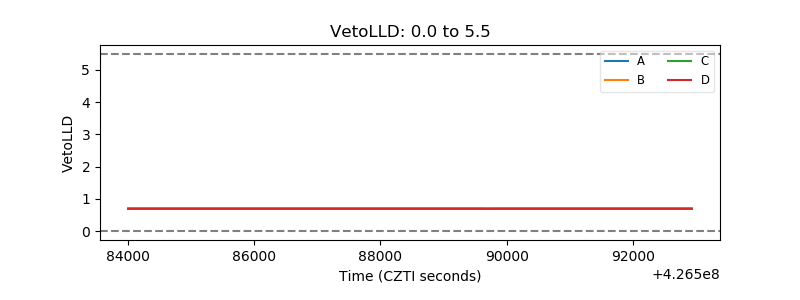 |
| Alpha Counter |  |
| _CPM_Rate |  |
| CZT Counter | 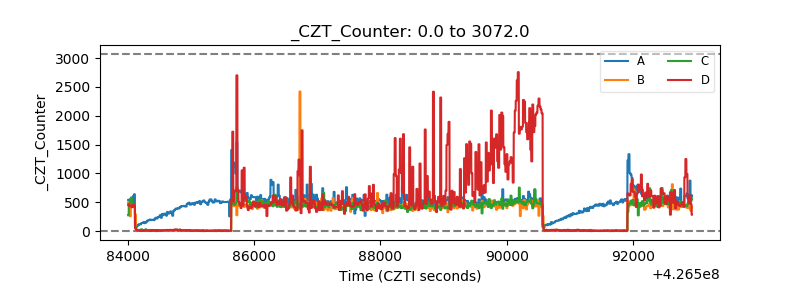 |
| +2.5 Volts monitor | 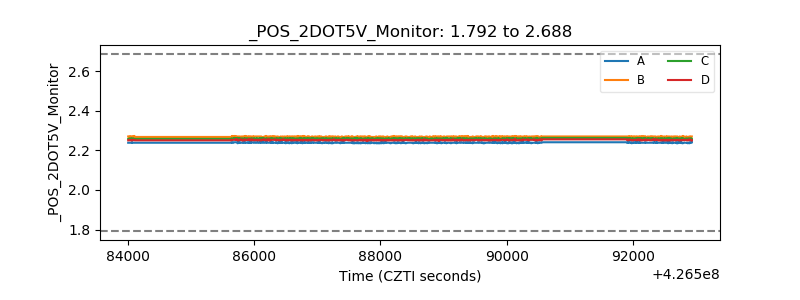 |
| +5 Volts monitor |  |
| _ROLL_ROT | 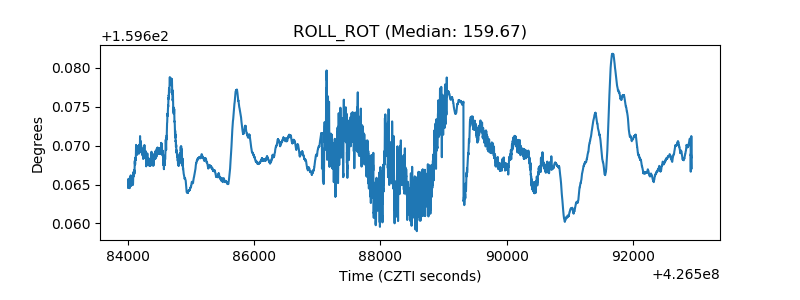 |
| _Roll_DEC | 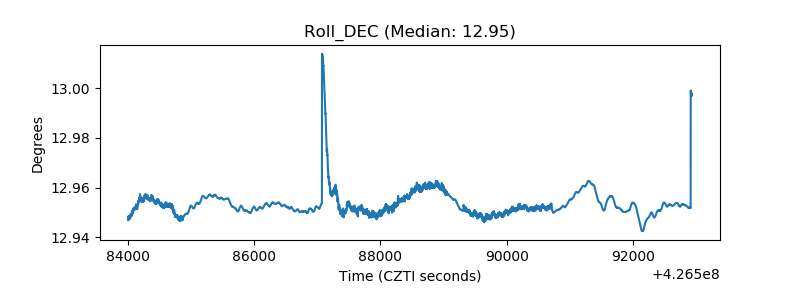 |
| _Roll_RA | 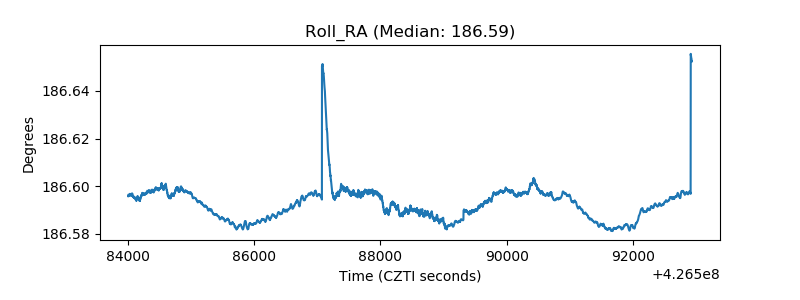 |
| Veto Counter |  |