| Param | Original file | Final file |
|---|---|---|
| Filename | modeM0/AS1A12_037T03_9000005738_42060cztM0_level2.fits | modeM0/AS1A12_037T03_9000005738_42060cztM0_level2_quad_clean.evt |
| Size (bytes) | 256,524,480 | 73,195,200 |
| Size | 244.6 MB | 69.8 MB |
| Events in quadrant A | 2,499,775 | 491,290 |
| Events in quadrant B | 1,976,973 | 499,319 |
| Events in quadrant C | 2,050,736 | 474,480 |
| Events in quadrant D | 2,615,294 | 433,009 |
| Mode SS | |||
|---|---|---|---|
| Quadrant | BADHDUFLAG | Total packets | Discarded packets |
| A | 0 | 92 | 0 |
| B | 0 | 92 | 0 |
| C | 0 | 92 | 0 |
| D | 0 | 92 | 0 |
| Mode M9 | |||
|---|---|---|---|
| Quadrant | BADHDUFLAG | Total packets | Discarded packets |
| A | 1 | 140040570742824 | 140037408686126 |
| B | 1 | -1 | -1 |
| C | 1 | -1 | -1 |
| D | 1 | -1 | -1 |
| Mode M0 | |||
|---|---|---|---|
| Quadrant | BADHDUFLAG | Total packets | Discarded packets |
| A | 0 | 10042 | 3 |
| B | 0 | 9225 | 3 |
| C | 0 | 9075 | 2 |
| D | 0 | 11065 | 3 |
| Quadrant | Total seconds | Saturated seconds | Saturation percentage |
|---|---|---|---|
| A | 4518 | 7 | 0.154936% |
| B | 4518 | 18 | 0.398406% |
| C | 4518 | 3 | 0.066401% |
| D | 4517 | 103 | 2.280275% |
Noise dominated data is calculated using 1-second bins in cleaned event files. If a bin has >2000 counts, and if more than 50% of those come from <1% of pixels, then it is considered to be noise-dominated and hence unusable.
| Quadrant | # 1 sec bins | Bins with >0 counts | Bins with >2000 counts | High rate bins dominated by noise | Noise dominated (total time) | Noise dominated (detector-on time) | Marked lightcurve |
|---|---|---|---|---|---|---|---|
| A | 4518 | 4518 | 0 | 0 | 0.00% | 0.00% | 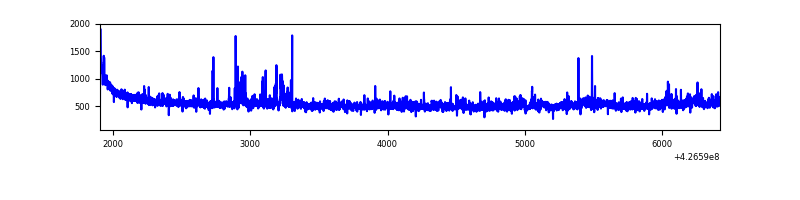 |
| B | 4518 | 4518 | 9 | 9 | 0.20% | 0.20% | 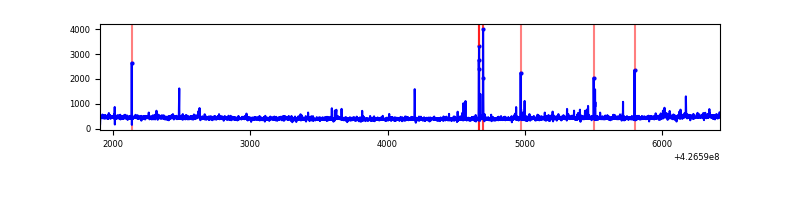 |
| C | 4518 | 4518 | 0 | 0 | 0.00% | 0.00% | 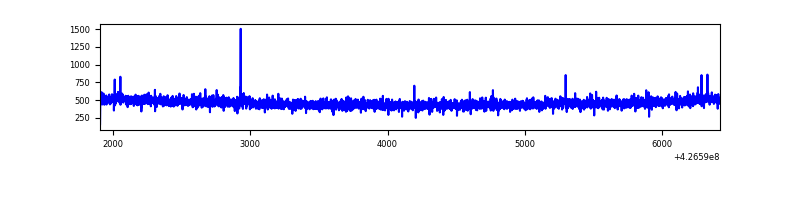 |
| D | 4517 | 4517 | 87 | 87 | 1.93% | 1.93% |  |
Top three noisy pixels from each quadrant. If the there are fewer than three noisy pixels in the level2.evt file, extra rows are filled as -1
| Pixel properties | Quadrant properties | ||||||
|---|---|---|---|---|---|---|---|
| Quadrant | DetID | PixID | Counts | Sigma | Mean | Median | Sigma |
| A | 10 | 83 | 434376 | 4266.68 | 487 | 476 | 101.7 |
| A | 15 | 223 | 108381 | 1061.07 | 487 | 476 | 101.7 |
| A | 15 | 222 | 29712 | 287.49 | 487 | 476 | 101.7 |
| B | 5 | 255 | 57836 | 605.87 | 484 | 471 | 94.7 |
| B | 3 | 112 | 22349 | 231.07 | 484 | 471 | 94.7 |
| B | 12 | 111 | 11760 | 119.23 | 484 | 471 | 94.7 |
| C | 15 | 214 | 189717 | 1665.09 | 474 | 477 | 113.7 |
| C | 12 | 249 | 6688 | 54.65 | 474 | 477 | 113.7 |
| C | 13 | 61 | 3277 | 24.64 | 474 | 477 | 113.7 |
| D | 1 | 52 | 292468 | 2487.78 | 469 | 456 | 117.4 |
| D | 12 | 6 | 160507 | 1363.55 | 469 | 456 | 117.4 |
| D | 13 | 249 | 140410 | 1192.33 | 469 | 456 | 117.4 |
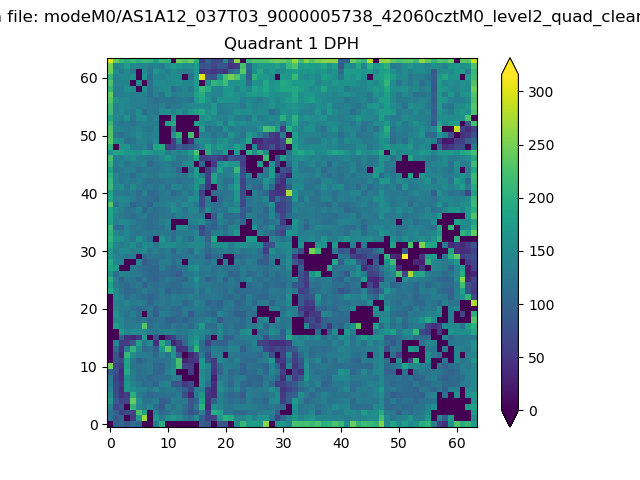
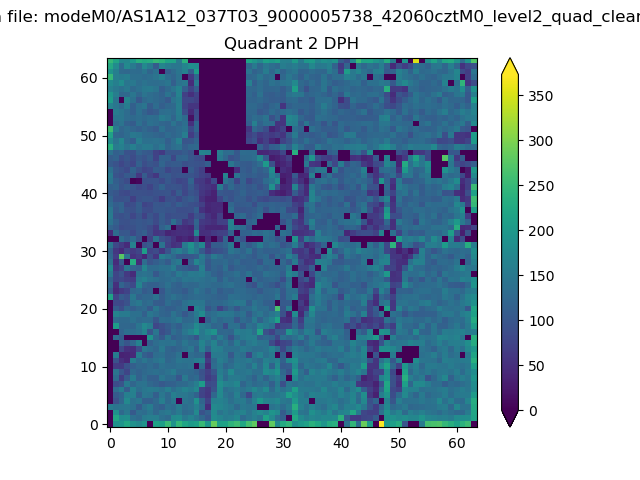
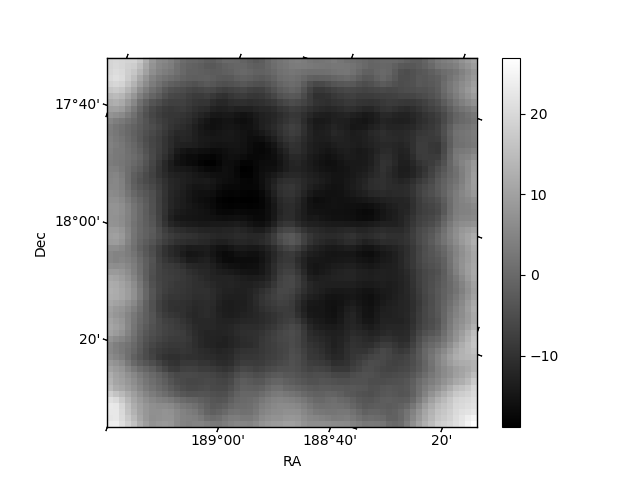
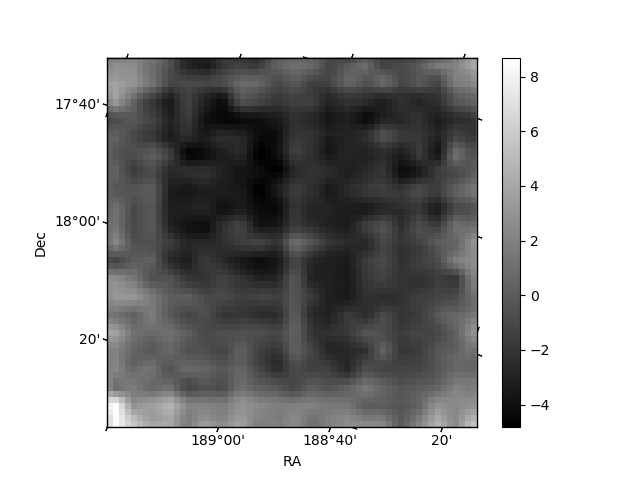
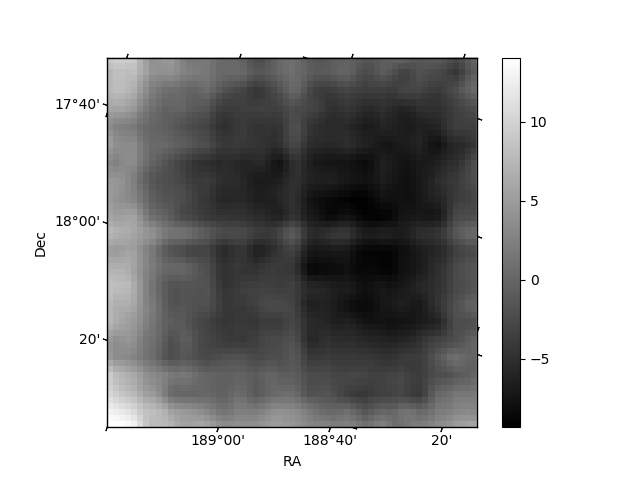
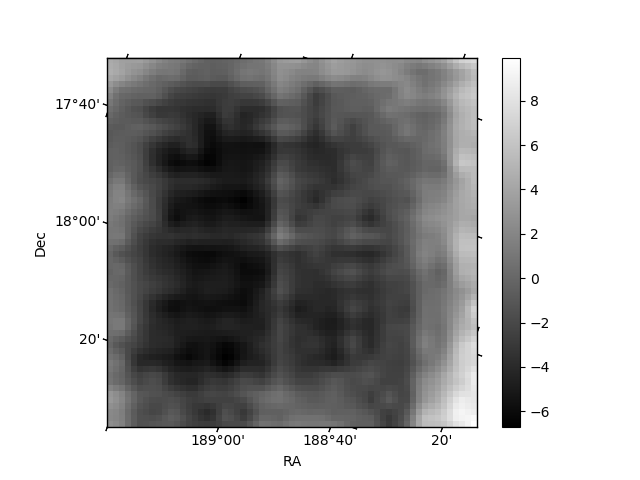
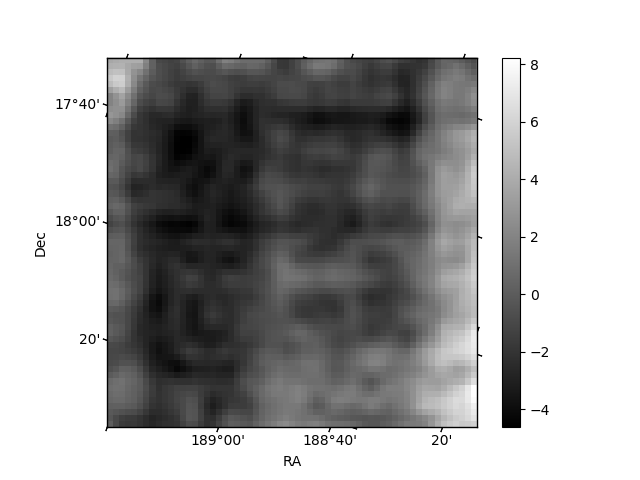
Histogram calculated using DETX and DETY for each event in the final _common_clean file
| Quadrant A | 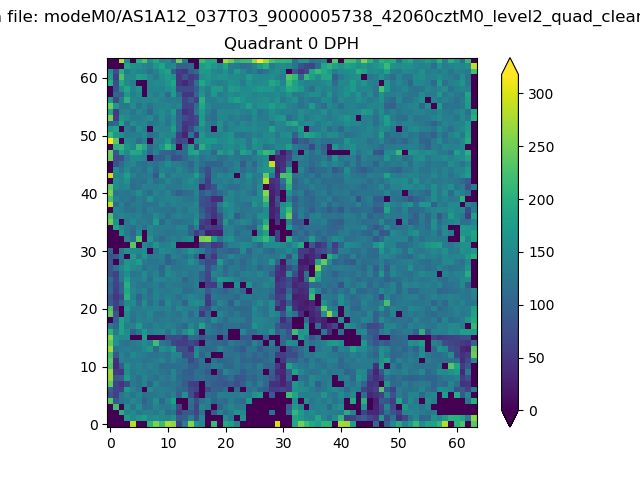 |
 |
Quadrant B |
|---|---|---|---|
| Quadrant D | 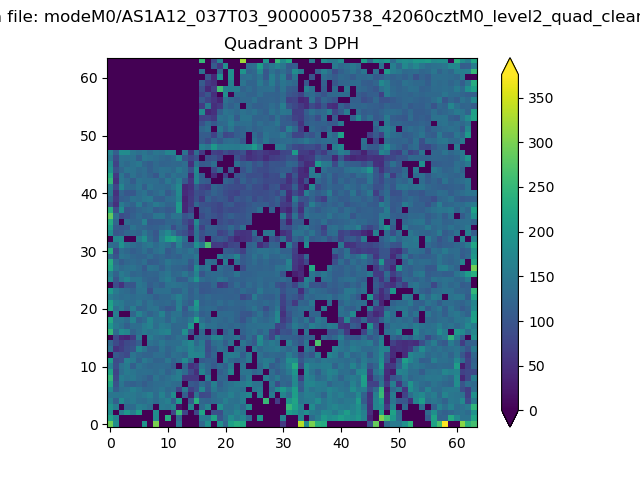 |
 |
Quadrant C |
| Plot type | Count rate plots | Images |
|---|---|---|
| Comparison with Poisson distribution Blue bars denote a histogram of data divided into 1 sec bins. Red curve is a Poisson curve with rate = median count rate of data. |
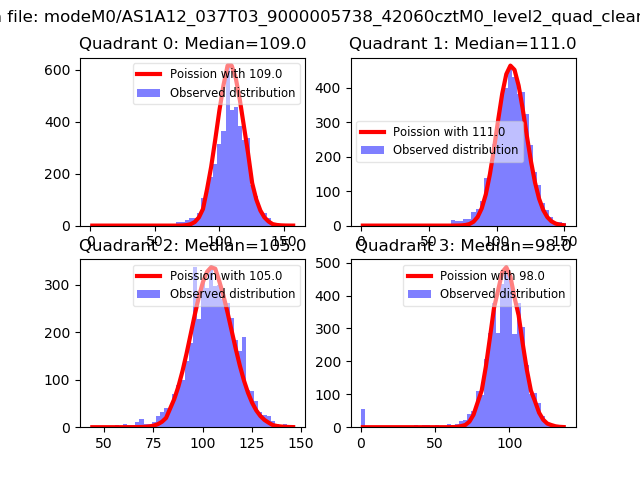 |
 |
| Quadrant-wise count rates Data is divided into 100 sec bins |
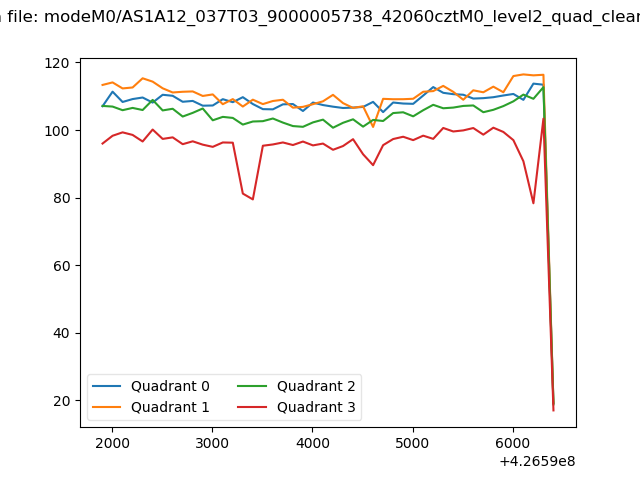 |
|
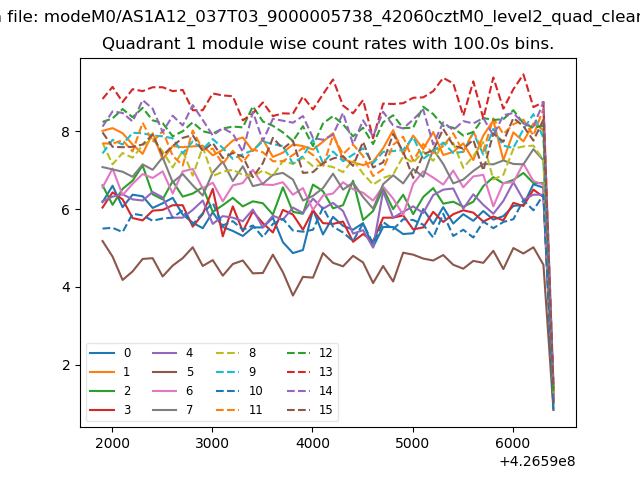
| Module-wise count rates for Quadrant A Data is divided into 100 sec bins |
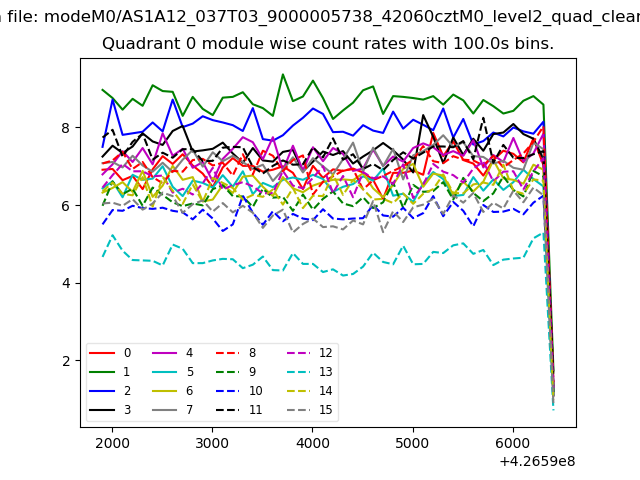 |
 |
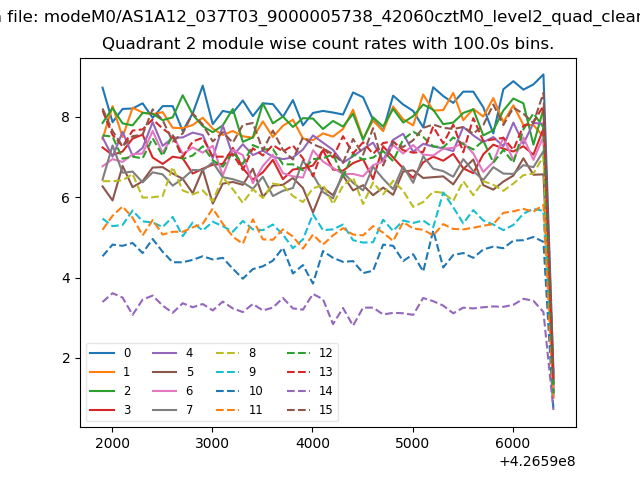
| Module-wise count rates for Quadrant B Data is divided into 100 sec bins |
 |
 |
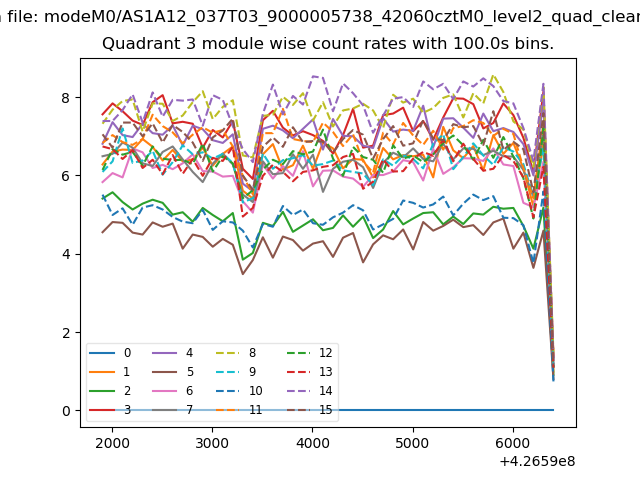
| Module-wise count rates for Quadrant C Data is divided into 100 sec bins |
 |
 |
| Module-wise count rates for Quadrant D Data is divided into 100 sec bins |
 |
 |
| Parameter | Plot |
|---|---|
| CZT HV Monitor | 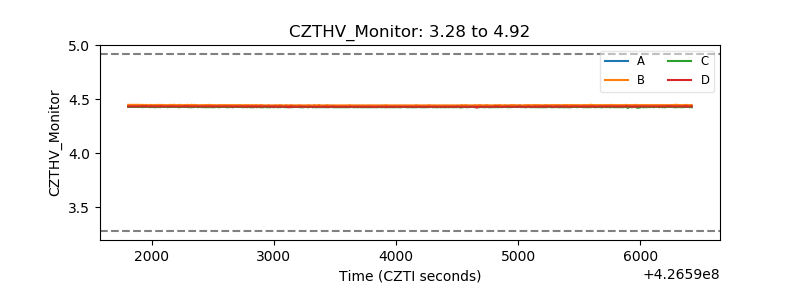 |
| D_VDD | 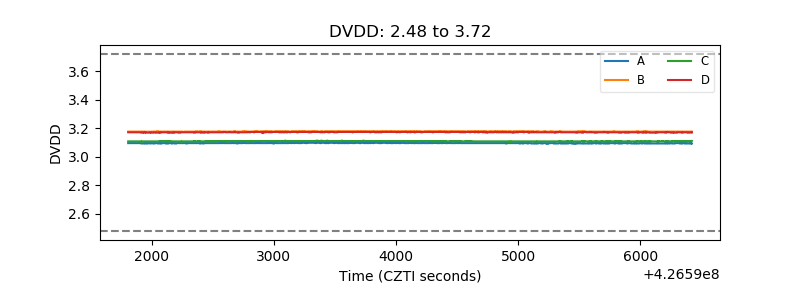 |
| Temperature 1 | 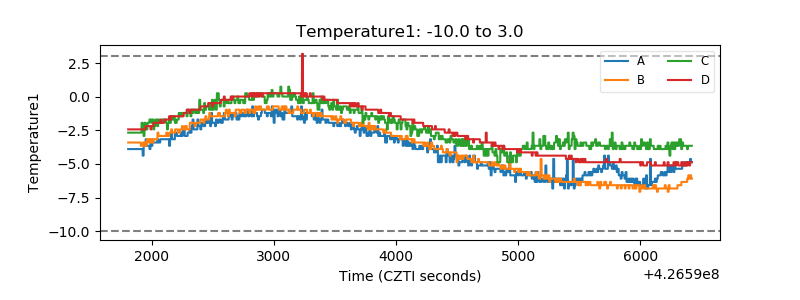 |
| Veto HV Monitor | 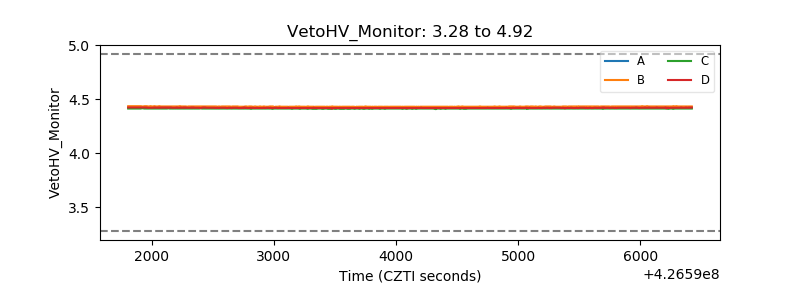 |
| Veto LLD | 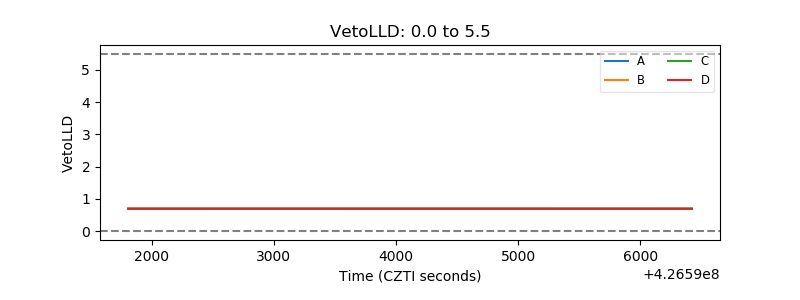 |
| Alpha Counter | 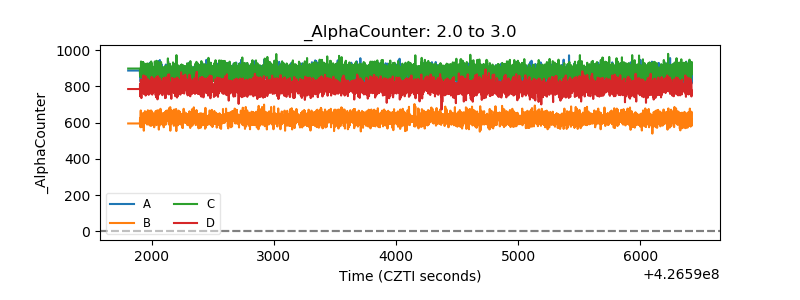 |
| _CPM_Rate |  |
| CZT Counter | 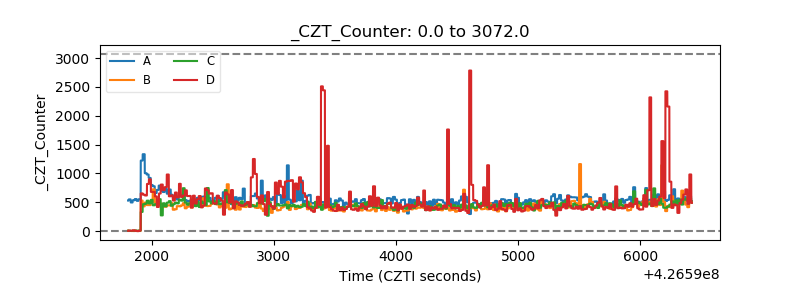 |
| +2.5 Volts monitor |  |
| +5 Volts monitor |  |
| _ROLL_ROT | 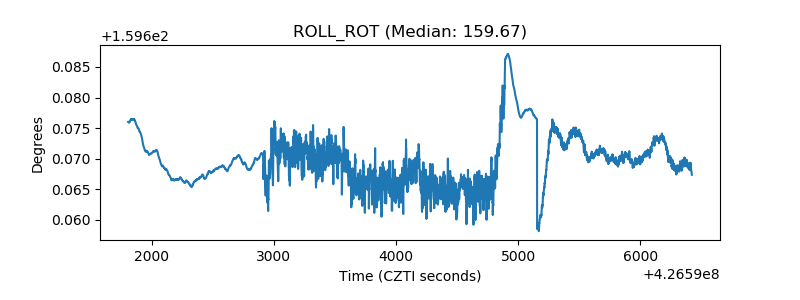 |
| _Roll_DEC | 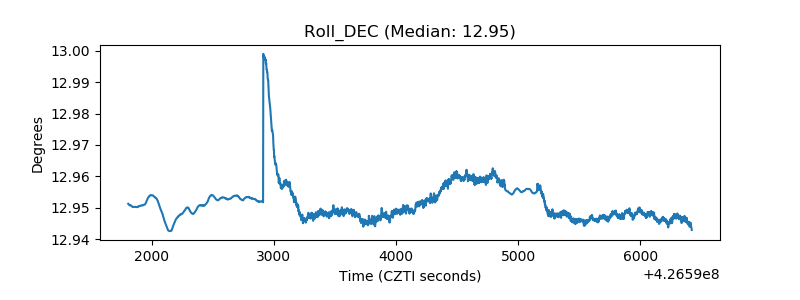 |
| _Roll_RA | 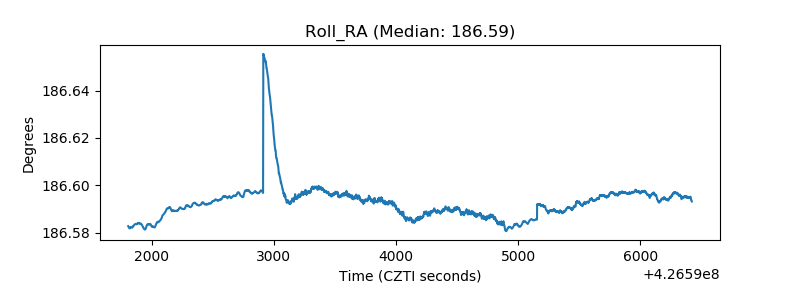 |
| Veto Counter | 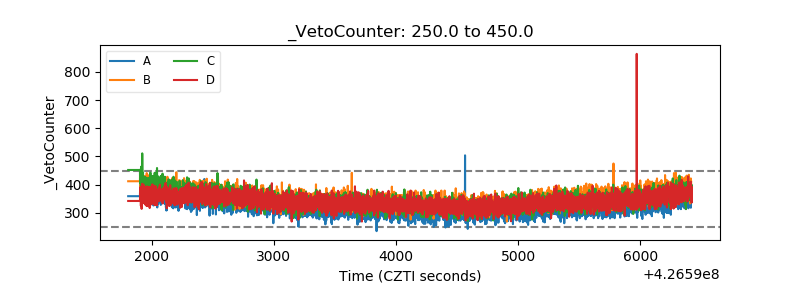 |