| Param | Original file | Final file |
|---|---|---|
| Filename | modeM0/AS1A12_037T03_9000005738_42062cztM0_level2.fits | modeM0/AS1A12_037T03_9000005738_42062cztM0_level2_quad_clean.evt |
| Size (bytes) | 747,659,520 | 165,061,440 |
| Size | 713.0 MB | 157.4 MB |
| Events in quadrant A | 9,001,976 | 1,008,679 |
| Events in quadrant B | 5,001,846 | 1,172,826 |
| Events in quadrant C | 4,963,327 | 1,116,437 |
| Events in quadrant D | 7,872,141 | 953,121 |
| Mode SS | |||
|---|---|---|---|
| Quadrant | BADHDUFLAG | Total packets | Discarded packets |
| A | 0 | 218 | 0 |
| B | 0 | 218 | 0 |
| C | 0 | 218 | 0 |
| D | 0 | 218 | 0 |
| Mode M9 | |||
|---|---|---|---|
| Quadrant | BADHDUFLAG | Total packets | Discarded packets |
| A | 0 | 33 | 0 |
| B | 0 | 34 | 0 |
| C | 0 | 34 | 0 |
| D | 0 | 34 | 0 |
| Mode M0 | |||
|---|---|---|---|
| Quadrant | BADHDUFLAG | Total packets | Discarded packets |
| A | 0 | 33704 | 3 |
| B | 0 | 22645 | 3 |
| C | 0 | 21780 | 3 |
| D | 0 | 31075 | 3 |
| Quadrant | Total seconds | Saturated seconds | Saturation percentage |
|---|---|---|---|
| A | 10781 | 1401 | 12.995084% |
| B | 10781 | 83 | 0.769873% |
| C | 10781 | 9 | 0.083480% |
| D | 10781 | 962 | 8.923105% |
Noise dominated data is calculated using 1-second bins in cleaned event files. If a bin has >2000 counts, and if more than 50% of those come from <1% of pixels, then it is considered to be noise-dominated and hence unusable.
| Quadrant | # 1 sec bins | Bins with >0 counts | Bins with >2000 counts | High rate bins dominated by noise | Noise dominated (total time) | Noise dominated (detector-on time) | Marked lightcurve |
|---|---|---|---|---|---|---|---|
| A | 13586 | 10783 | 1122 | 1122 | 8.26% | 10.41% | 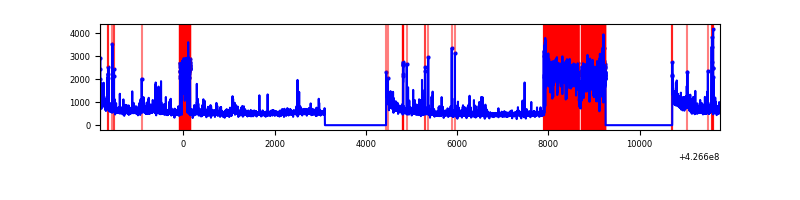 |
| B | 13586 | 10783 | 43 | 43 | 0.32% | 0.40% | 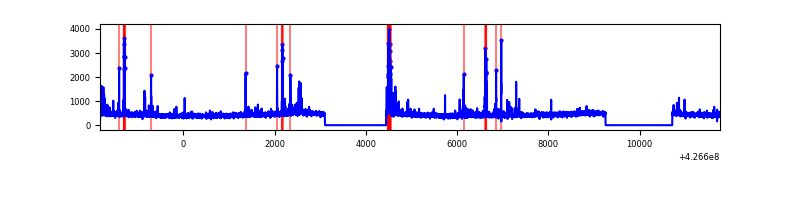 |
| C | 13586 | 10783 | 0 | 0 | 0.00% | 0.00% | 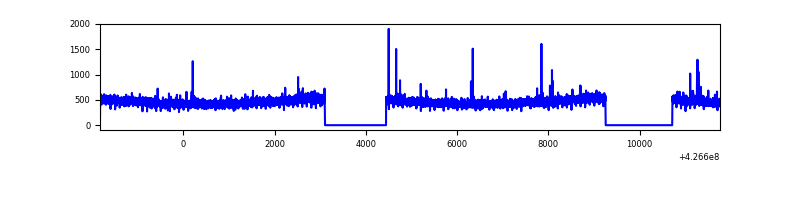 |
| D | 13586 | 10783 | 611 | 611 | 4.50% | 5.67% | 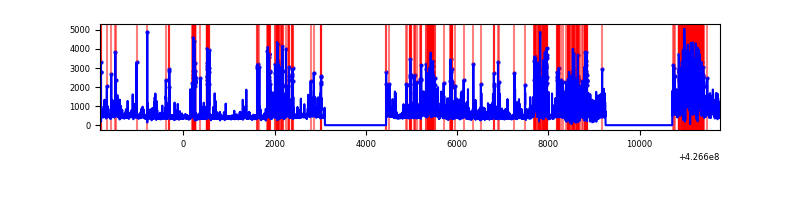 |
Top three noisy pixels from each quadrant. If the there are fewer than three noisy pixels in the level2.evt file, extra rows are filled as -1
| Pixel properties | Quadrant properties | ||||||
|---|---|---|---|---|---|---|---|
| Quadrant | DetID | PixID | Counts | Sigma | Mean | Median | Sigma |
| A | 15 | 223 | 2779561 | 12054.25 | 1118 | 1095 | 230.5 |
| A | 10 | 83 | 1079570 | 4678.92 | 1118 | 1095 | 230.5 |
| A | 15 | 222 | 547225 | 2369.36 | 1118 | 1095 | 230.5 |
| B | 5 | 255 | 170132 | 751.11 | 1165 | 1134 | 225.0 |
| B | 15 | 85 | 107517 | 472.82 | 1165 | 1134 | 225.0 |
| B | 0 | 229 | 75822 | 331.95 | 1165 | 1134 | 225.0 |
| C | 15 | 214 | 445349 | 1662.62 | 1142 | 1148 | 267.2 |
| C | 12 | 249 | 34358 | 124.3 | 1142 | 1148 | 267.2 |
| C | 7 | 220 | 12810 | 43.65 | 1142 | 1148 | 267.2 |
| D | 1 | 52 | 1137851 | 4229.8 | 1096 | 1067 | 268.8 |
| D | 12 | 6 | 802859 | 2983.35 | 1096 | 1067 | 268.8 |
| D | 13 | 249 | 677349 | 2516.34 | 1096 | 1067 | 268.8 |
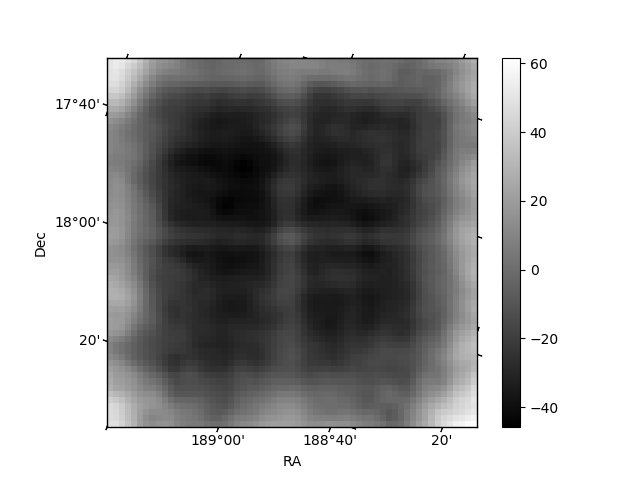
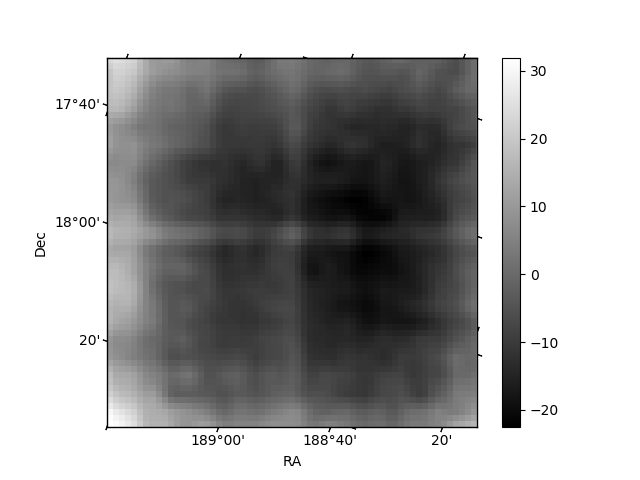
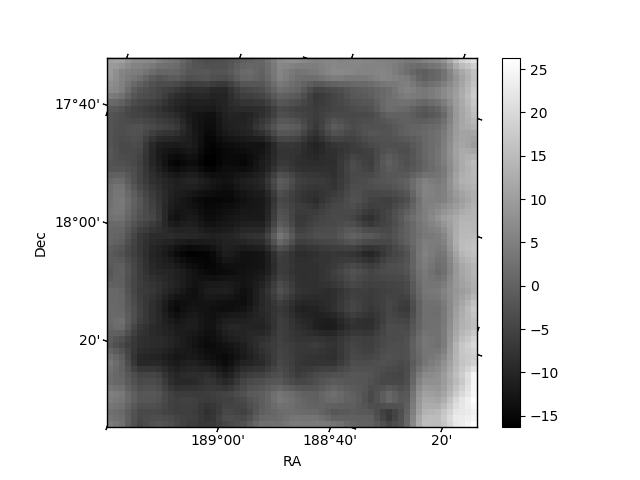
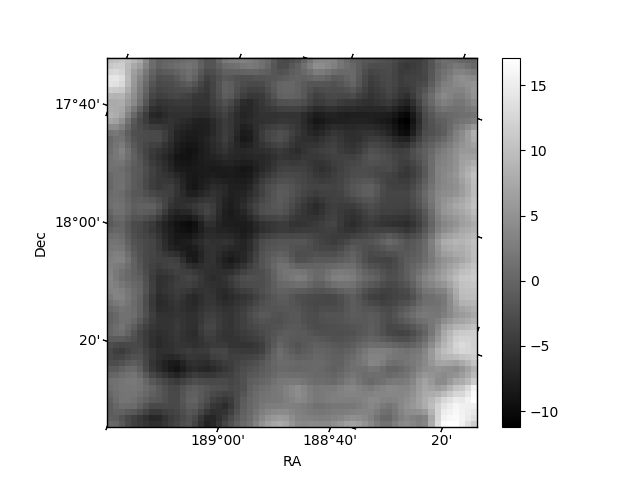
Histogram calculated using DETX and DETY for each event in the final _common_clean file
| Quadrant A | 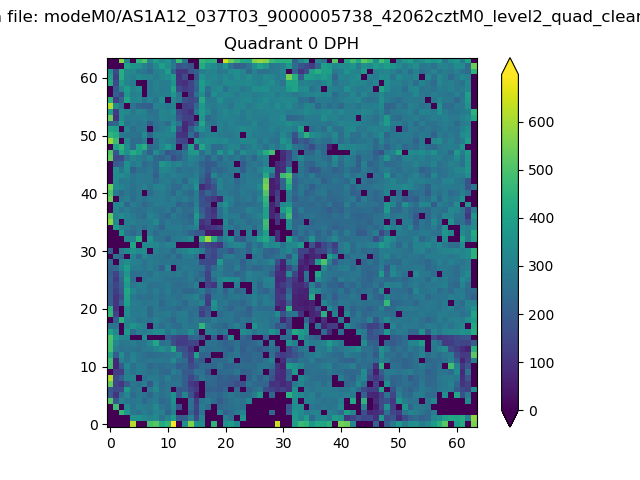 |
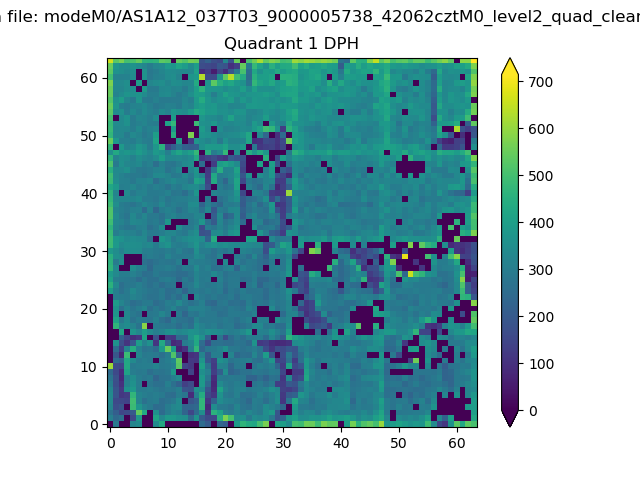 |
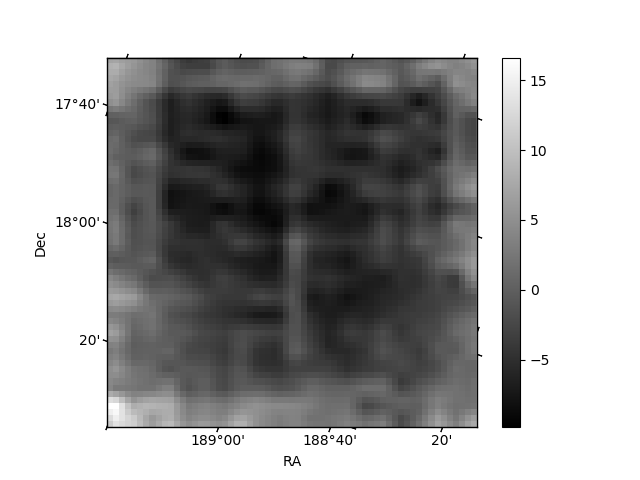
Quadrant B |
|---|---|---|---|
| Quadrant D | 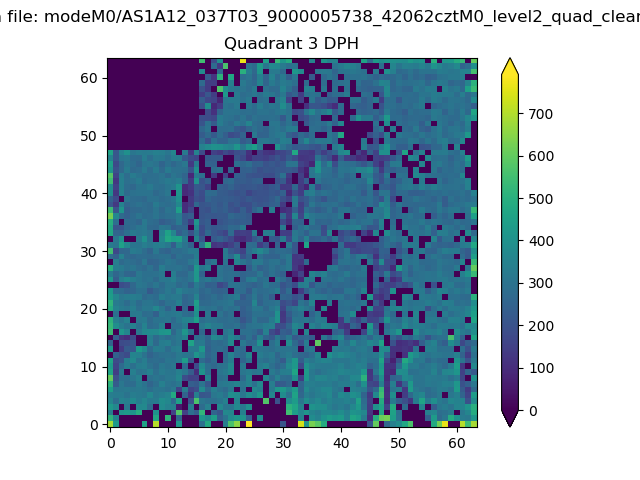 |
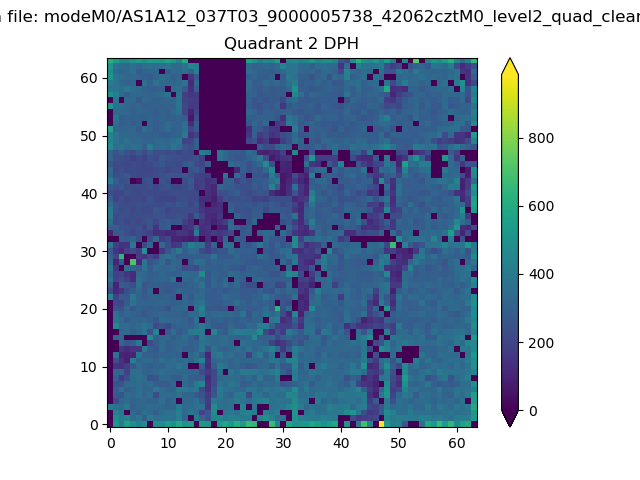 |
Quadrant C |
| Plot type | Count rate plots | Images |
|---|---|---|
| Comparison with Poisson distribution Blue bars denote a histogram of data divided into 1 sec bins. Red curve is a Poisson curve with rate = median count rate of data. |
 |
 |
| Quadrant-wise count rates Data is divided into 100 sec bins |
 |
|
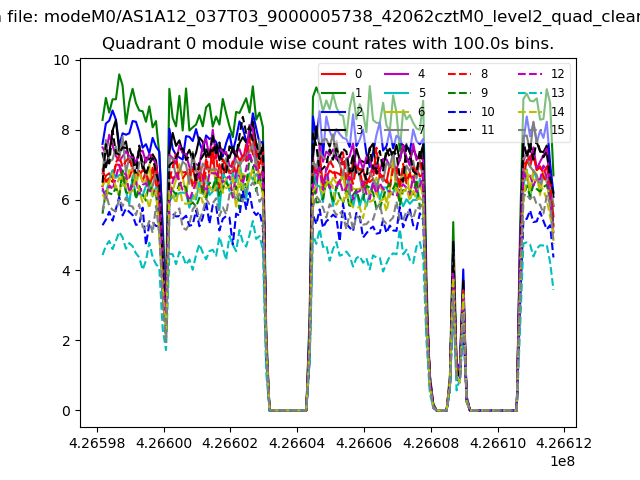
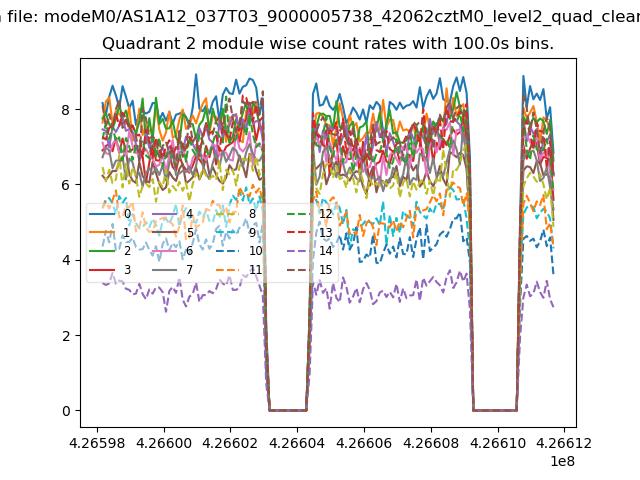
| Module-wise count rates for Quadrant A Data is divided into 100 sec bins |
 |
 |
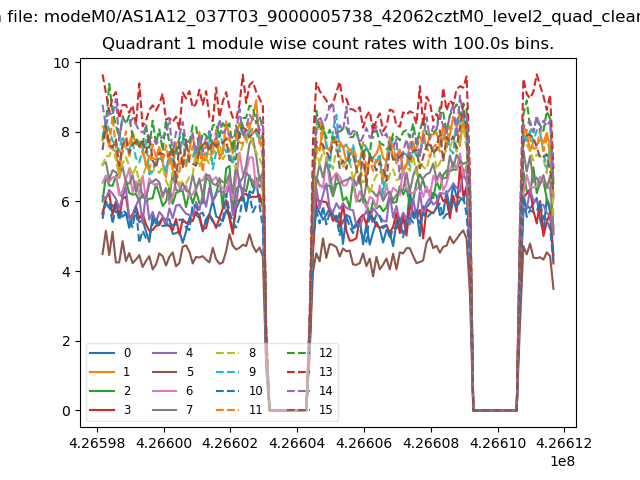
| Module-wise count rates for Quadrant B Data is divided into 100 sec bins |
 |
 |
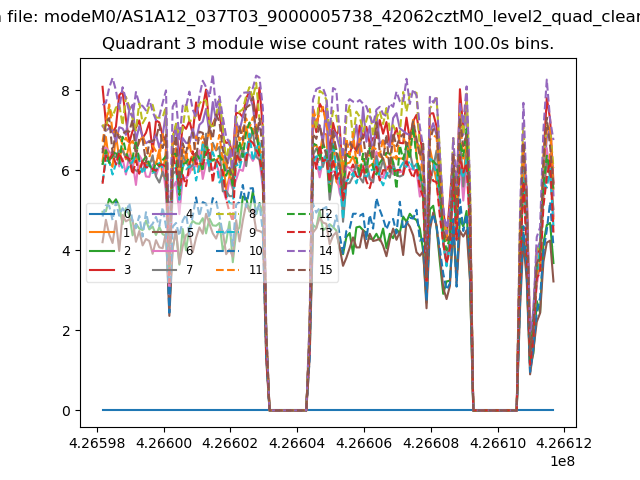
| Module-wise count rates for Quadrant C Data is divided into 100 sec bins |
 |
 |
| Module-wise count rates for Quadrant D Data is divided into 100 sec bins |
 |
 |
| Parameter | Plot |
|---|---|
| CZT HV Monitor | 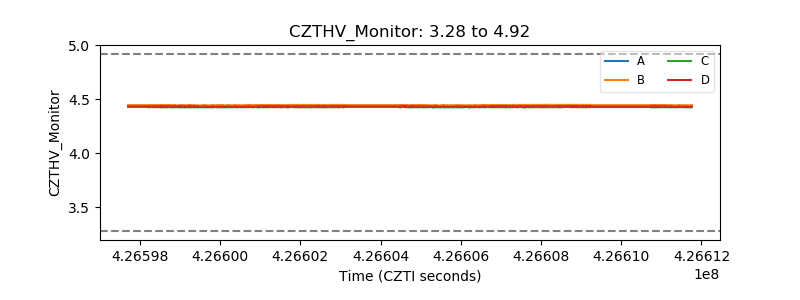 |
| D_VDD | 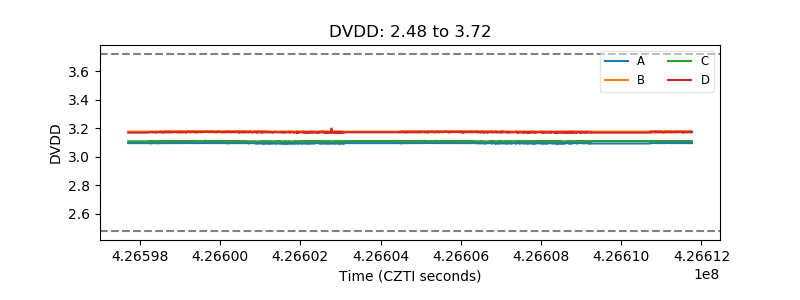 |
| Temperature 1 | 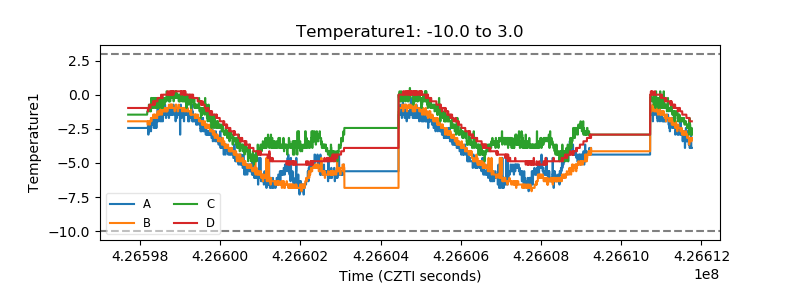 |
| Veto HV Monitor | 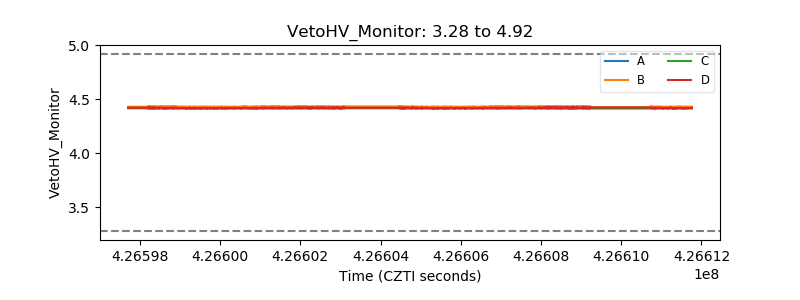 |
| Veto LLD | 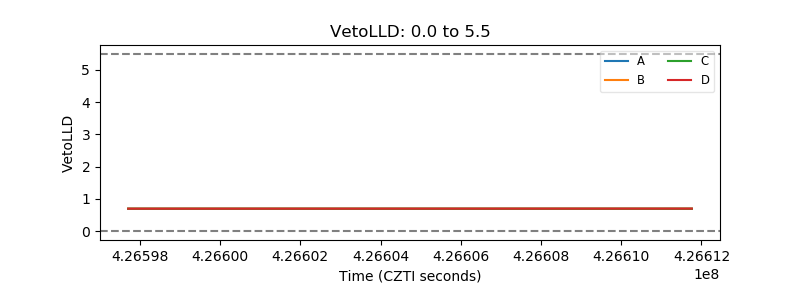 |
| Alpha Counter |  |
| _CPM_Rate |  |
| CZT Counter | 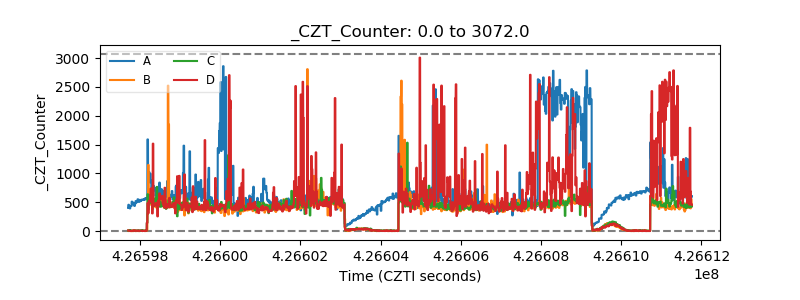 |
| +2.5 Volts monitor | 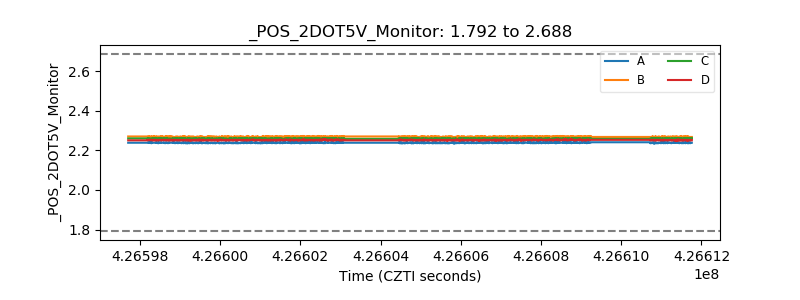 |
| +5 Volts monitor |  |
| _ROLL_ROT |  |
| _Roll_DEC | 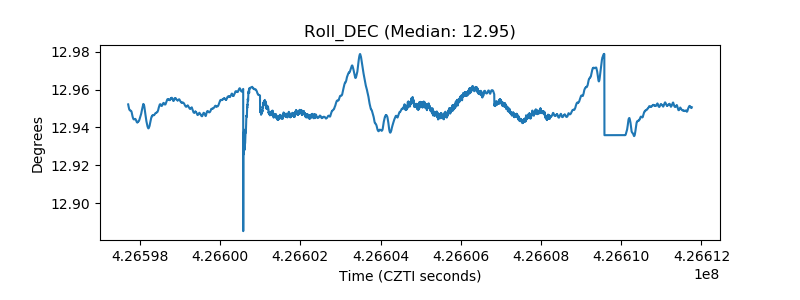 |
| _Roll_RA | 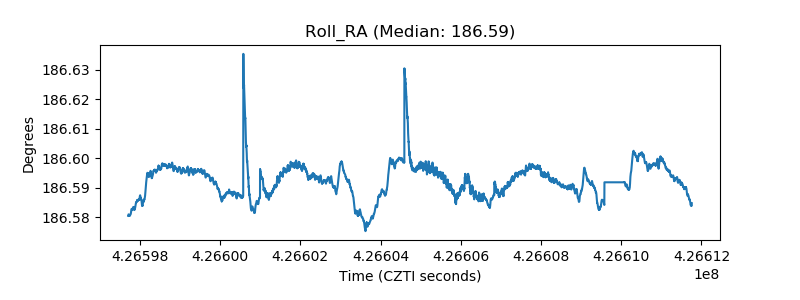 |
| Veto Counter | 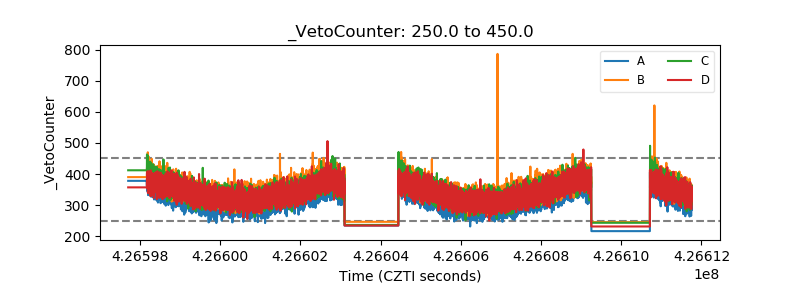 |