| Param | Original file | Final file |
|---|---|---|
| Filename | modeM0/AS1A12_037T03_9000005738_42063cztM0_level2.fits | modeM0/AS1A12_037T03_9000005738_42063cztM0_level2_quad_clean.evt |
| Size (bytes) | 374,685,120 | 90,178,560 |
| Size | 357.3 MB | 86.0 MB |
| Events in quadrant A | 3,452,894 | 608,423 |
| Events in quadrant B | 2,489,224 | 627,399 |
| Events in quadrant C | 2,617,485 | 595,800 |
| Events in quadrant D | 4,867,031 | 501,380 |
| Mode SS | |||
|---|---|---|---|
| Quadrant | BADHDUFLAG | Total packets | Discarded packets |
| A | 0 | 114 | 0 |
| B | 0 | 114 | 0 |
| C | 0 | 114 | 0 |
| D | 0 | 114 | 0 |
| Mode M9 | |||
|---|---|---|---|
| Quadrant | BADHDUFLAG | Total packets | Discarded packets |
| A | 0 | 22 | 0 |
| B | 0 | 23 | 0 |
| C | 0 | 23 | 0 |
| D | 0 | 23 | 0 |
| Mode M0 | |||
|---|---|---|---|
| Quadrant | BADHDUFLAG | Total packets | Discarded packets |
| A | 0 | 13810 | 2 |
| B | 0 | 11556 | 2 |
| C | 0 | 11530 | 2 |
| D | 0 | 18449 | 2 |
| Quadrant | Total seconds | Saturated seconds | Saturation percentage |
|---|---|---|---|
| A | 5690 | 40 | 0.702988% |
| B | 5690 | 15 | 0.263620% |
| C | 5690 | 3 | 0.052724% |
| D | 5690 | 651 | 11.441125% |
Noise dominated data is calculated using 1-second bins in cleaned event files. If a bin has >2000 counts, and if more than 50% of those come from <1% of pixels, then it is considered to be noise-dominated and hence unusable.
| Quadrant | # 1 sec bins | Bins with >0 counts | Bins with >2000 counts | High rate bins dominated by noise | Noise dominated (total time) | Noise dominated (detector-on time) | Marked lightcurve |
|---|---|---|---|---|---|---|---|
| A | 7242 | 5691 | 27 | 27 | 0.37% | 0.47% | 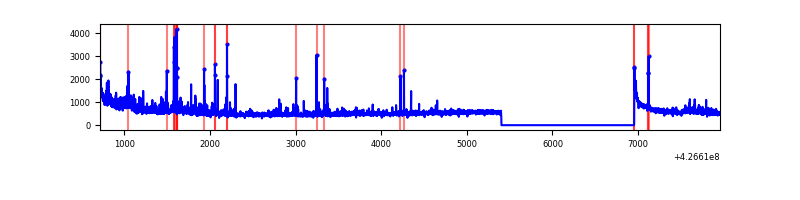 |
| B | 7242 | 5691 | 5 | 5 | 0.07% | 0.09% | 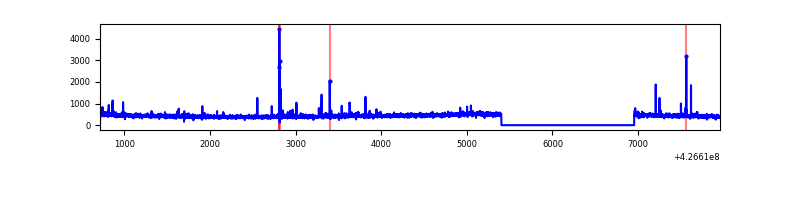 |
| C | 7242 | 5691 | 0 | 0 | 0.00% | 0.00% | 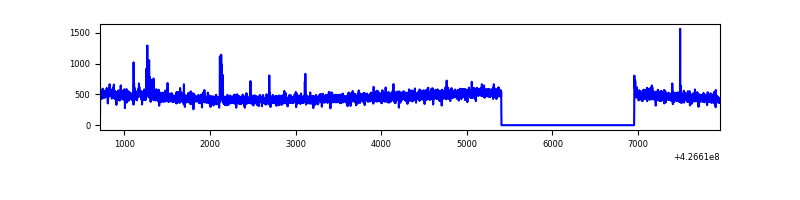 |
| D | 7242 | 5691 | 487 | 487 | 6.72% | 8.56% | 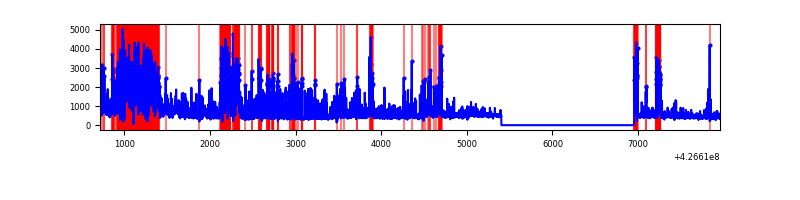 |
Top three noisy pixels from each quadrant. If the there are fewer than three noisy pixels in the level2.evt file, extra rows are filled as -1
| Pixel properties | Quadrant properties | ||||||
|---|---|---|---|---|---|---|---|
| Quadrant | DetID | PixID | Counts | Sigma | Mean | Median | Sigma |
| A | 10 | 83 | 627787 | 4961.45 | 612 | 598 | 126.4 |
| A | 15 | 222 | 318281 | 2513.07 | 612 | 598 | 126.4 |
| A | 15 | 223 | 95928 | 754.12 | 612 | 598 | 126.4 |
| B | 3 | 112 | 26999 | 219.72 | 614 | 596 | 120.2 |
| B | 5 | 255 | 26913 | 219.0 | 614 | 596 | 120.2 |
| B | 0 | 229 | 15145 | 121.07 | 614 | 596 | 120.2 |
| C | 15 | 214 | 235591 | 1668.31 | 599 | 603 | 140.9 |
| C | 12 | 249 | 22119 | 152.75 | 599 | 603 | 140.9 |
| C | 7 | 220 | 14529 | 98.87 | 599 | 603 | 140.9 |
| D | 1 | 52 | 939471 | 6578.43 | 570 | 552 | 142.7 |
| D | 12 | 218 | 516099 | 3612.12 | 570 | 552 | 142.7 |
| D | 13 | 249 | 514408 | 3600.27 | 570 | 552 | 142.7 |
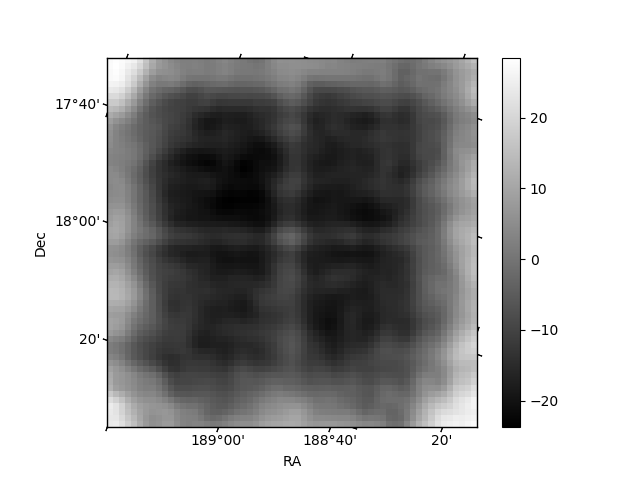
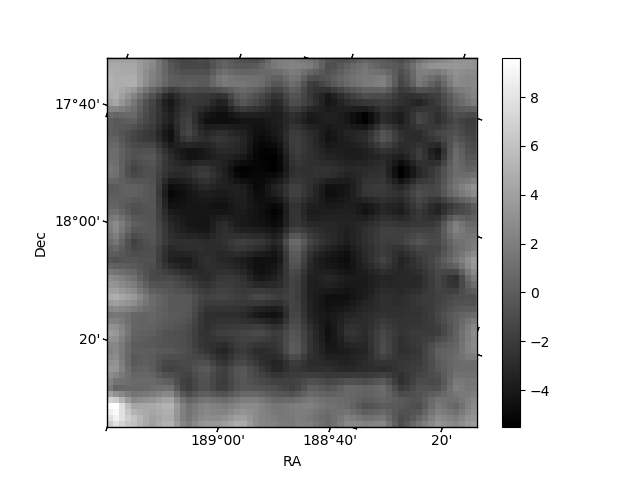
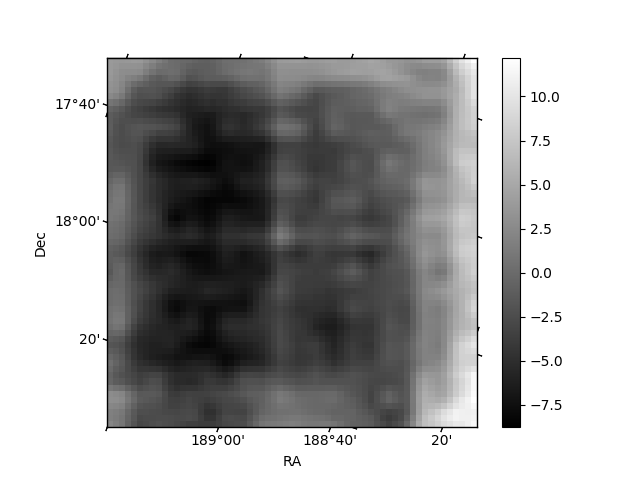
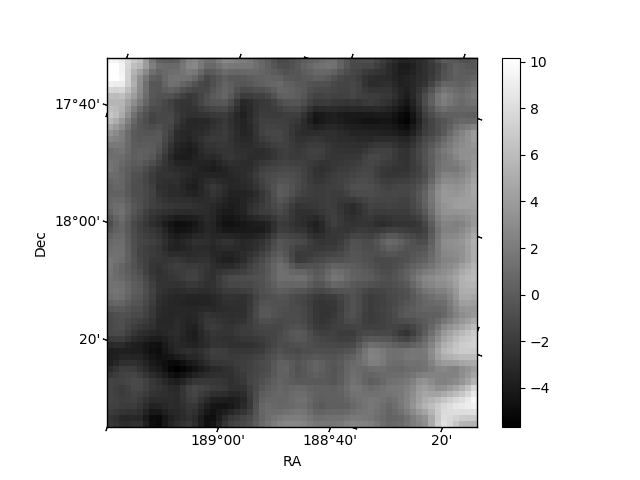
Histogram calculated using DETX and DETY for each event in the final _common_clean file
| Quadrant A | 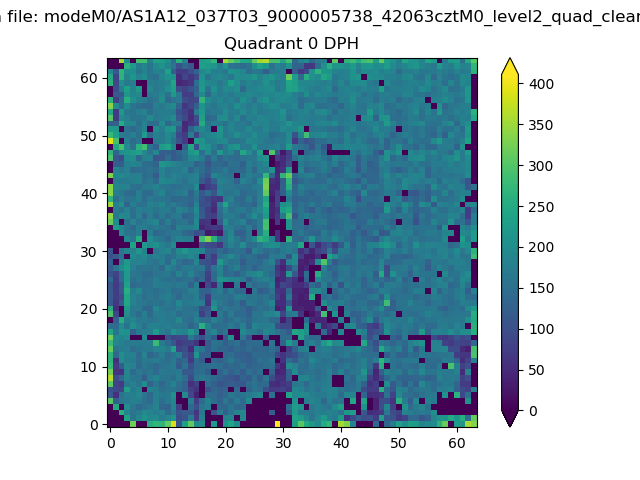 |
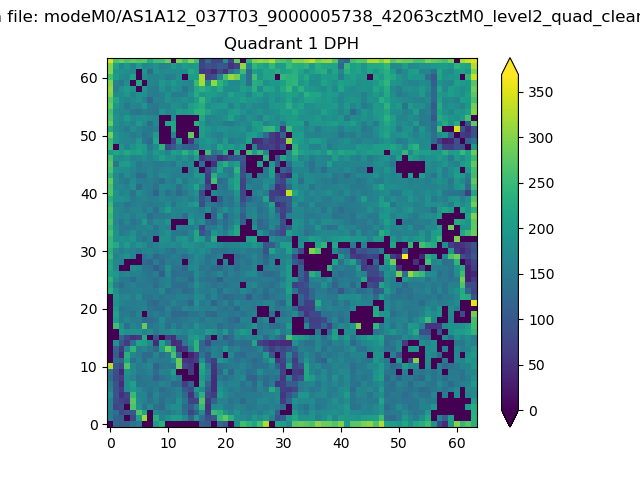 |
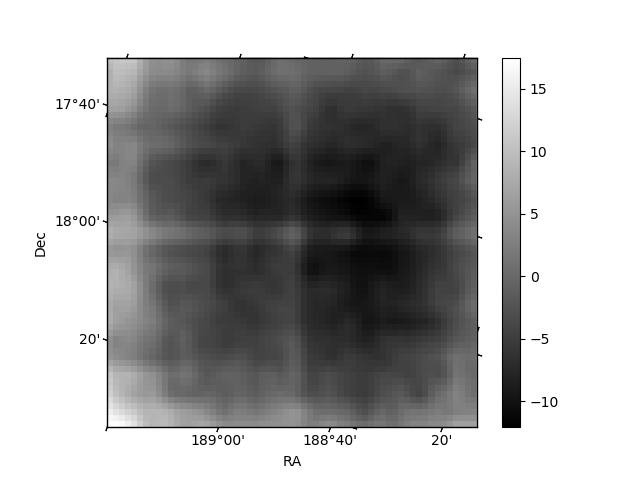
Quadrant B |
|---|---|---|---|
| Quadrant D | 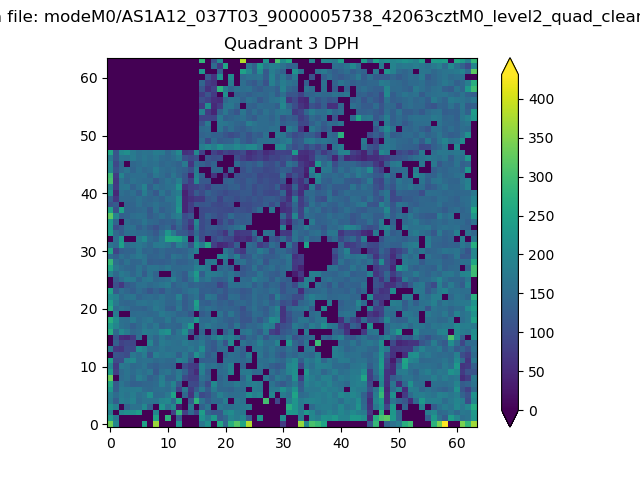 |
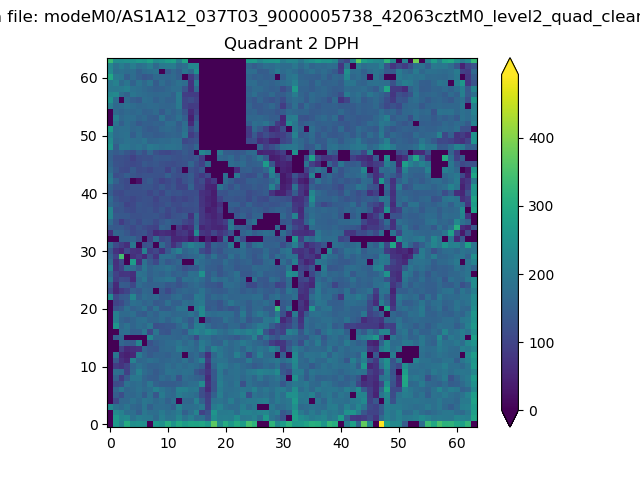 |
Quadrant C |
| Plot type | Count rate plots | Images |
|---|---|---|
| Comparison with Poisson distribution Blue bars denote a histogram of data divided into 1 sec bins. Red curve is a Poisson curve with rate = median count rate of data. |
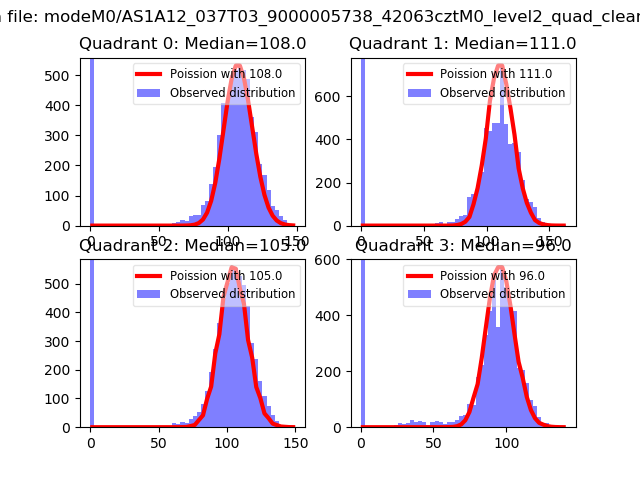 |
 |
| Quadrant-wise count rates Data is divided into 100 sec bins |
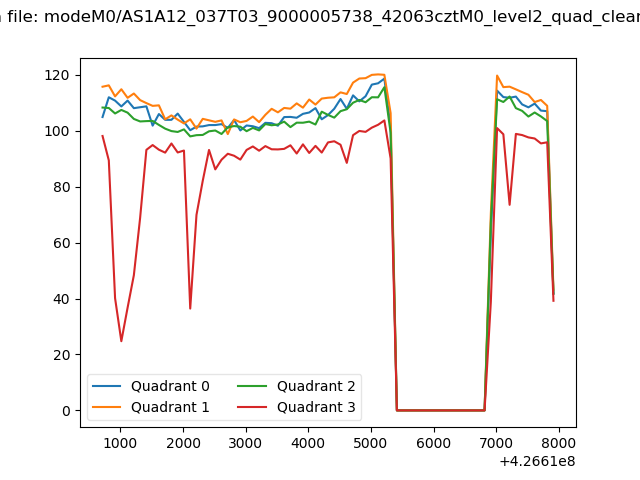 |
|
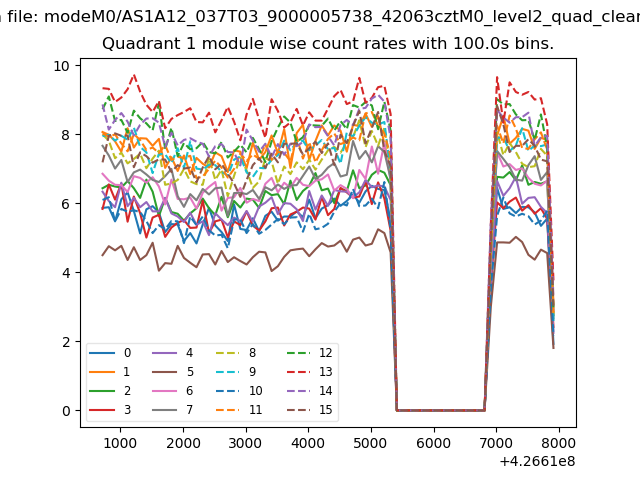
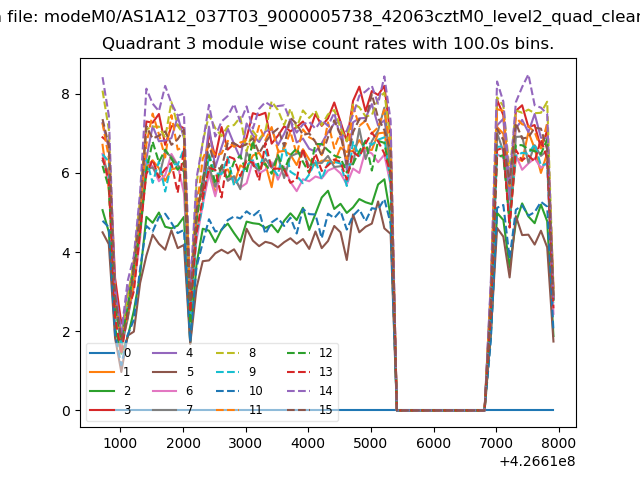
| Module-wise count rates for Quadrant A Data is divided into 100 sec bins |
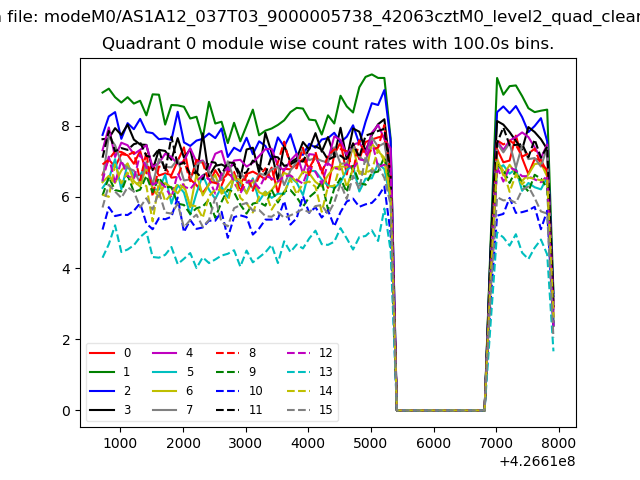 |
 |
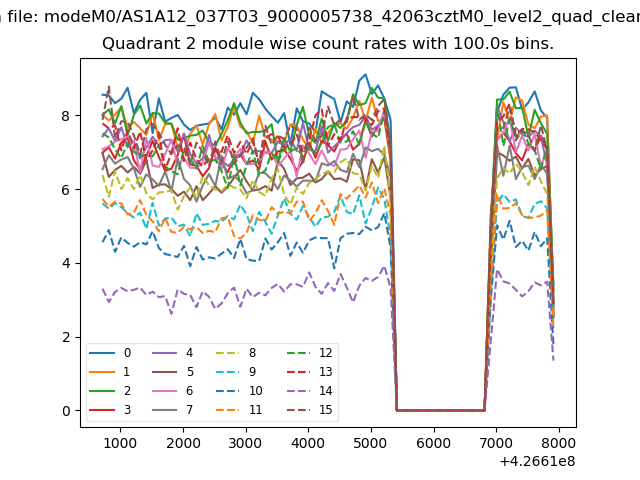
| Module-wise count rates for Quadrant B Data is divided into 100 sec bins |
 |
 |
| Module-wise count rates for Quadrant C Data is divided into 100 sec bins |
 |
 |
| Module-wise count rates for Quadrant D Data is divided into 100 sec bins |
 |
 |
| Parameter | Plot |
|---|---|
| CZT HV Monitor | 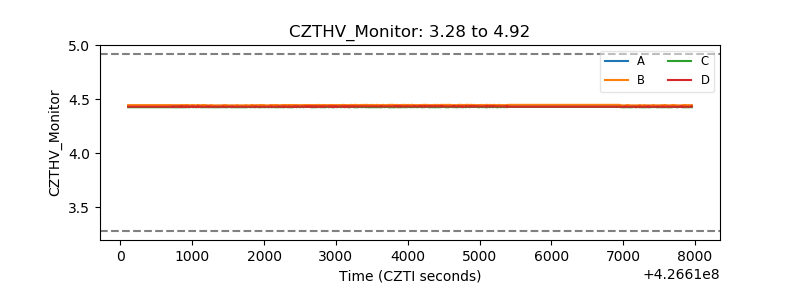 |
| D_VDD | 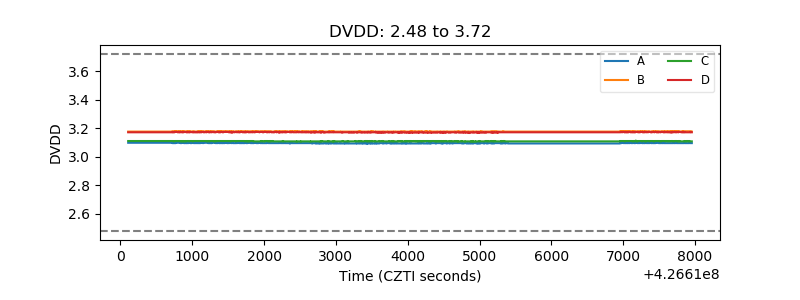 |
| Temperature 1 | 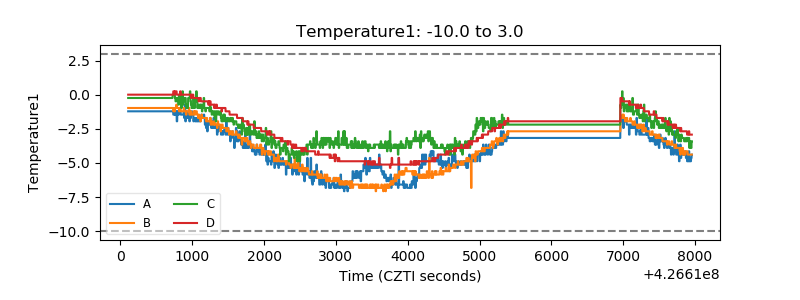 |
| Veto HV Monitor | 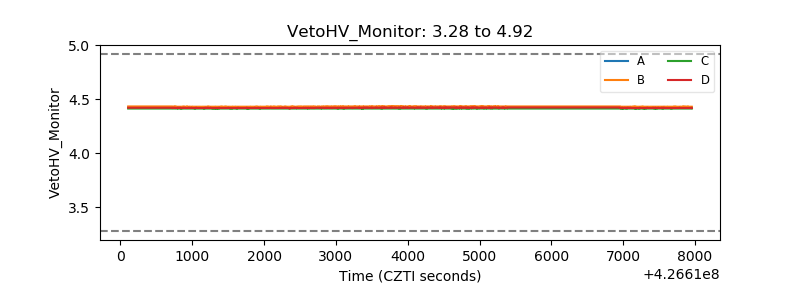 |
| Veto LLD | 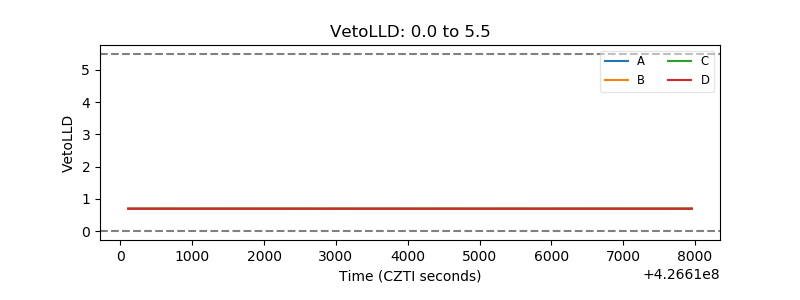 |
| Alpha Counter | 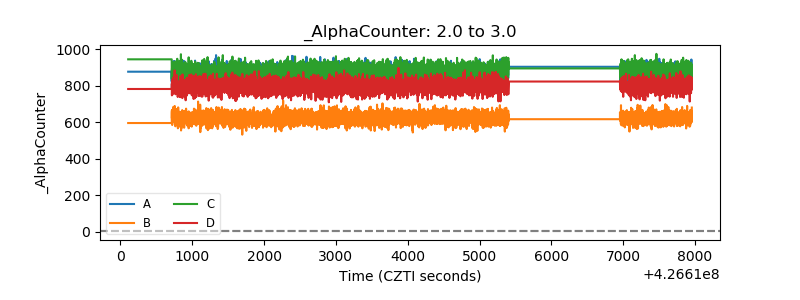 |
| _CPM_Rate |  |
| CZT Counter | 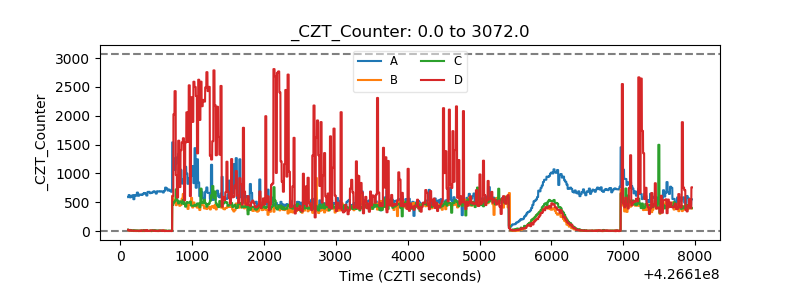 |
| +2.5 Volts monitor |  |
| +5 Volts monitor | 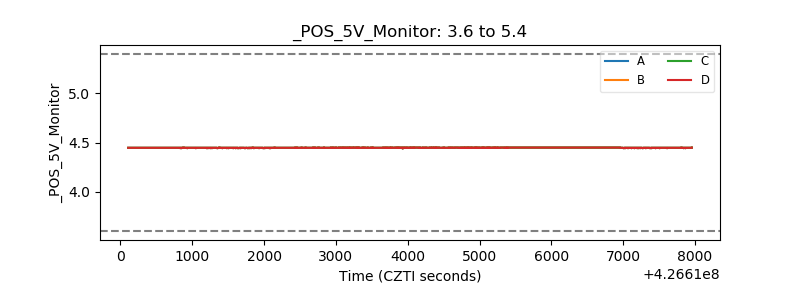 |
| _ROLL_ROT | 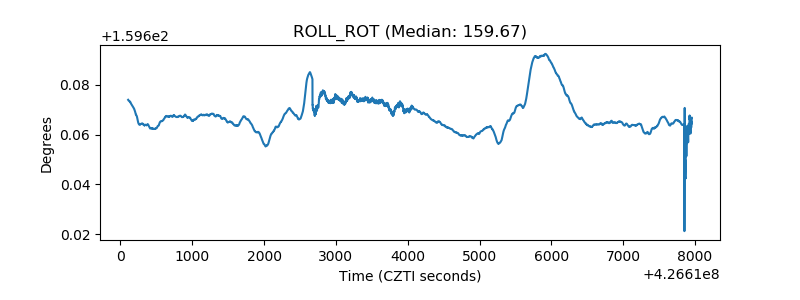 |
| _Roll_DEC | 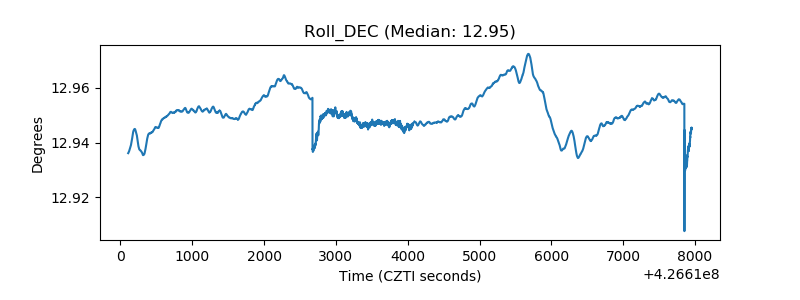 |
| _Roll_RA | 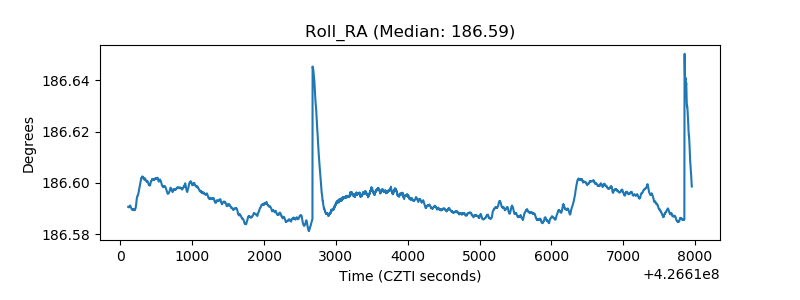 |
| Veto Counter | 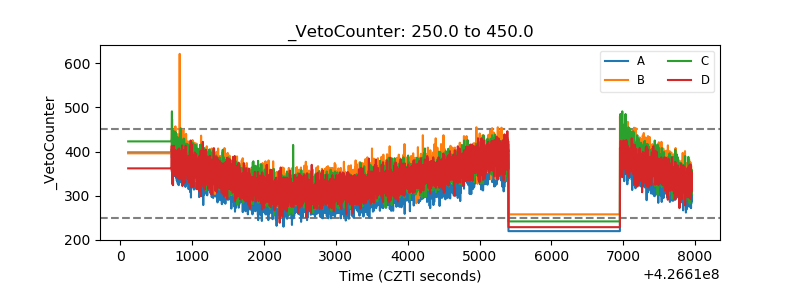 |