| Param | Original file | Final file |
|---|---|---|
| Filename | modeM0/AS1A12_037T03_9000005738_42064cztM0_level2.fits | modeM0/AS1A12_037T03_9000005738_42064cztM0_level2_quad_clean.evt |
| Size (bytes) | 318,767,040 | 88,096,320 |
| Size | 304.0 MB | 84.0 MB |
| Events in quadrant A | 3,200,922 | 589,621 |
| Events in quadrant B | 2,392,729 | 607,057 |
| Events in quadrant C | 2,483,631 | 576,574 |
| Events in quadrant D | 3,298,235 | 513,417 |
| Mode SS | |||
|---|---|---|---|
| Quadrant | BADHDUFLAG | Total packets | Discarded packets |
| A | 0 | 110 | 0 |
| B | 0 | 110 | 0 |
| C | 0 | 110 | 0 |
| D | 0 | 110 | 0 |
| Mode M9 | |||
|---|---|---|---|
| Quadrant | BADHDUFLAG | Total packets | Discarded packets |
| A | 0 | 27 | 0 |
| B | 0 | 28 | 0 |
| C | 0 | 28 | 0 |
| D | 0 | 28 | 0 |
| Mode M0 | |||
|---|---|---|---|
| Quadrant | BADHDUFLAG | Total packets | Discarded packets |
| A | 0 | 12933 | 2 |
| B | 0 | 11067 | 2 |
| C | 0 | 10956 | 2 |
| D | 0 | 13750 | 2 |
| Quadrant | Total seconds | Saturated seconds | Saturation percentage |
|---|---|---|---|
| A | 5443 | 17 | 0.312328% |
| B | 5442 | 17 | 0.312385% |
| C | 5442 | 4 | 0.073502% |
| D | 5442 | 238 | 4.373392% |
Noise dominated data is calculated using 1-second bins in cleaned event files. If a bin has >2000 counts, and if more than 50% of those come from <1% of pixels, then it is considered to be noise-dominated and hence unusable.
| Quadrant | # 1 sec bins | Bins with >0 counts | Bins with >2000 counts | High rate bins dominated by noise | Noise dominated (total time) | Noise dominated (detector-on time) | Marked lightcurve |
|---|---|---|---|---|---|---|---|
| A | 7145 | 5444 | 11 | 11 | 0.15% | 0.20% | 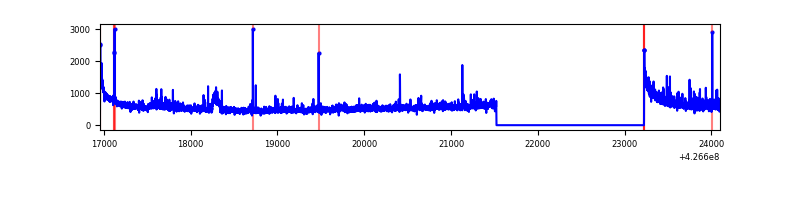 |
| B | 7144 | 5443 | 8 | 8 | 0.11% | 0.15% | 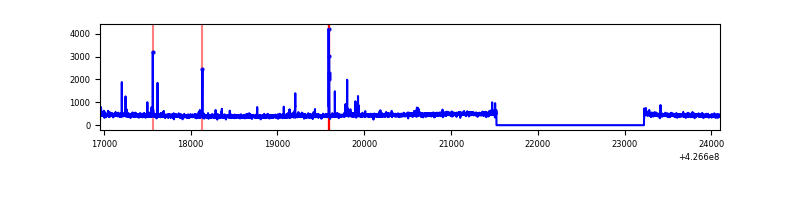 |
| C | 7144 | 5443 | 0 | 0 | 0.00% | 0.00% | 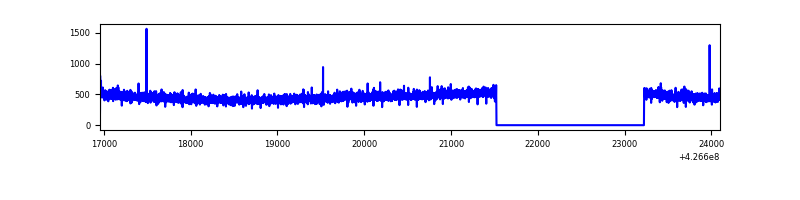 |
| D | 7144 | 5443 | 192 | 192 | 2.69% | 3.53% | 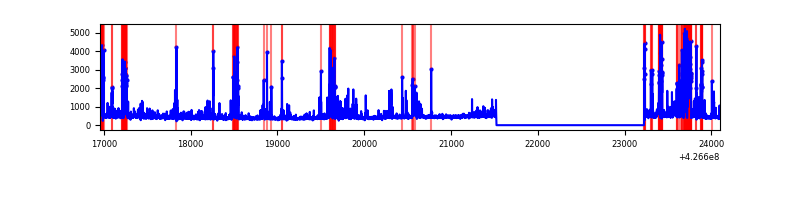 |
Top three noisy pixels from each quadrant. If the there are fewer than three noisy pixels in the level2.evt file, extra rows are filled as -1
| Pixel properties | Quadrant properties | ||||||
|---|---|---|---|---|---|---|---|
| Quadrant | DetID | PixID | Counts | Sigma | Mean | Median | Sigma |
| A | 10 | 83 | 597089 | 4898.4 | 590 | 578 | 121.8 |
| A | 15 | 222 | 257322 | 2108.32 | 590 | 578 | 121.8 |
| A | 15 | 223 | 41748 | 338.08 | 590 | 578 | 121.8 |
| B | 5 | 255 | 34729 | 296.59 | 589 | 573 | 115.2 |
| B | 3 | 112 | 28146 | 239.43 | 589 | 573 | 115.2 |
| B | 12 | 111 | 14481 | 120.77 | 589 | 573 | 115.2 |
| C | 15 | 214 | 226198 | 1668.77 | 576 | 580 | 135.2 |
| C | 3 | 233 | 4587 | 29.64 | 576 | 580 | 135.2 |
| C | 7 | 220 | 4533 | 29.24 | 576 | 580 | 135.2 |
| D | 1 | 52 | 513199 | 3701.16 | 561 | 543 | 138.5 |
| D | 12 | 6 | 192344 | 1384.72 | 561 | 543 | 138.5 |
| D | 13 | 249 | 175890 | 1265.93 | 561 | 543 | 138.5 |
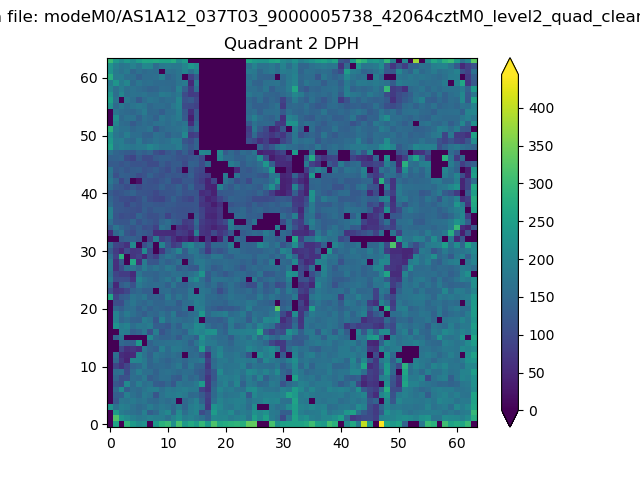
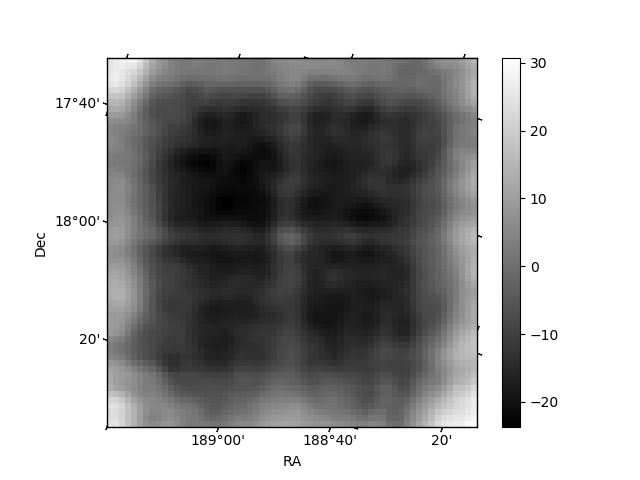
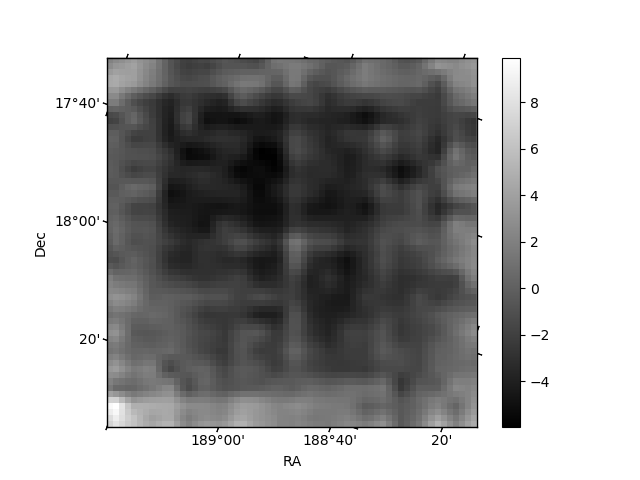
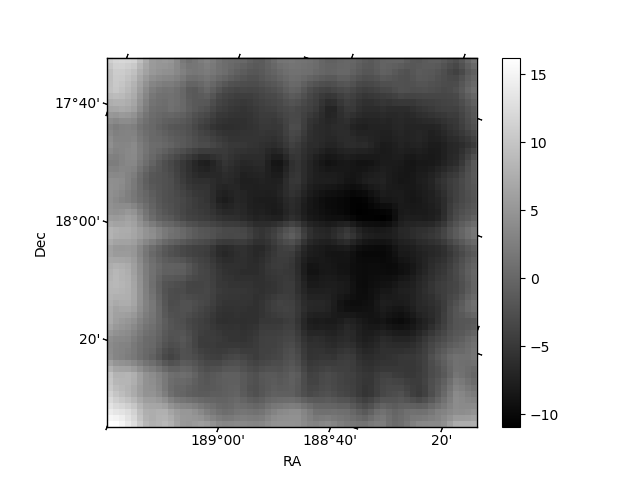
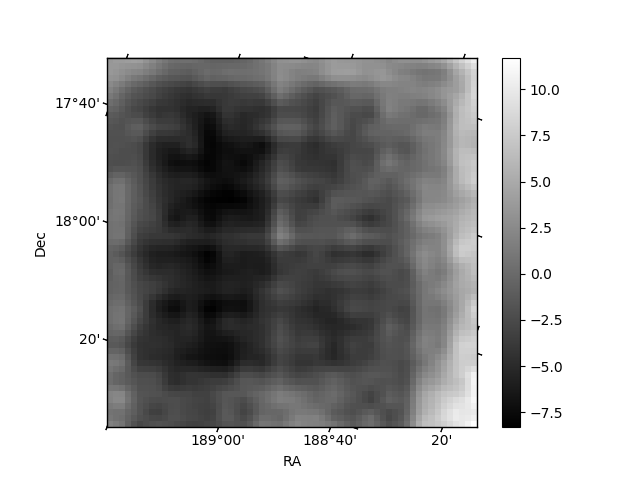
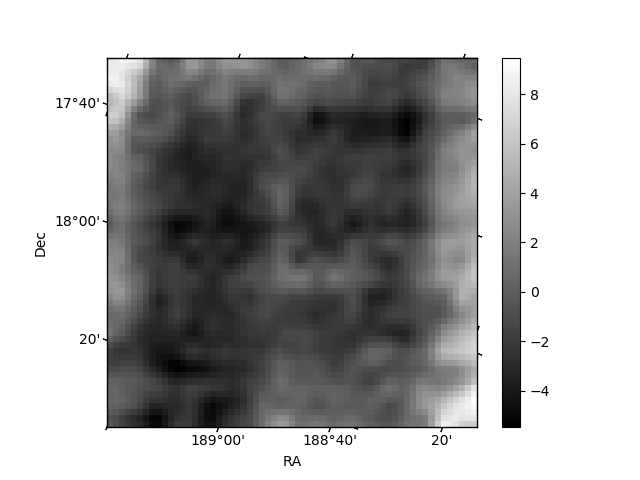
Histogram calculated using DETX and DETY for each event in the final _common_clean file
| Quadrant A | 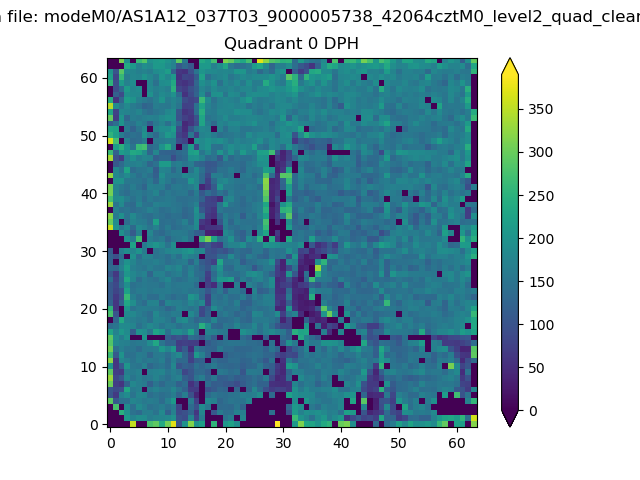 |
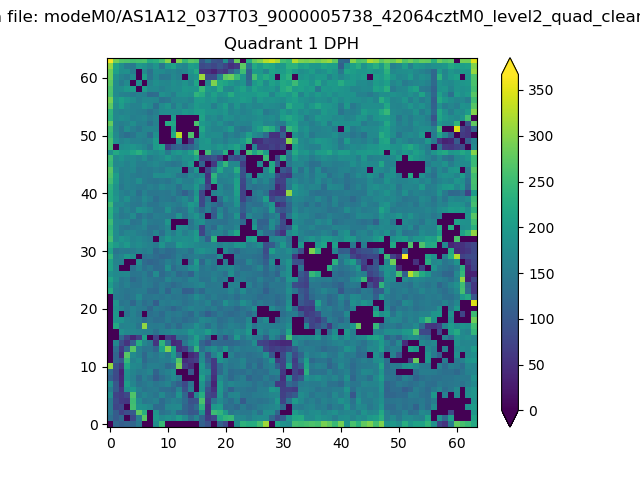 |
Quadrant B |
|---|---|---|---|
| Quadrant D | 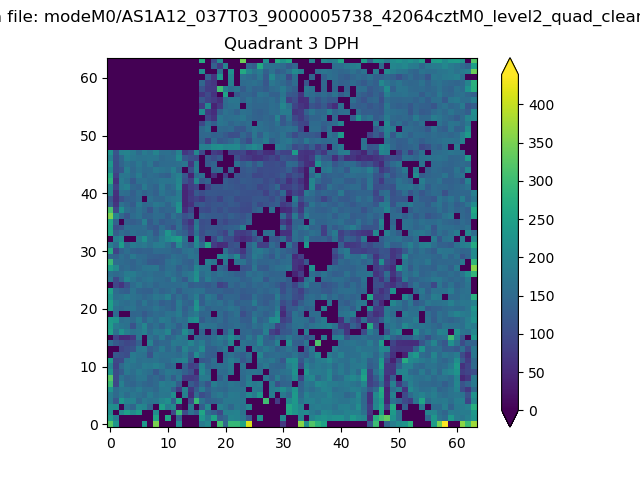 |
 |
Quadrant C |
| Plot type | Count rate plots | Images |
|---|---|---|
| Comparison with Poisson distribution Blue bars denote a histogram of data divided into 1 sec bins. Red curve is a Poisson curve with rate = median count rate of data. |
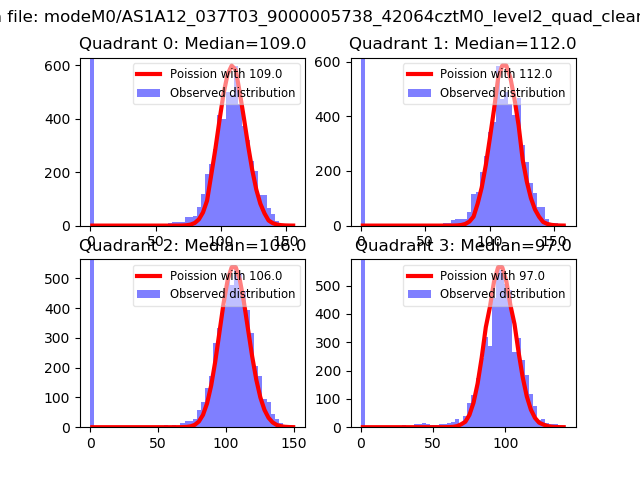 |
 |
| Quadrant-wise count rates Data is divided into 100 sec bins |
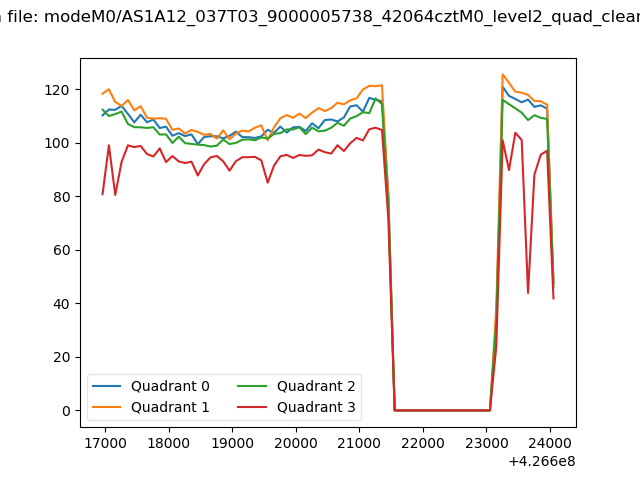 |
|
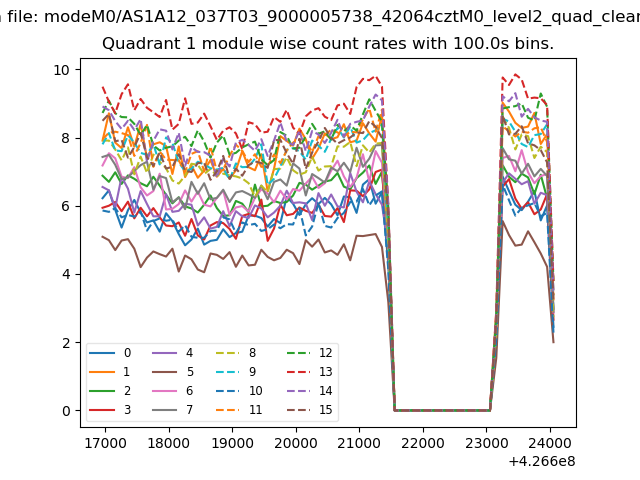
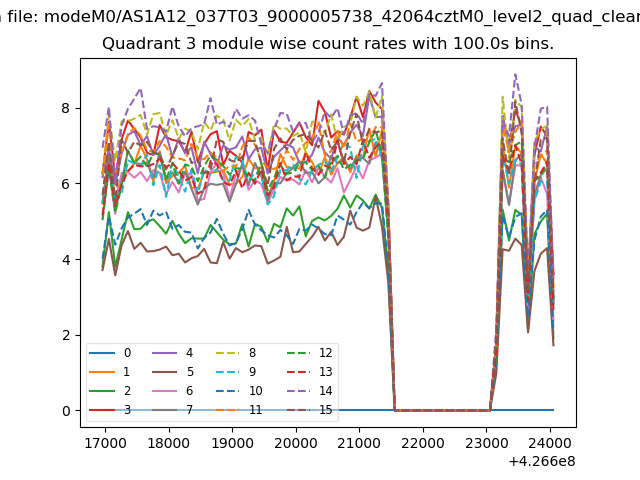
| Module-wise count rates for Quadrant A Data is divided into 100 sec bins |
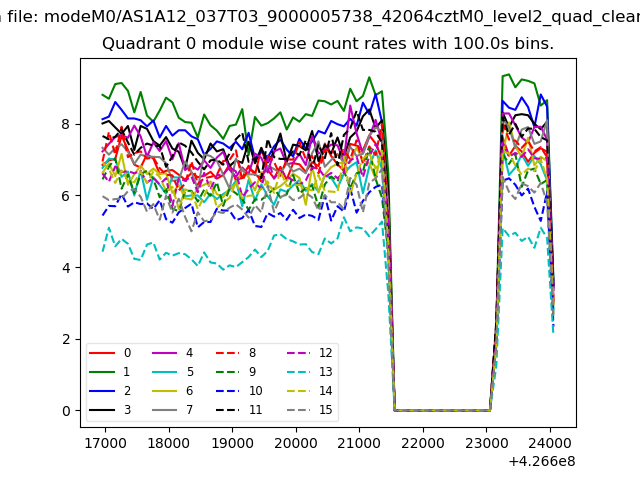 |
 |
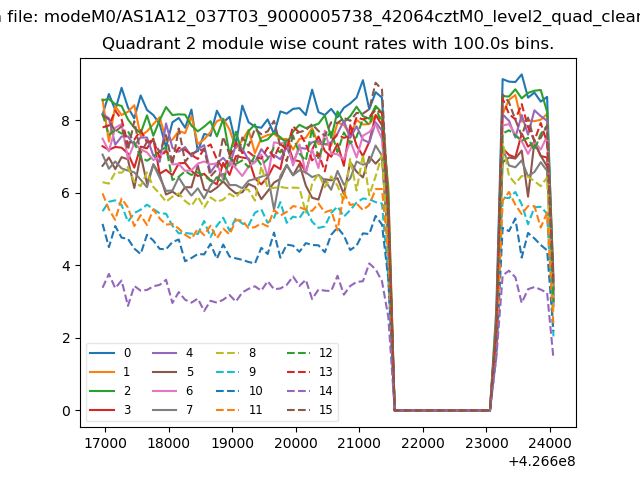
| Module-wise count rates for Quadrant B Data is divided into 100 sec bins |
 |
 |
| Module-wise count rates for Quadrant C Data is divided into 100 sec bins |
 |
 |
| Module-wise count rates for Quadrant D Data is divided into 100 sec bins |
 |
 |
| Parameter | Plot |
|---|---|
| CZT HV Monitor | 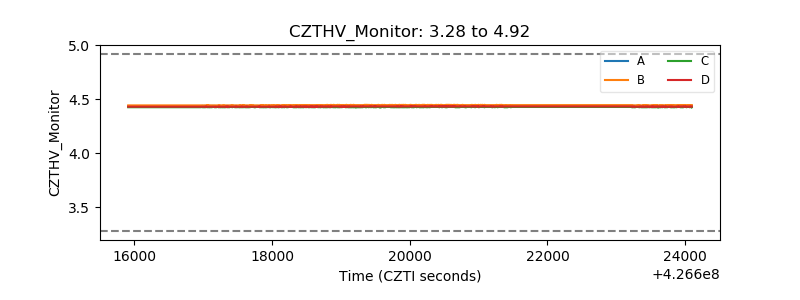 |
| D_VDD | 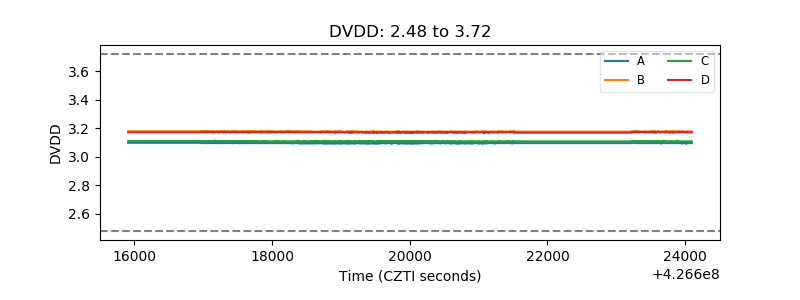 |
| Temperature 1 | 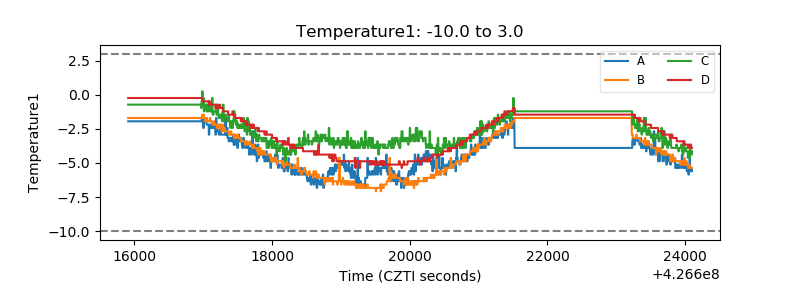 |
| Veto HV Monitor | 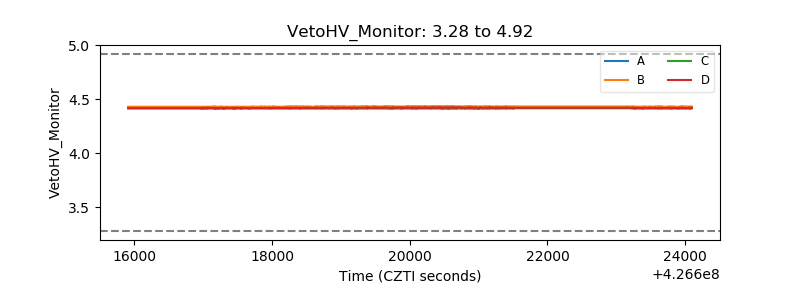 |
| Veto LLD | 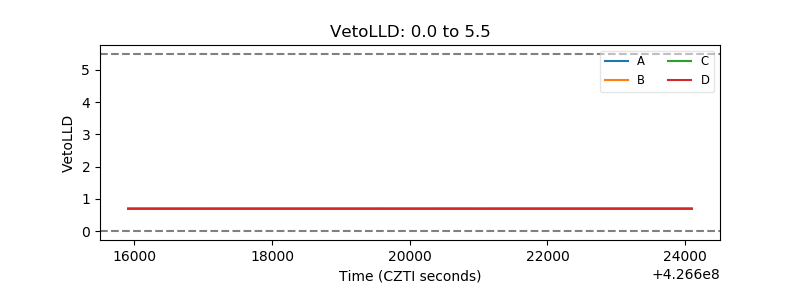 |
| Alpha Counter | 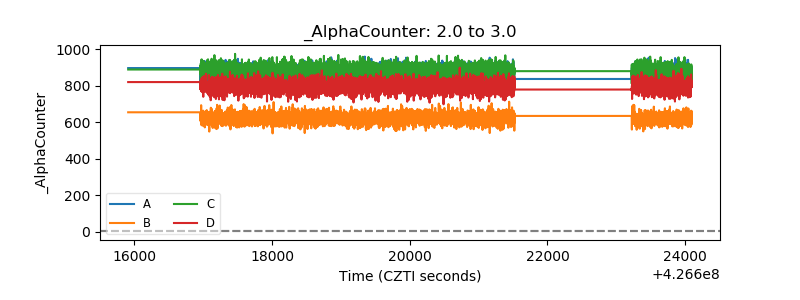 |
| _CPM_Rate | 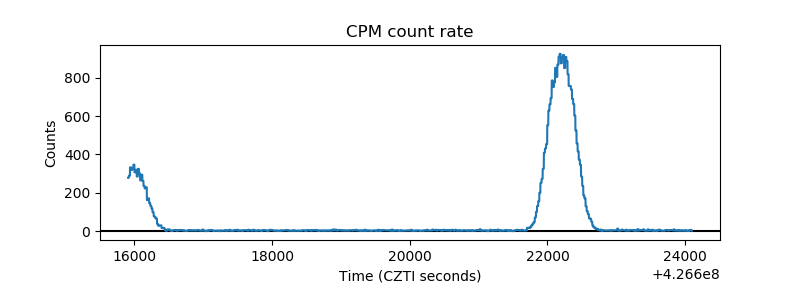 |
| CZT Counter | 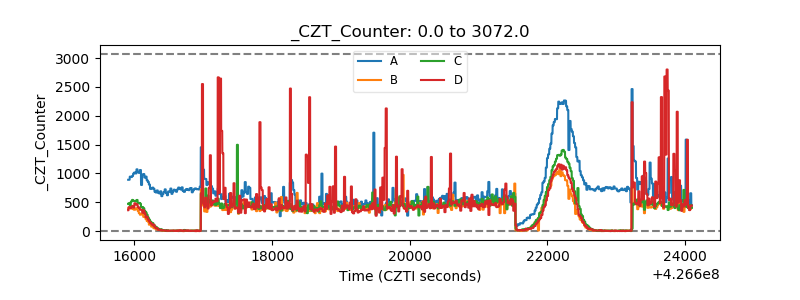 |
| +2.5 Volts monitor |  |
| +5 Volts monitor |  |
| _ROLL_ROT | 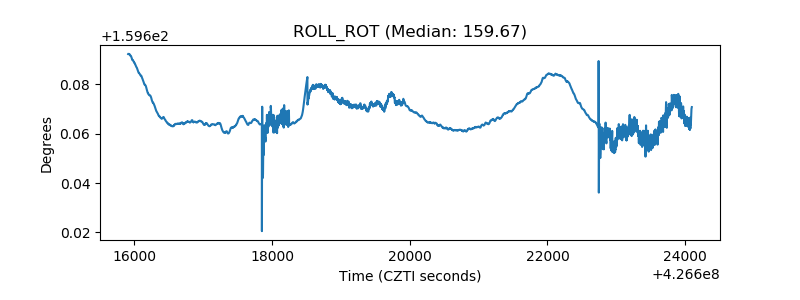 |
| _Roll_DEC |  |
| _Roll_RA | 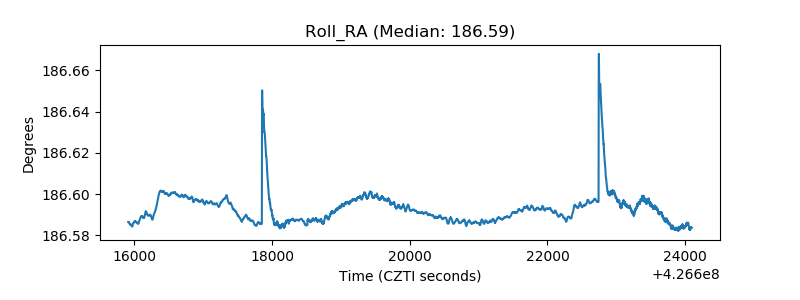 |
| Veto Counter | 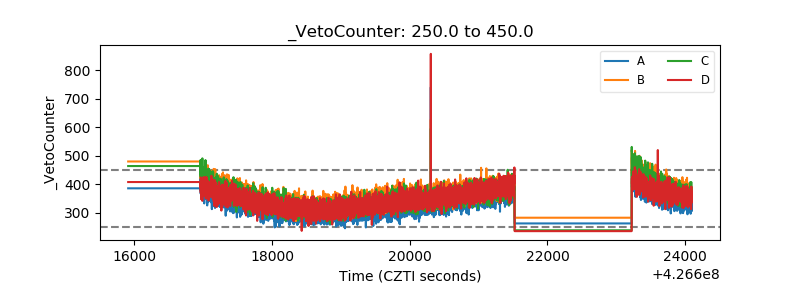 |