| Param | Original file | Final file |
|---|---|---|
| Filename | modeM0/AS1A12_037T03_9000005738_42066cztM0_level2.fits | modeM0/AS1A12_037T03_9000005738_42066cztM0_level2_quad_clean.evt |
| Size (bytes) | 330,183,360 | 87,814,080 |
| Size | 314.9 MB | 83.7 MB |
| Events in quadrant A | 3,267,039 | 589,393 |
| Events in quadrant B | 2,390,390 | 611,302 |
| Events in quadrant C | 2,452,920 | 578,084 |
| Events in quadrant D | 3,698,035 | 508,276 |
| Mode SS | |||
|---|---|---|---|
| Quadrant | BADHDUFLAG | Total packets | Discarded packets |
| A | 0 | 108 | 0 |
| B | 0 | 108 | 0 |
| C | 0 | 108 | 0 |
| D | 0 | 108 | 0 |
| Mode M9 | |||
|---|---|---|---|
| Quadrant | BADHDUFLAG | Total packets | Discarded packets |
| A | 0 | 32 | 0 |
| B | 0 | 33 | 0 |
| C | 0 | 33 | 0 |
| D | 0 | 33 | 0 |
| Mode M0 | |||
|---|---|---|---|
| Quadrant | BADHDUFLAG | Total packets | Discarded packets |
| A | 0 | 12989 | 2 |
| B | 0 | 10813 | 2 |
| C | 0 | 10690 | 2 |
| D | 0 | 14838 | 2 |
| Quadrant | Total seconds | Saturated seconds | Saturation percentage |
|---|---|---|---|
| A | 5312 | 31 | 0.583584% |
| B | 5312 | 9 | 0.169428% |
| C | 5312 | 3 | 0.056476% |
| D | 5312 | 308 | 5.798193% |
Noise dominated data is calculated using 1-second bins in cleaned event files. If a bin has >2000 counts, and if more than 50% of those come from <1% of pixels, then it is considered to be noise-dominated and hence unusable.
| Quadrant | # 1 sec bins | Bins with >0 counts | Bins with >2000 counts | High rate bins dominated by noise | Noise dominated (total time) | Noise dominated (detector-on time) | Marked lightcurve |
|---|---|---|---|---|---|---|---|
| A | 7135 | 5313 | 15 | 15 | 0.21% | 0.28% | 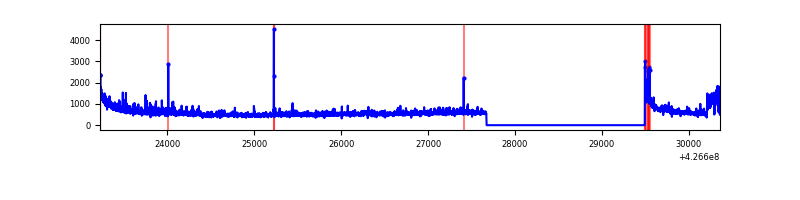 |
| B | 7135 | 5313 | 5 | 5 | 0.07% | 0.09% | 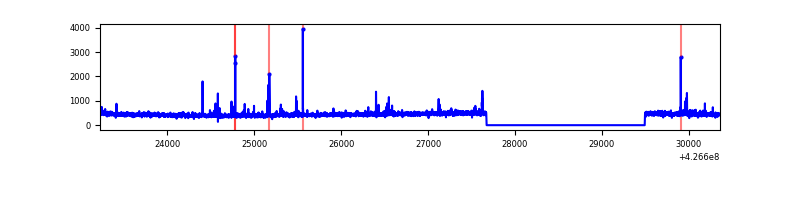 |
| C | 7135 | 5313 | 0 | 0 | 0.00% | 0.00% | 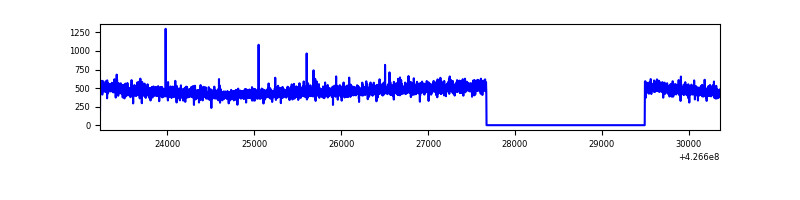 |
| D | 7135 | 5313 | 249 | 249 | 3.49% | 4.69% | 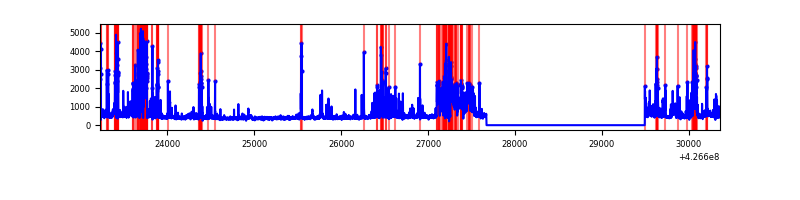 |
Top three noisy pixels from each quadrant. If the there are fewer than three noisy pixels in the level2.evt file, extra rows are filled as -1
| Pixel properties | Quadrant properties | ||||||
|---|---|---|---|---|---|---|---|
| Quadrant | DetID | PixID | Counts | Sigma | Mean | Median | Sigma |
| A | 10 | 83 | 558188 | 4669.53 | 585 | 575 | 119.4 |
| A | 15 | 222 | 255806 | 2137.34 | 585 | 575 | 119.4 |
| A | 15 | 223 | 146204 | 1219.52 | 585 | 575 | 119.4 |
| B | 3 | 112 | 70247 | 610.22 | 586 | 570 | 114.2 |
| B | 12 | 111 | 14425 | 121.34 | 586 | 570 | 114.2 |
| B | 11 | 111 | 13055 | 109.34 | 586 | 570 | 114.2 |
| C | 15 | 214 | 219193 | 1617.44 | 571 | 575 | 135.2 |
| C | 15 | 111 | 4941 | 32.3 | 571 | 575 | 135.2 |
| C | 13 | 61 | 3780 | 23.71 | 571 | 575 | 135.2 |
| D | 1 | 52 | 903978 | 6552.5 | 555 | 538 | 137.9 |
| D | 13 | 249 | 209219 | 1513.53 | 555 | 538 | 137.9 |
| D | 12 | 218 | 172239 | 1245.32 | 555 | 538 | 137.9 |
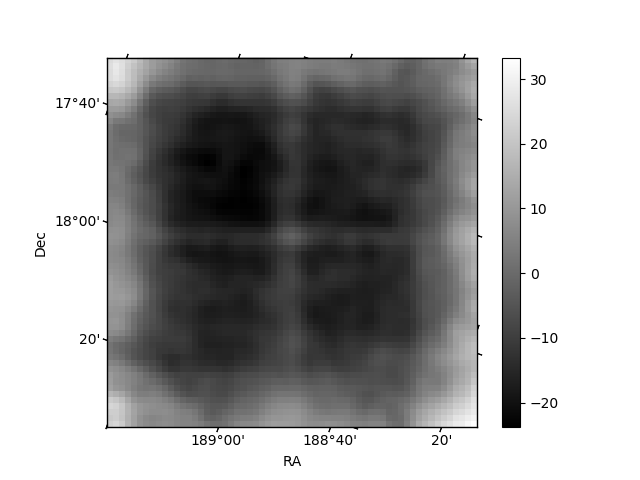
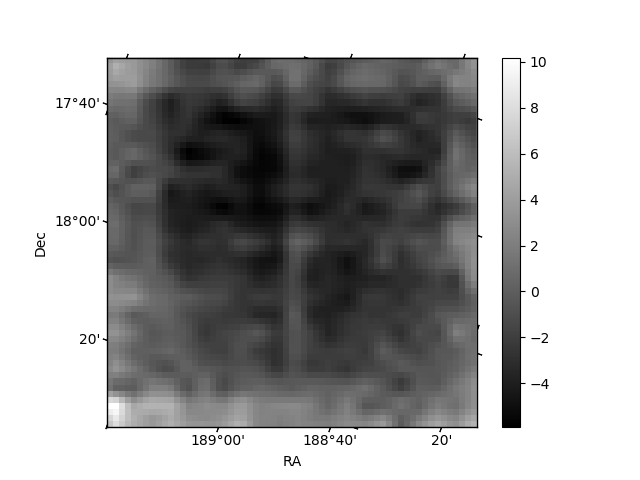
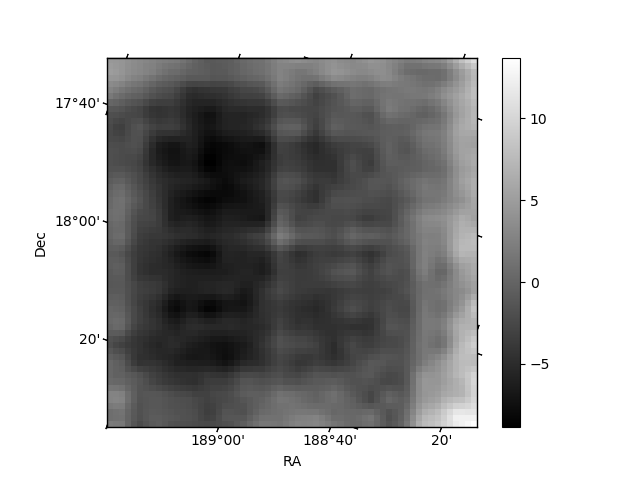
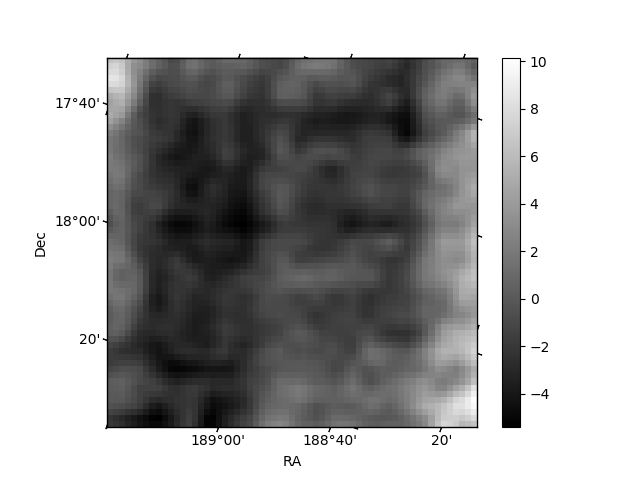
Histogram calculated using DETX and DETY for each event in the final _common_clean file
| Quadrant A | 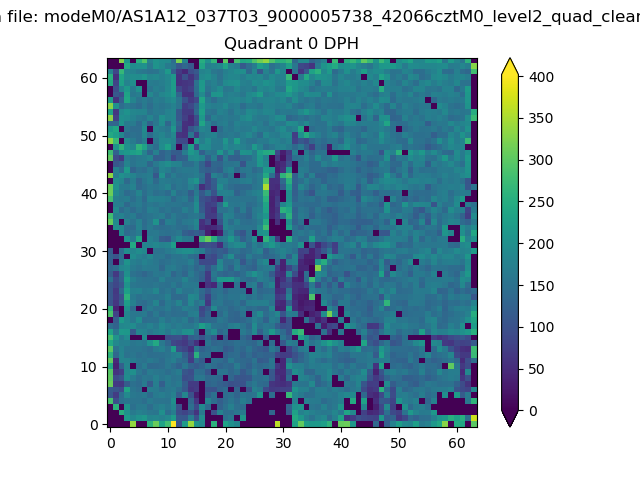 |
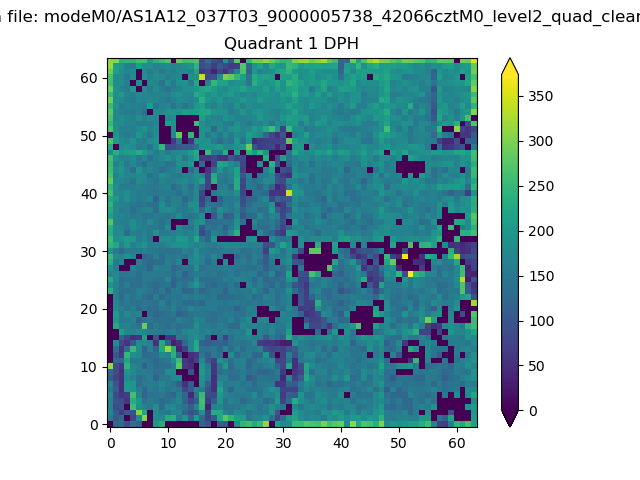 |
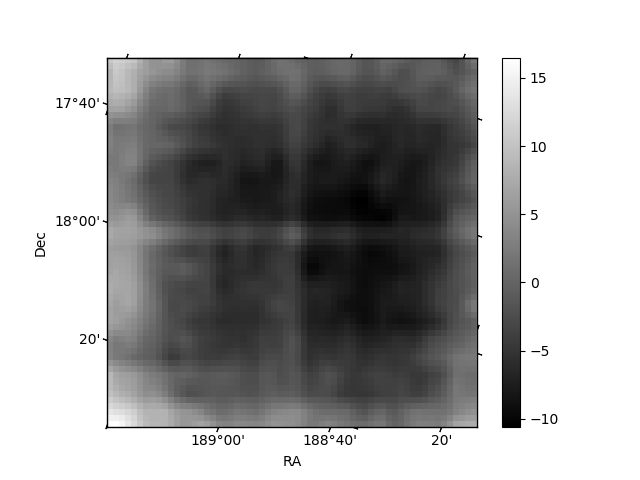
Quadrant B |
|---|---|---|---|
| Quadrant D | 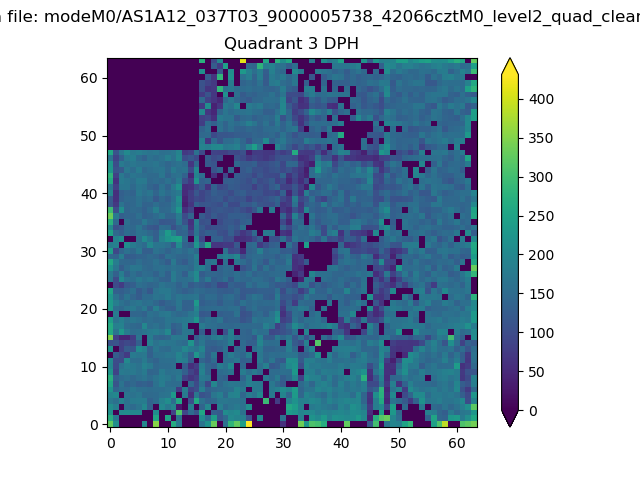 |
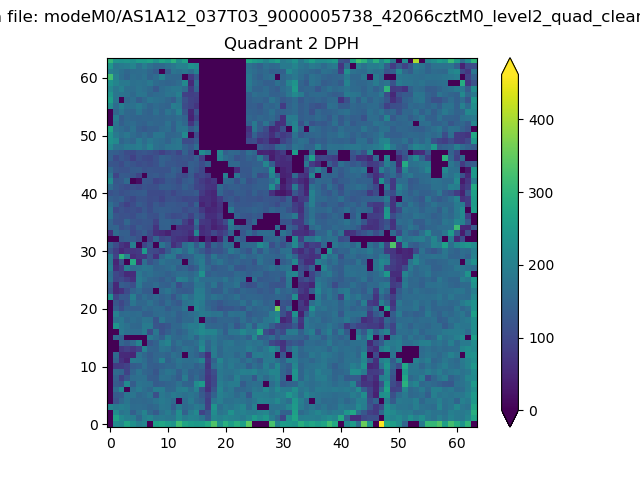 |
Quadrant C |
| Plot type | Count rate plots | Images |
|---|---|---|
| Comparison with Poisson distribution Blue bars denote a histogram of data divided into 1 sec bins. Red curve is a Poisson curve with rate = median count rate of data. |
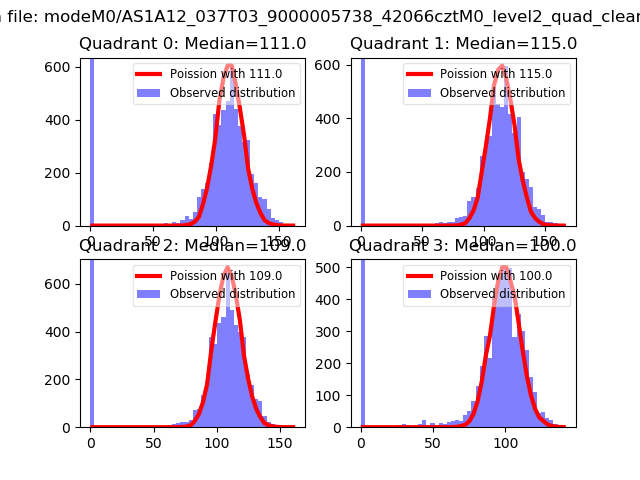 |
 |
| Quadrant-wise count rates Data is divided into 100 sec bins |
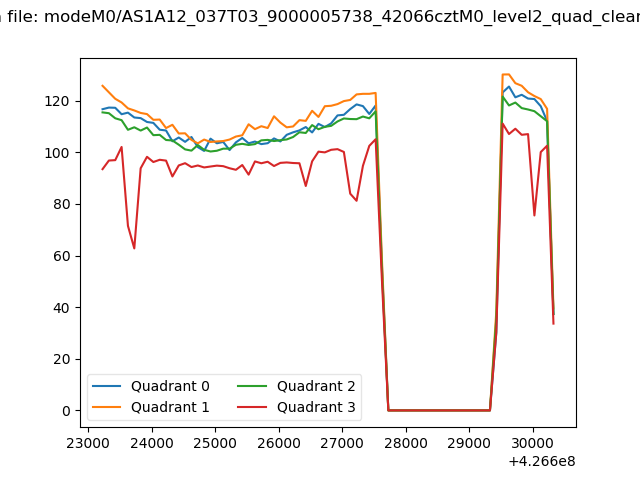 |
|
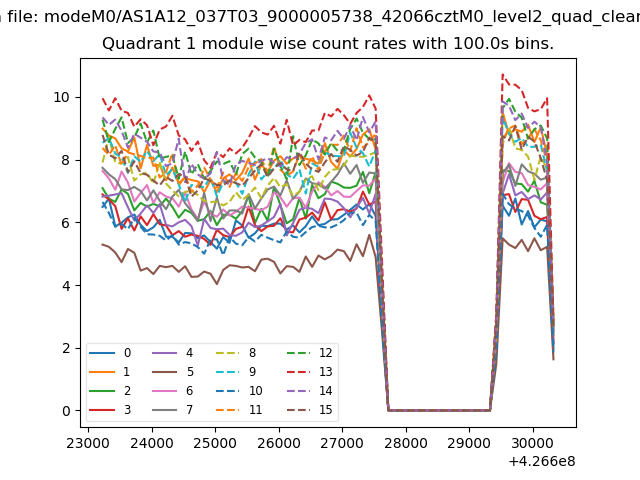
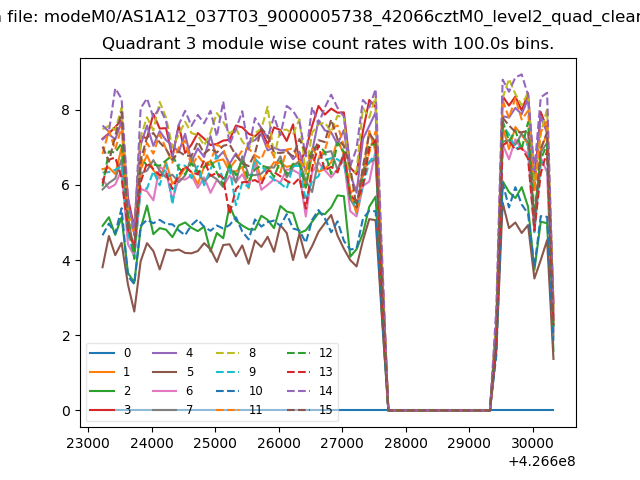
| Module-wise count rates for Quadrant A Data is divided into 100 sec bins |
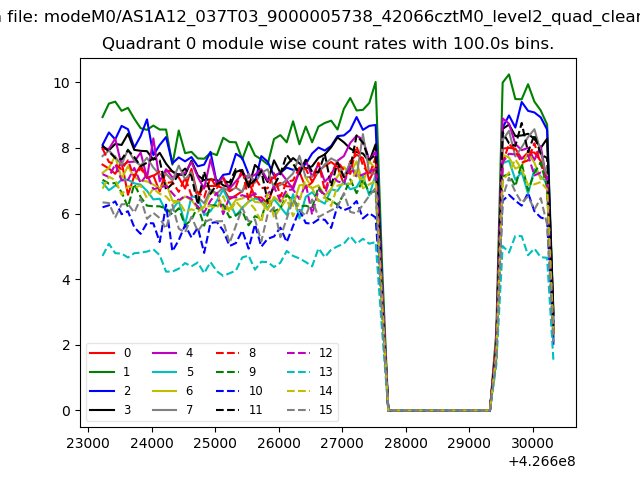 |
 |
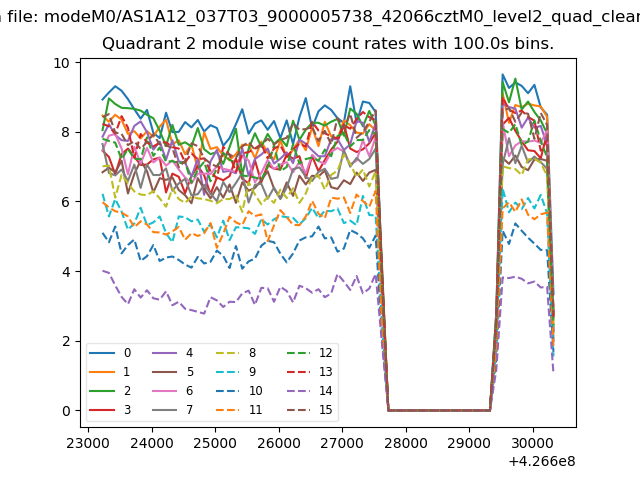
| Module-wise count rates for Quadrant B Data is divided into 100 sec bins |
 |
 |
| Module-wise count rates for Quadrant C Data is divided into 100 sec bins |
 |
 |
| Module-wise count rates for Quadrant D Data is divided into 100 sec bins |
 |
 |
| Parameter | Plot |
|---|---|
| CZT HV Monitor |  |
| D_VDD | 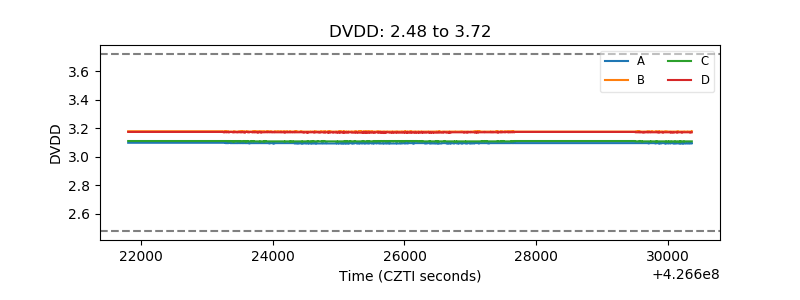 |
| Temperature 1 | 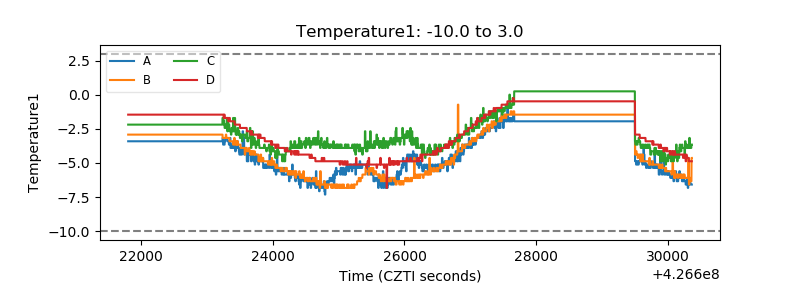 |
| Veto HV Monitor | 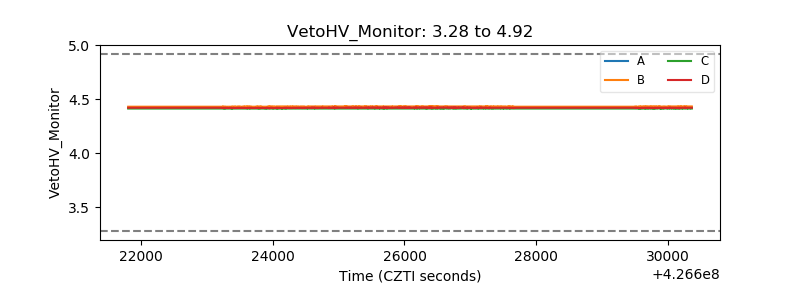 |
| Veto LLD | 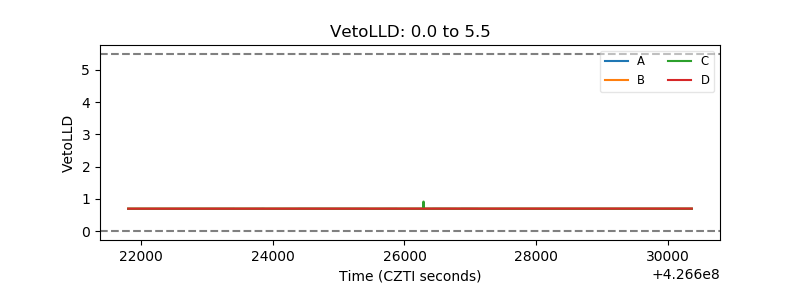 |
| Alpha Counter | 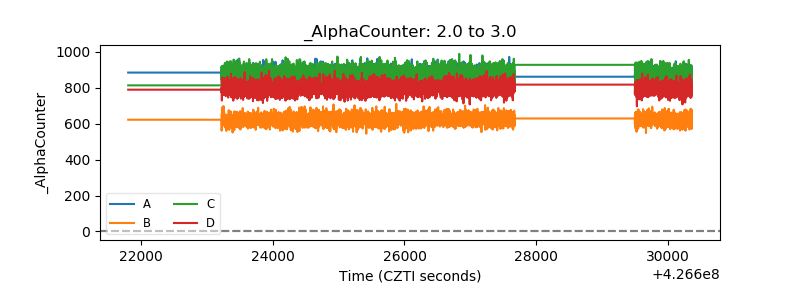 |
| _CPM_Rate |  |
| CZT Counter | 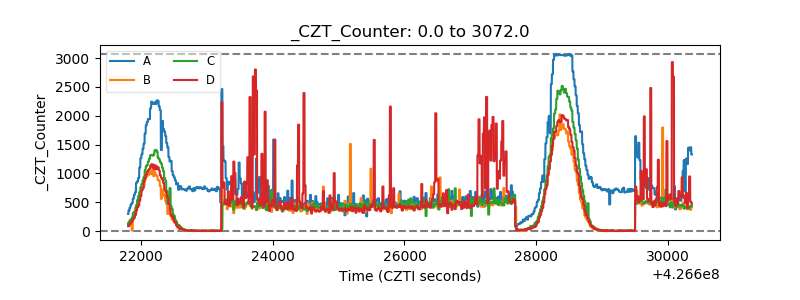 |
| +2.5 Volts monitor |  |
| +5 Volts monitor | 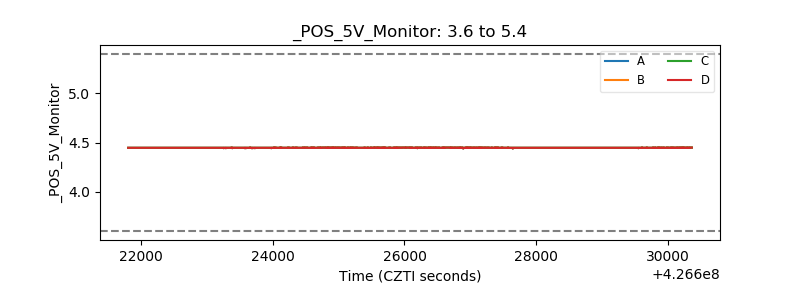 |
| _ROLL_ROT | 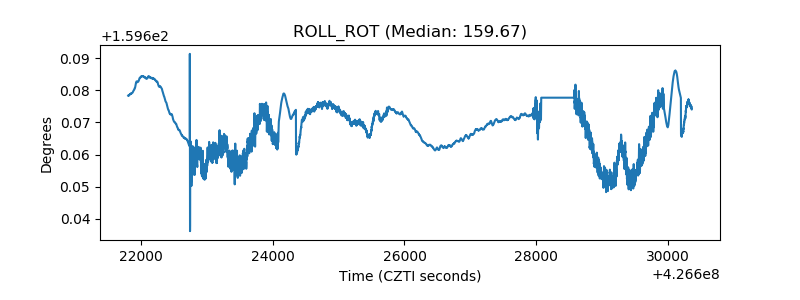 |
| _Roll_DEC | 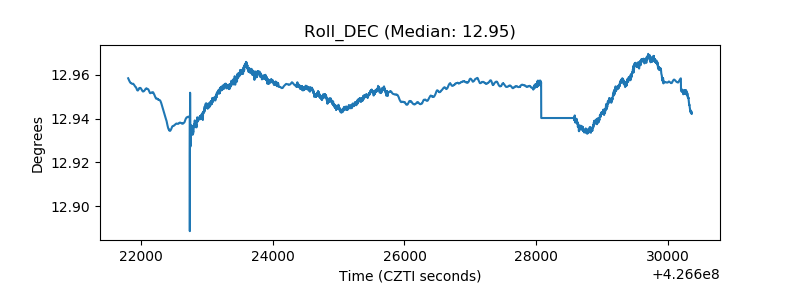 |
| _Roll_RA | 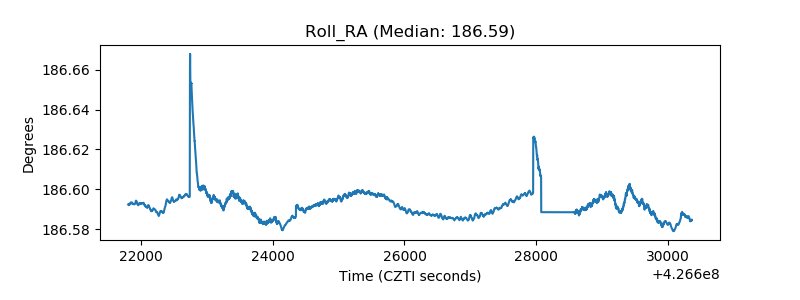 |
| Veto Counter | 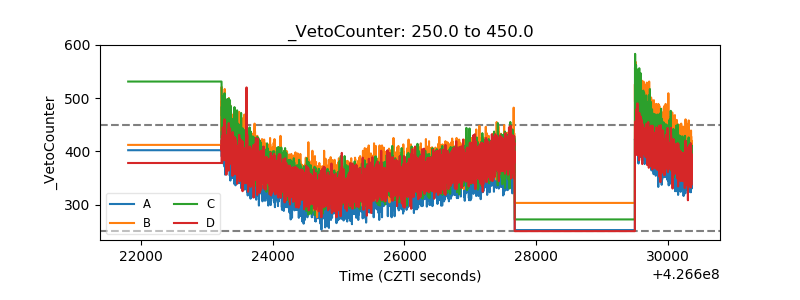 |