| Param | Original file | Final file |
|---|---|---|
| Filename | modeM0/AS1A12_037T03_9000005738_42067cztM0_level2.fits | modeM0/AS1A12_037T03_9000005738_42067cztM0_level2_quad_clean.evt |
| Size (bytes) | 345,012,480 | 85,121,280 |
| Size | 329.0 MB | 81.2 MB |
| Events in quadrant A | 4,641,511 | 532,945 |
| Events in quadrant B | 2,334,169 | 605,363 |
| Events in quadrant C | 2,395,479 | 572,094 |
| Events in quadrant D | 3,006,044 | 512,458 |
| Mode SS | |||
|---|---|---|---|
| Quadrant | BADHDUFLAG | Total packets | Discarded packets |
| A | 0 | 104 | 0 |
| B | 0 | 104 | 0 |
| C | 0 | 104 | 0 |
| D | 0 | 104 | 0 |
| Mode M9 | |||
|---|---|---|---|
| Quadrant | BADHDUFLAG | Total packets | Discarded packets |
| A | 0 | 28 | 0 |
| B | 0 | 28 | 0 |
| C | 0 | 29 | 0 |
| D | 0 | 29 | 0 |
| Mode M0 | |||
|---|---|---|---|
| Quadrant | BADHDUFLAG | Total packets | Discarded packets |
| A | 0 | 17082 | 2 |
| B | 0 | 10285 | 2 |
| C | 0 | 10163 | 3 |
| D | 0 | 12411 | 2 |
| Quadrant | Total seconds | Saturated seconds | Saturation percentage |
|---|---|---|---|
| A | 5056 | 576 | 11.392405% |
| B | 5056 | 9 | 0.178006% |
| C | 5055 | 3 | 0.059347% |
| D | 5055 | 137 | 2.710188% |
Noise dominated data is calculated using 1-second bins in cleaned event files. If a bin has >2000 counts, and if more than 50% of those come from <1% of pixels, then it is considered to be noise-dominated and hence unusable.
| Quadrant | # 1 sec bins | Bins with >0 counts | Bins with >2000 counts | High rate bins dominated by noise | Noise dominated (total time) | Noise dominated (detector-on time) | Marked lightcurve |
|---|---|---|---|---|---|---|---|
| A | 7030 | 5057 | 324 | 324 | 4.61% | 6.41% | 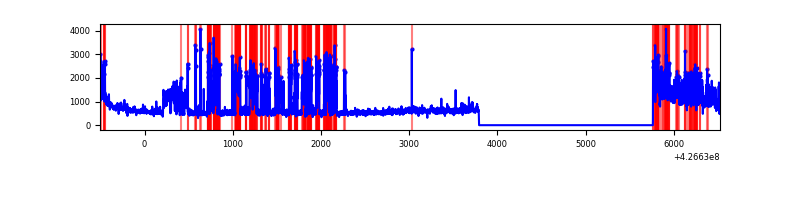 |
| B | 7030 | 5057 | 7 | 7 | 0.10% | 0.14% | 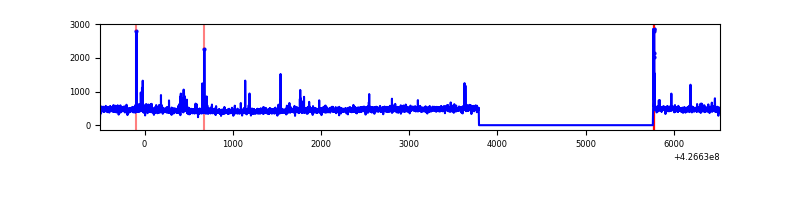 |
| C | 7029 | 5056 | 0 | 0 | 0.00% | 0.00% | 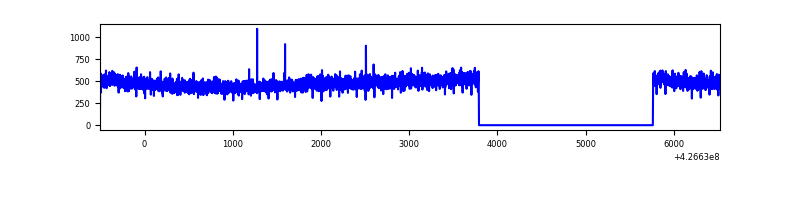 |
| D | 7029 | 5056 | 114 | 114 | 1.62% | 2.25% | 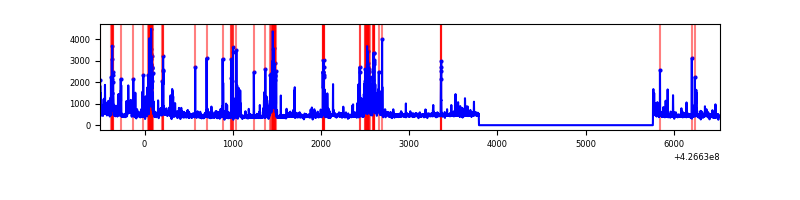 |
Top three noisy pixels from each quadrant. If the there are fewer than three noisy pixels in the level2.evt file, extra rows are filled as -1
| Pixel properties | Quadrant properties | ||||||
|---|---|---|---|---|---|---|---|
| Quadrant | DetID | PixID | Counts | Sigma | Mean | Median | Sigma |
| A | 15 | 223 | 1781567 | 15826.36 | 552 | 543 | 112.5 |
| A | 10 | 83 | 505024 | 4482.87 | 552 | 543 | 112.5 |
| A | 15 | 222 | 177966 | 1576.59 | 552 | 543 | 112.5 |
| B | 3 | 112 | 59558 | 532.17 | 574 | 558 | 110.9 |
| B | 12 | 111 | 13828 | 119.69 | 574 | 558 | 110.9 |
| B | 11 | 111 | 12656 | 109.12 | 574 | 558 | 110.9 |
| C | 15 | 214 | 208911 | 1575.41 | 560 | 564 | 132.2 |
| C | 13 | 61 | 3651 | 23.34 | 560 | 564 | 132.2 |
| C | 12 | 249 | 3388 | 21.35 | 560 | 564 | 132.2 |
| D | 12 | 6 | 227643 | 1661.75 | 548 | 531 | 136.7 |
| D | 13 | 249 | 200879 | 1465.92 | 548 | 531 | 136.7 |
| D | 1 | 52 | 183984 | 1342.3 | 548 | 531 | 136.7 |
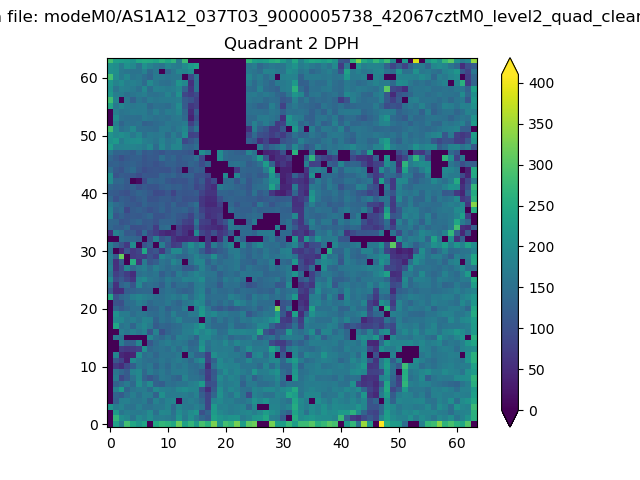
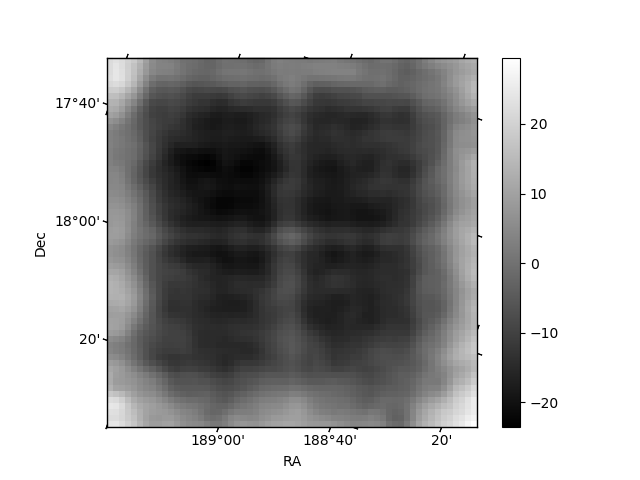
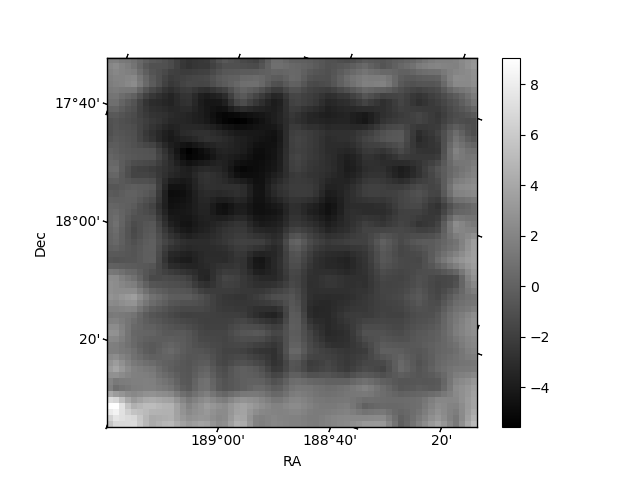
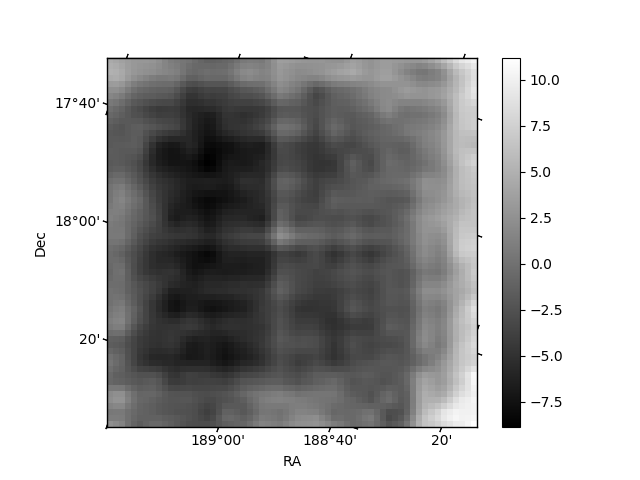
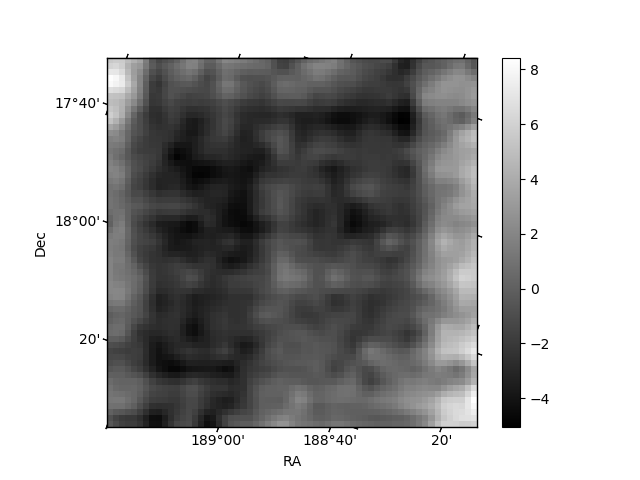
Histogram calculated using DETX and DETY for each event in the final _common_clean file
| Quadrant A | 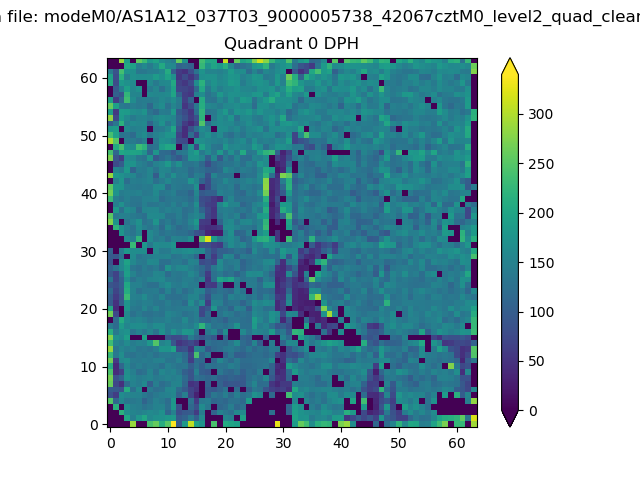 |
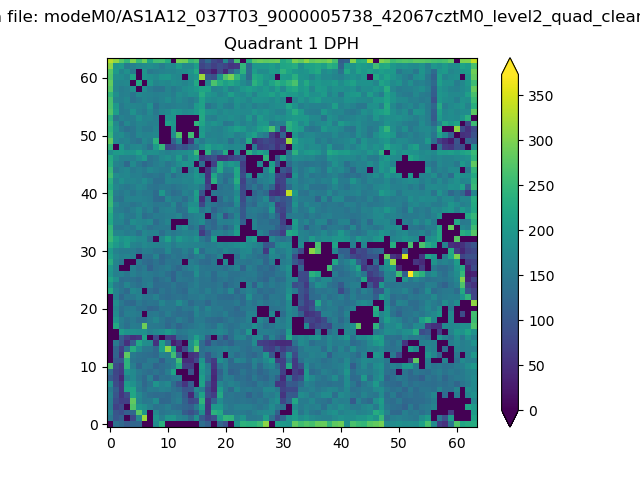 |
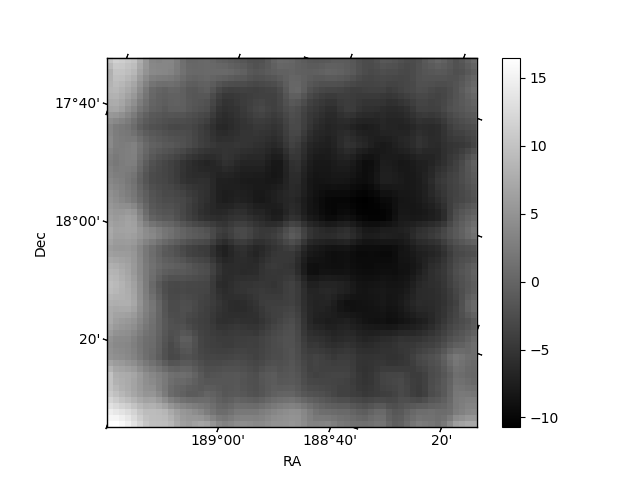
Quadrant B |
|---|---|---|---|
| Quadrant D | 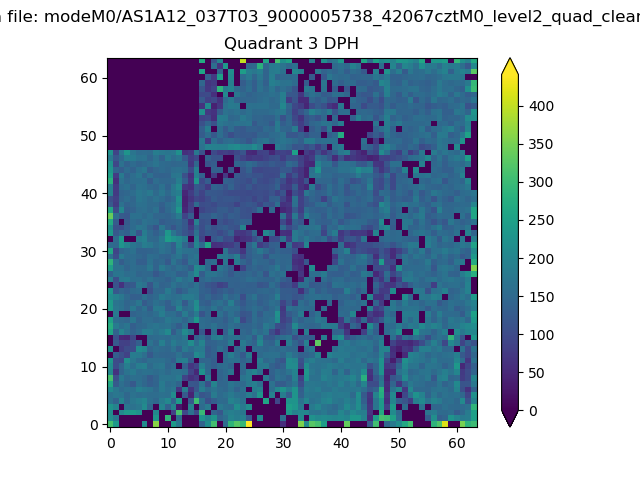 |
 |
Quadrant C |
| Plot type | Count rate plots | Images |
|---|---|---|
| Comparison with Poisson distribution Blue bars denote a histogram of data divided into 1 sec bins. Red curve is a Poisson curve with rate = median count rate of data. |
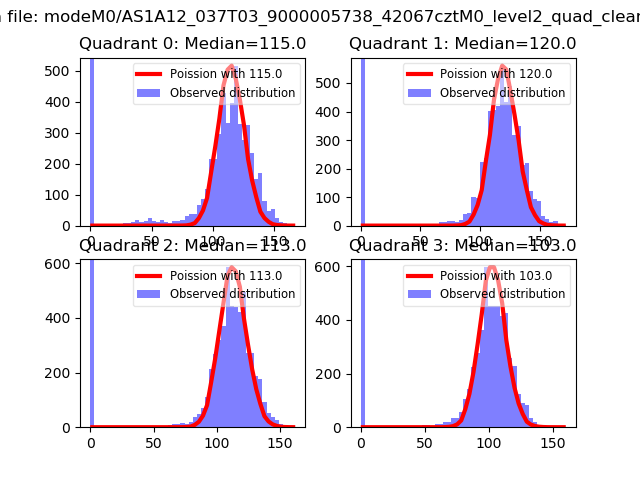 |
 |
| Quadrant-wise count rates Data is divided into 100 sec bins |
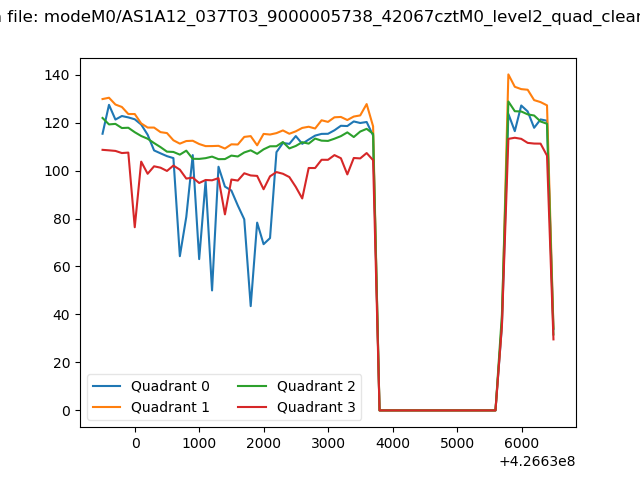 |
|
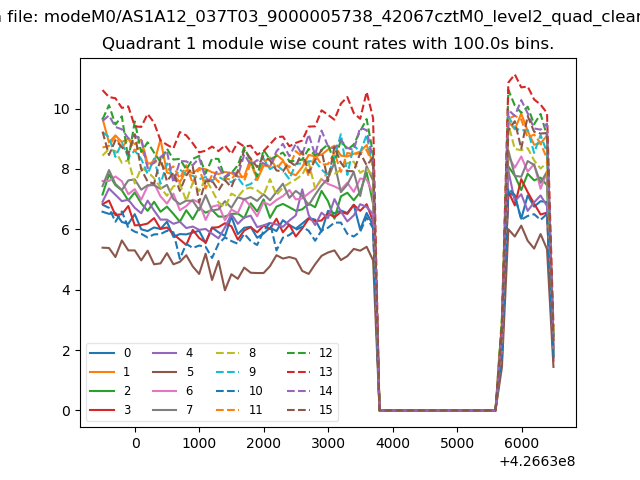
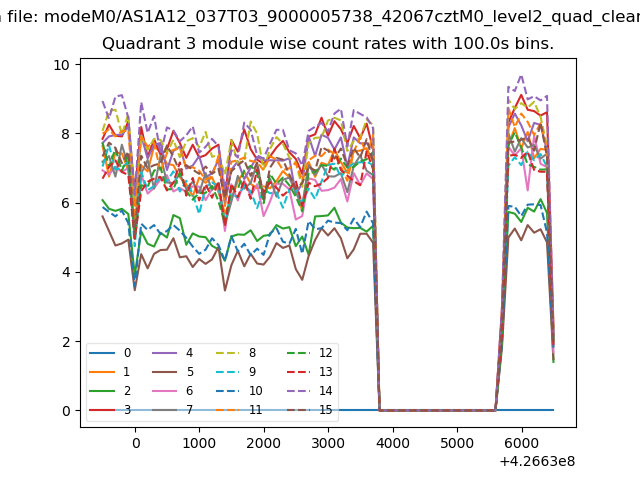
| Module-wise count rates for Quadrant A Data is divided into 100 sec bins |
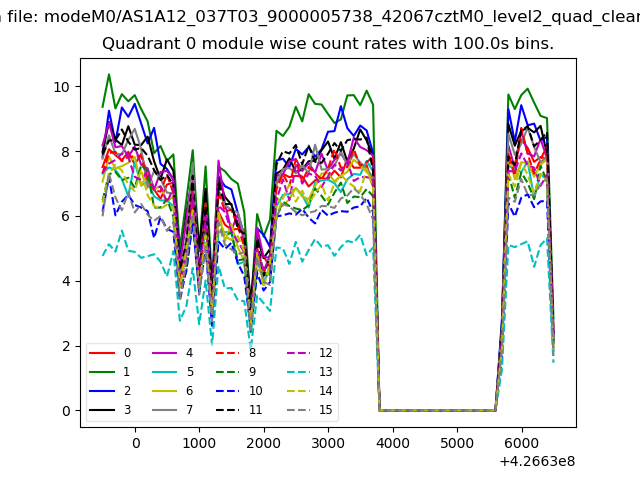 |
 |
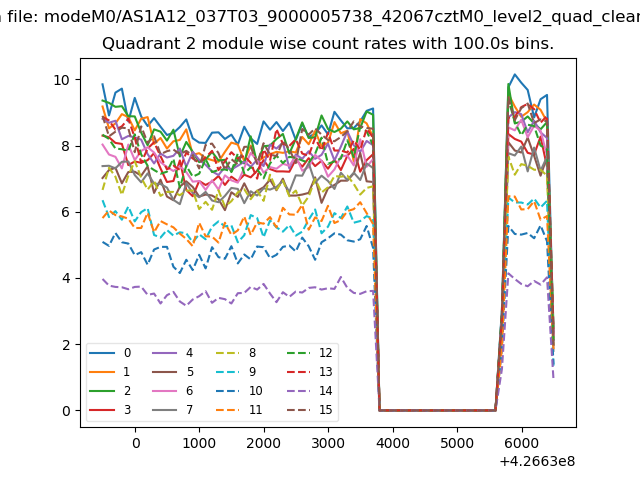
| Module-wise count rates for Quadrant B Data is divided into 100 sec bins |
 |
 |
| Module-wise count rates for Quadrant C Data is divided into 100 sec bins |
 |
 |
| Module-wise count rates for Quadrant D Data is divided into 100 sec bins |
 |
 |
| Parameter | Plot |
|---|---|
| CZT HV Monitor |  |
| D_VDD | 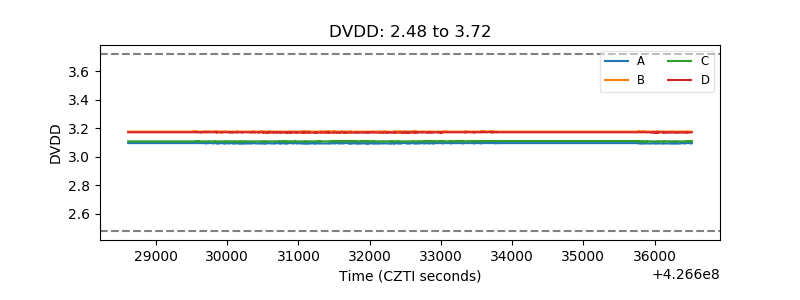 |
| Temperature 1 | 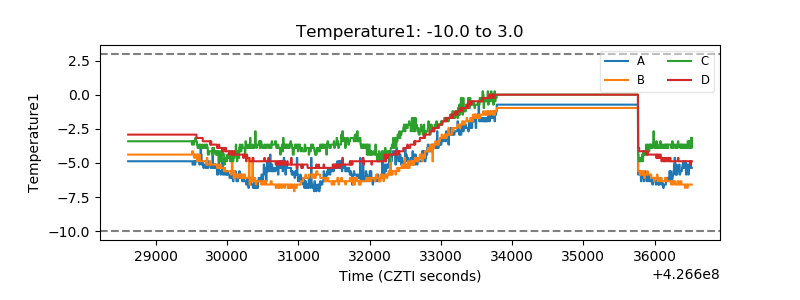 |
| Veto HV Monitor | 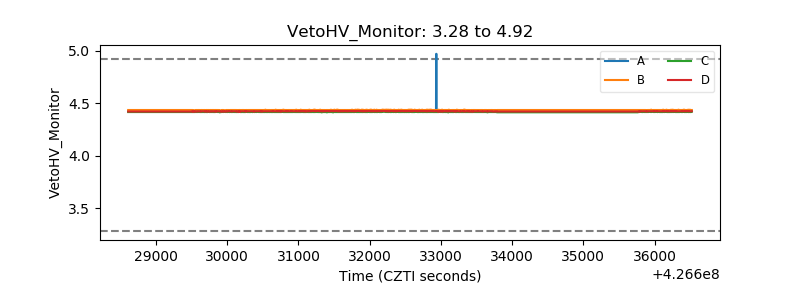 |
| Veto LLD | 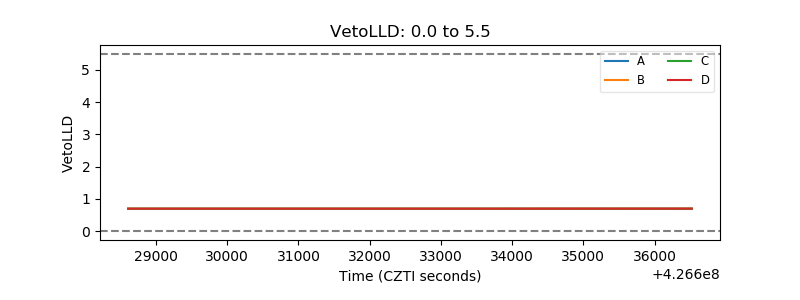 |
| Alpha Counter | 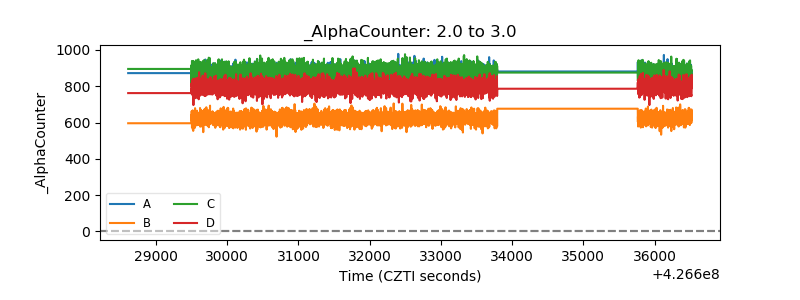 |
| _CPM_Rate |  |
| CZT Counter | 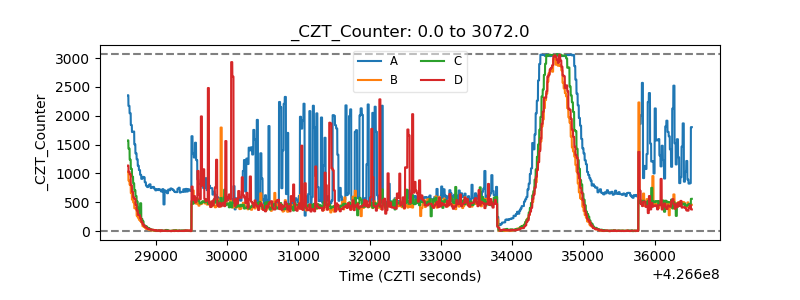 |
| +2.5 Volts monitor |  |
| +5 Volts monitor | 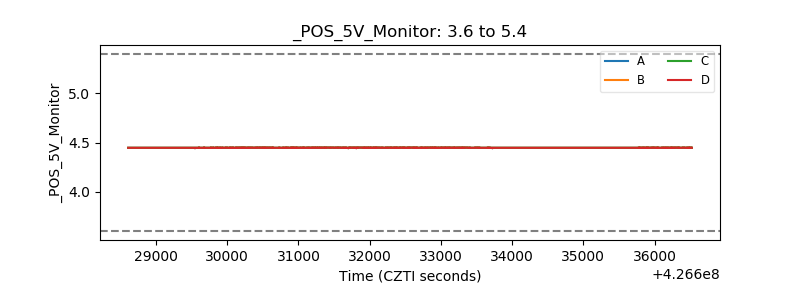 |
| _ROLL_ROT | 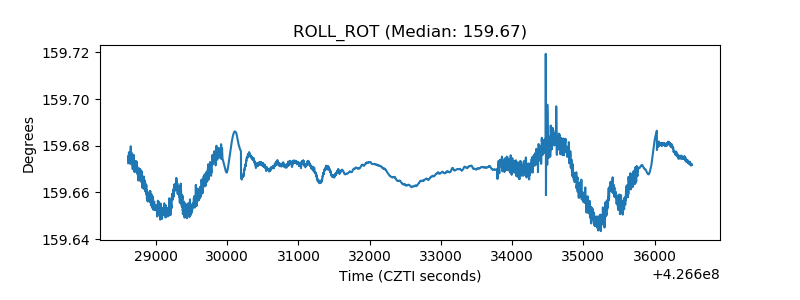 |
| _Roll_DEC | 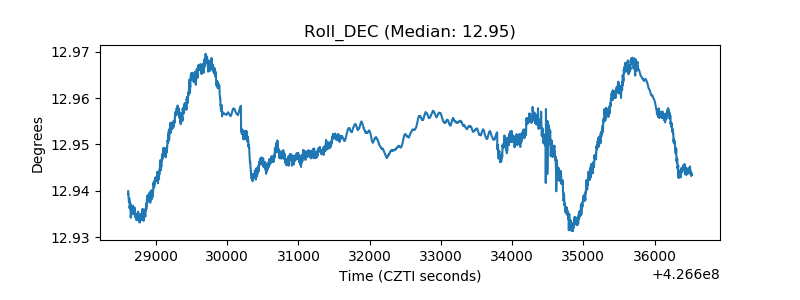 |
| _Roll_RA | 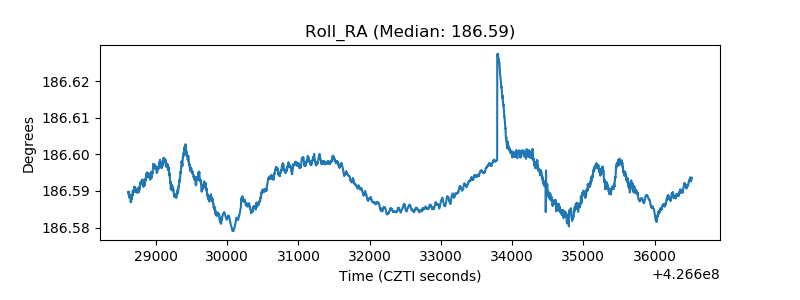 |
| Veto Counter | 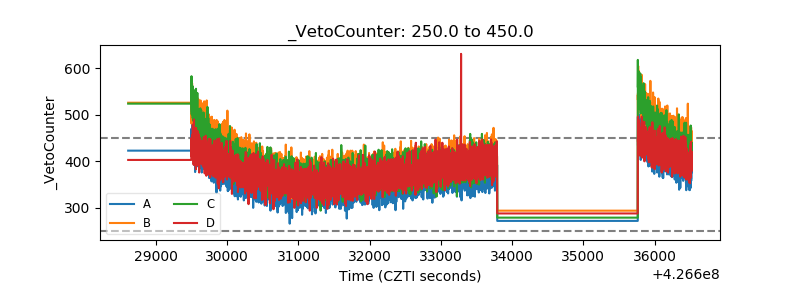 |