| Param | Original file | Final file |
|---|---|---|
| Filename | modeM0/AS1A12_037T03_9000005738_42068cztM0_level2.fits | modeM0/AS1A12_037T03_9000005738_42068cztM0_level2_quad_clean.evt |
| Size (bytes) | 353,655,360 | 85,659,840 |
| Size | 337.3 MB | 81.7 MB |
| Events in quadrant A | 5,005,483 | 566,838 |
| Events in quadrant B | 2,374,488 | 608,301 |
| Events in quadrant C | 2,369,976 | 569,175 |
| Events in quadrant D | 2,960,876 | 506,564 |
| Mode SS | |||
|---|---|---|---|
| Quadrant | BADHDUFLAG | Total packets | Discarded packets |
| A | 0 | 100 | 0 |
| B | 0 | 100 | 0 |
| C | 0 | 100 | 0 |
| D | 0 | 100 | 0 |
| Mode M9 | |||
|---|---|---|---|
| Quadrant | BADHDUFLAG | Total packets | Discarded packets |
| A | 0 | 35 | 0 |
| B | 0 | 36 | 0 |
| C | 0 | 36 | 0 |
| D | 0 | 36 | 0 |
| Mode M0 | |||
|---|---|---|---|
| Quadrant | BADHDUFLAG | Total packets | Discarded packets |
| A | 0 | 18319 | 2 |
| B | 0 | 10178 | 2 |
| C | 0 | 9843 | 2 |
| D | 0 | 12117 | 2 |
| Quadrant | Total seconds | Saturated seconds | Saturation percentage |
|---|---|---|---|
| A | 4888 | 255 | 5.216858% |
| B | 4888 | 20 | 0.409165% |
| C | 4888 | 2 | 0.040917% |
| D | 4888 | 155 | 3.171031% |
Noise dominated data is calculated using 1-second bins in cleaned event files. If a bin has >2000 counts, and if more than 50% of those come from <1% of pixels, then it is considered to be noise-dominated and hence unusable.
| Quadrant | # 1 sec bins | Bins with >0 counts | Bins with >2000 counts | High rate bins dominated by noise | Noise dominated (total time) | Noise dominated (detector-on time) | Marked lightcurve |
|---|---|---|---|---|---|---|---|
| A | 6921 | 4889 | 249 | 249 | 3.60% | 5.09% | 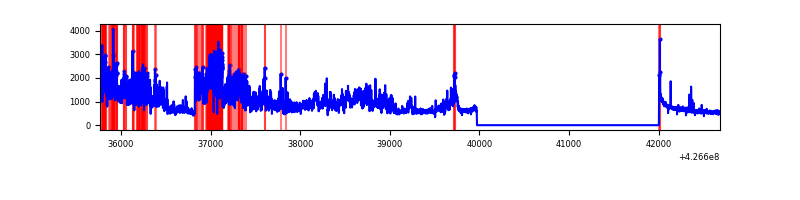 |
| B | 6921 | 4889 | 13 | 13 | 0.19% | 0.27% | 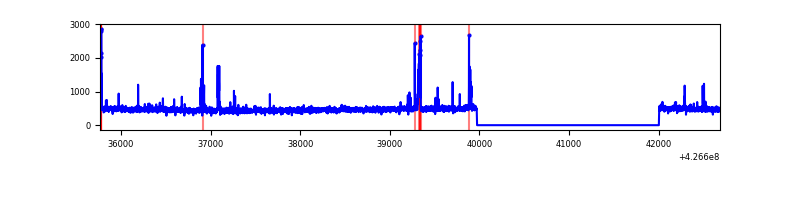 |
| C | 6921 | 4889 | 0 | 0 | 0.00% | 0.00% | 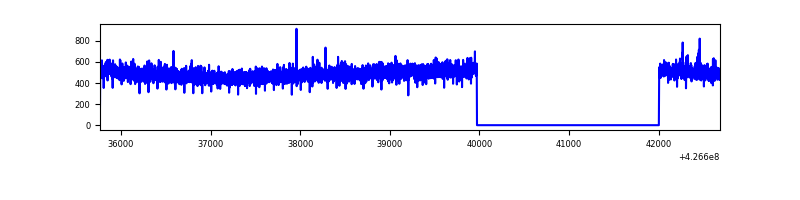 |
| D | 6921 | 4889 | 130 | 130 | 1.88% | 2.66% | 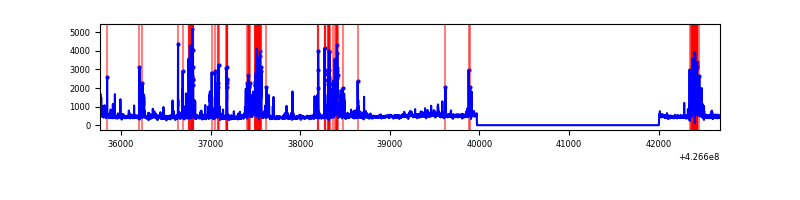 |
Top three noisy pixels from each quadrant. If the there are fewer than three noisy pixels in the level2.evt file, extra rows are filled as -1
| Pixel properties | Quadrant properties | ||||||
|---|---|---|---|---|---|---|---|
| Quadrant | DetID | PixID | Counts | Sigma | Mean | Median | Sigma |
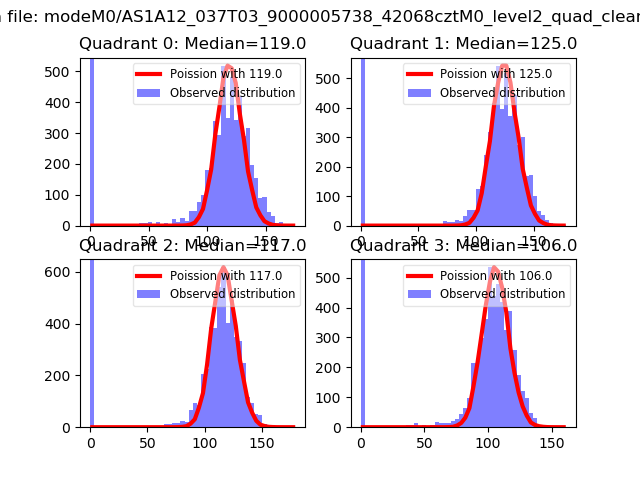
| A | 15 | 223 | 2125759 | 18728.68 | 560 | 552 | 113.5 |
| A | 10 | 83 | 495418 | 4361.07 | 560 | 552 | 113.5 |
| A | 15 | 222 | 177436 | 1558.81 | 560 | 552 | 113.5 |
| B | 3 | 112 | 77745 | 704.77 | 569 | 552 | 109.5 |
| B | 5 | 255 | 43690 | 393.85 | 569 | 552 | 109.5 |
| B | 15 | 85 | 15107 | 132.89 | 569 | 552 | 109.5 |
| C | 15 | 214 | 203491 | 1556.57 | 553 | 557 | 130.4 |
| C | 8 | 79 | 4994 | 34.03 | 553 | 557 | 130.4 |
| C | 13 | 61 | 3742 | 24.43 | 553 | 557 | 130.4 |
| D | 12 | 6 | 594210 | 4395.98 | 541 | 525 | 135.1 |
| D | 1 | 52 | 136660 | 1008.02 | 541 | 525 | 135.1 |
| D | 13 | 249 | 49465 | 362.38 | 541 | 525 | 135.1 |
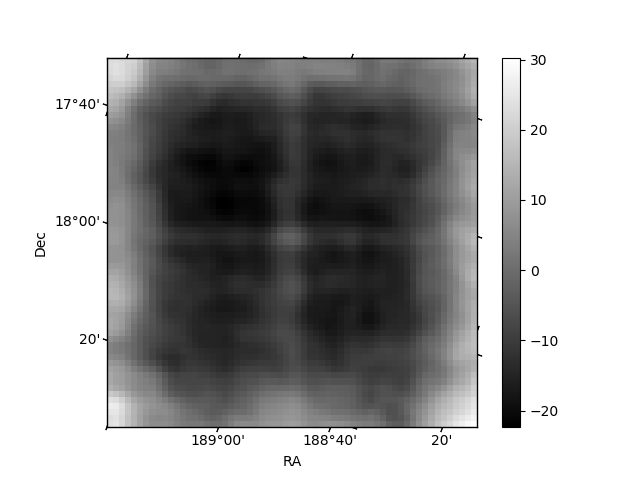
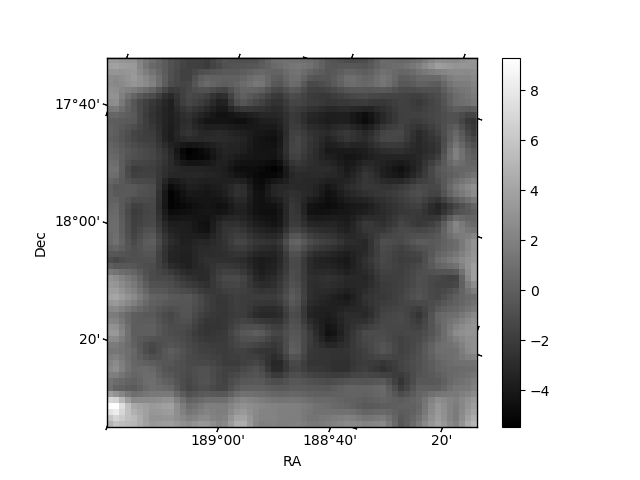
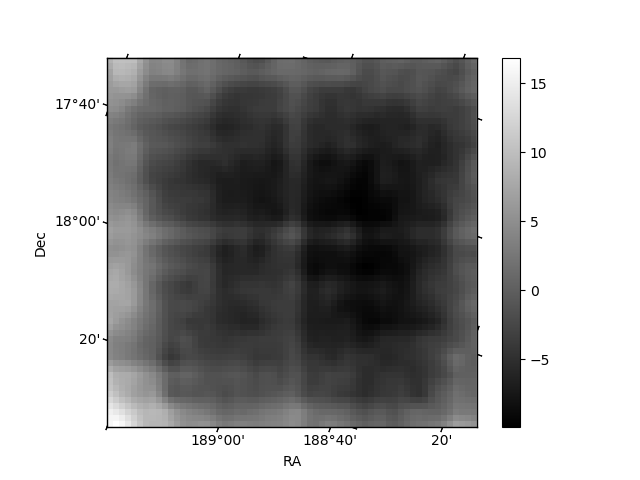
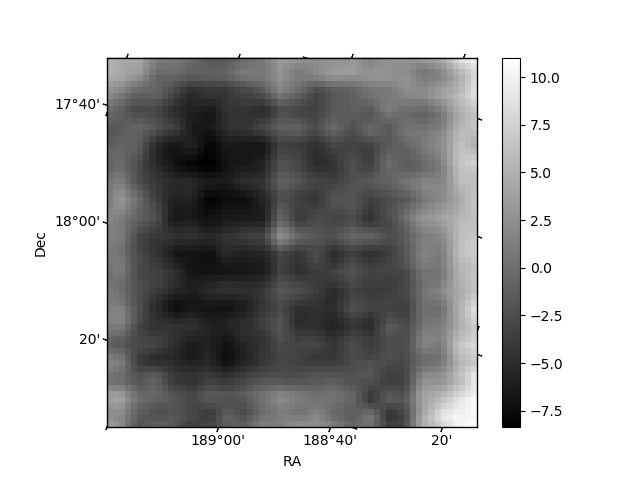
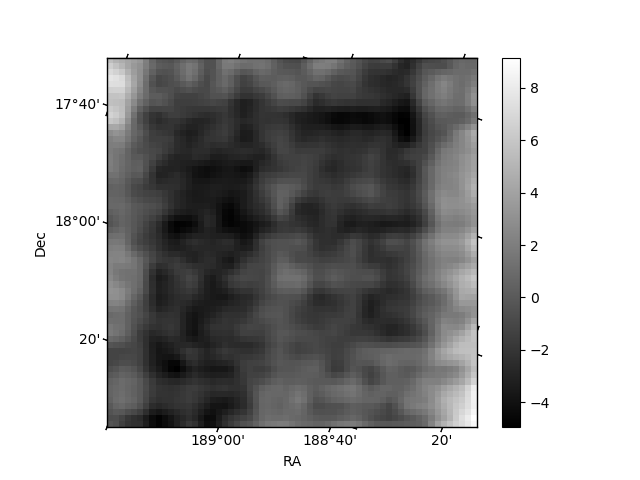
Histogram calculated using DETX and DETY for each event in the final _common_clean file
| Quadrant A | 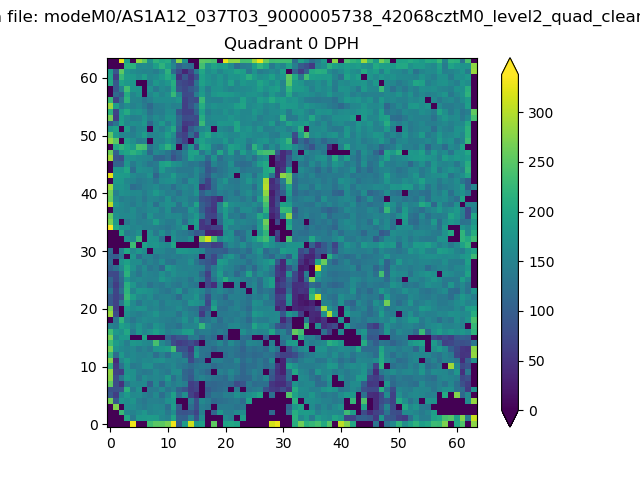 |
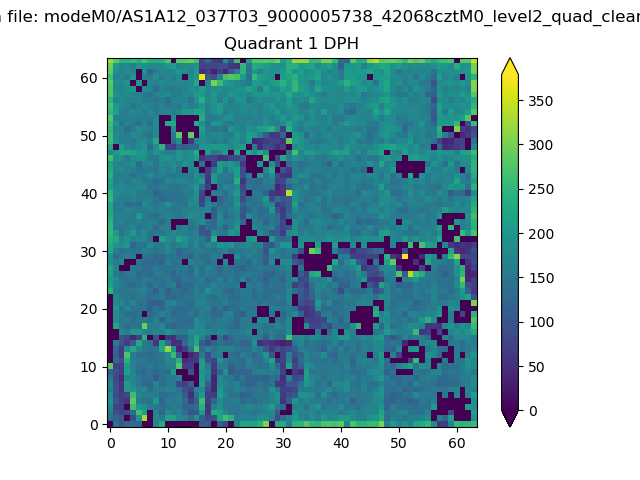 |
Quadrant B |
|---|---|---|---|
| Quadrant D | 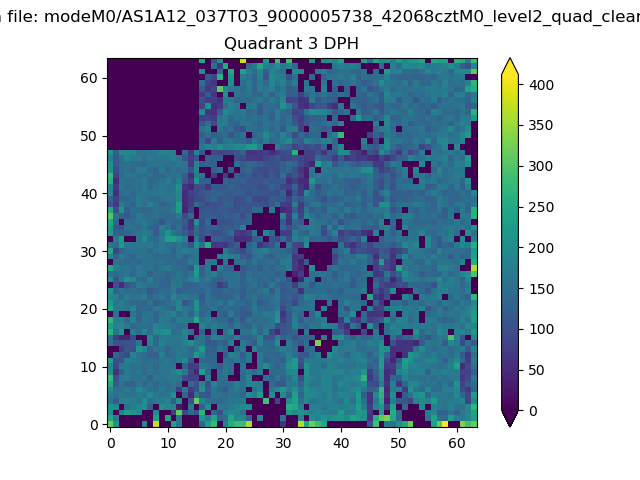 |
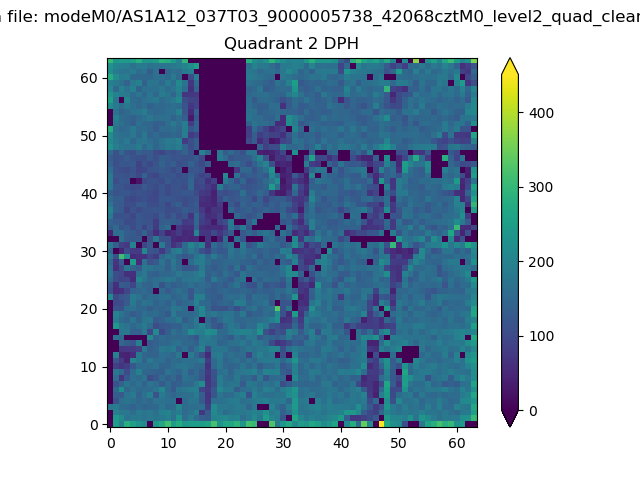 |
Quadrant C |
| Plot type | Count rate plots | Images |
|---|---|---|
| Comparison with Poisson distribution Blue bars denote a histogram of data divided into 1 sec bins. Red curve is a Poisson curve with rate = median count rate of data. |
 |
 |
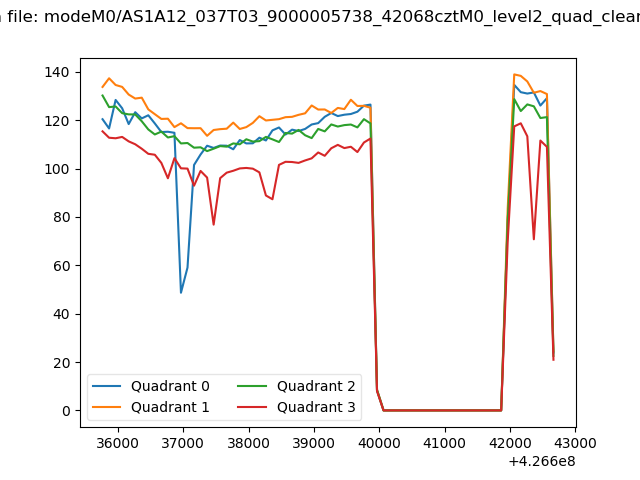
| Quadrant-wise count rates Data is divided into 100 sec bins |
 |
|
| Module-wise count rates for Quadrant A Data is divided into 100 sec bins |
 |
 |
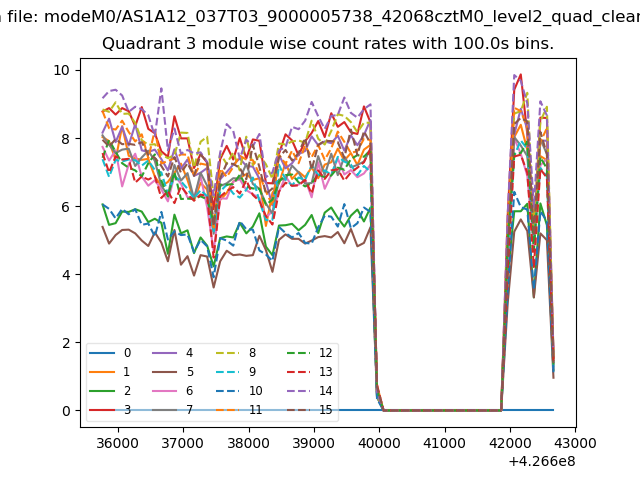
| Module-wise count rates for Quadrant B Data is divided into 100 sec bins |
 |
 |
| Module-wise count rates for Quadrant C Data is divided into 100 sec bins |
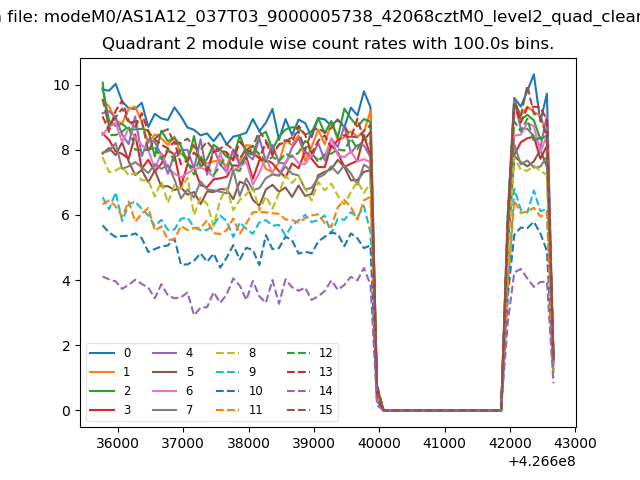 |
 |
| Module-wise count rates for Quadrant D Data is divided into 100 sec bins |
 |
 |
| Parameter | Plot |
|---|---|
| CZT HV Monitor | 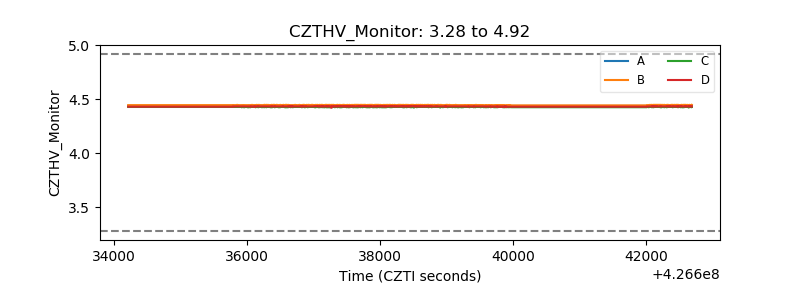 |
| D_VDD | 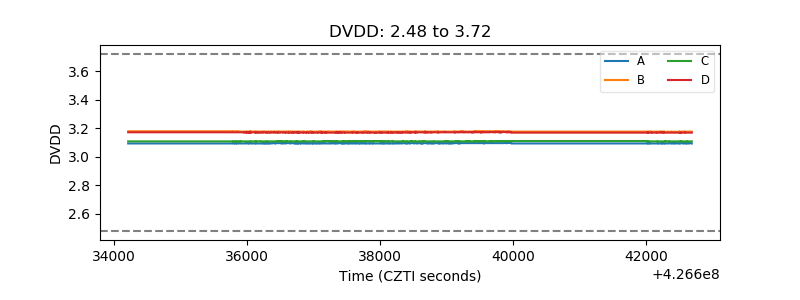 |
| Temperature 1 | 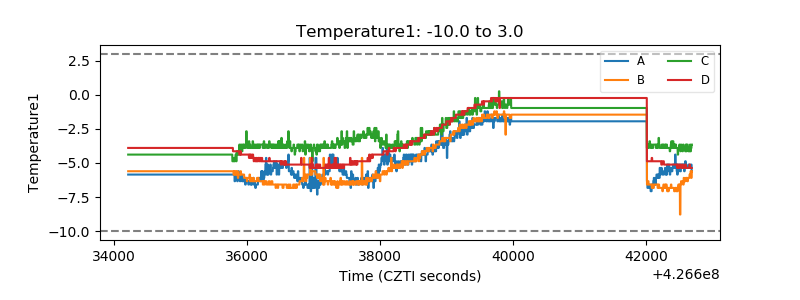 |
| Veto HV Monitor |  |
| Veto LLD | 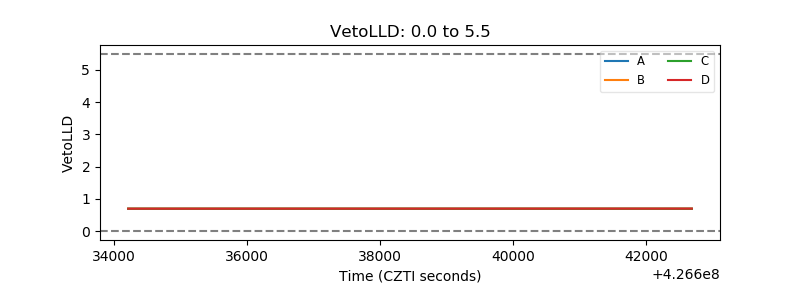 |
| Alpha Counter |  |
| _CPM_Rate |  |
| CZT Counter | 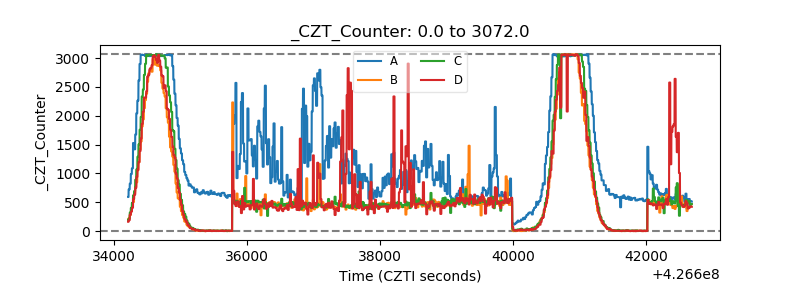 |
| +2.5 Volts monitor | 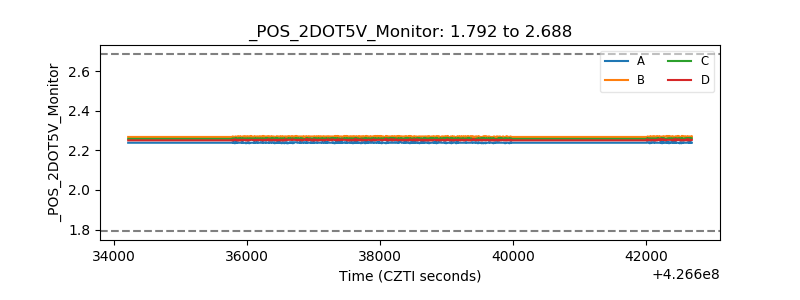 |
| +5 Volts monitor |  |
| _ROLL_ROT | 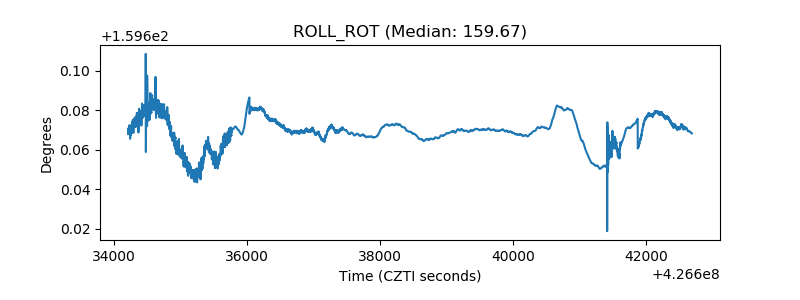 |
| _Roll_DEC | 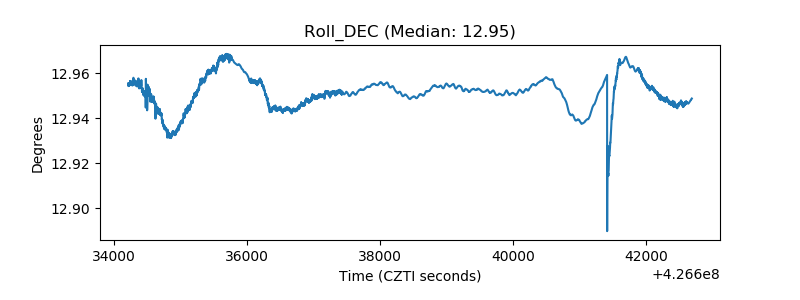 |
| _Roll_RA | 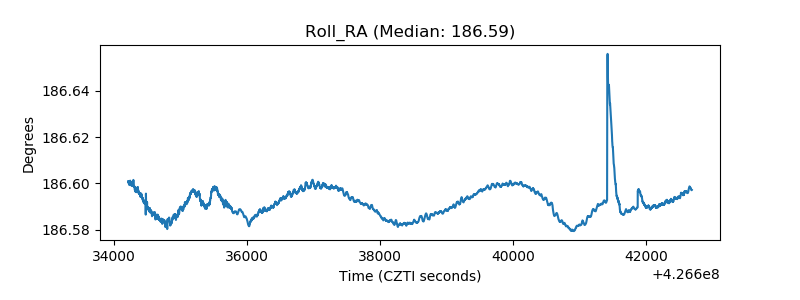 |
| Veto Counter |  |