| Param | Original file | Final file |
|---|---|---|
| Filename | modeM0/AS1A12_037T03_9000005738_42069cztM0_level2.fits | modeM0/AS1A12_037T03_9000005738_42069cztM0_level2_quad_clean.evt |
| Size (bytes) | 314,579,520 | 92,085,120 |
| Size | 300.0 MB | 87.8 MB |
| Events in quadrant A | 3,271,351 | 624,249 |
| Events in quadrant B | 2,446,477 | 650,912 |
| Events in quadrant C | 2,540,282 | 606,767 |
| Events in quadrant D | 2,981,346 | 542,120 |
| Mode SS | |||
|---|---|---|---|
| Quadrant | BADHDUFLAG | Total packets | Discarded packets |
| A | 0 | 108 | 0 |
| B | 0 | 108 | 0 |
| C | 0 | 108 | 0 |
| D | 0 | 108 | 0 |
| Mode M9 | |||
|---|---|---|---|
| Quadrant | BADHDUFLAG | Total packets | Discarded packets |
| A | 0 | 32 | 0 |
| B | 0 | 33 | 0 |
| C | 0 | 33 | 0 |
| D | 0 | 33 | 0 |
| Mode M0 | |||
|---|---|---|---|
| Quadrant | BADHDUFLAG | Total packets | Discarded packets |
| A | 0 | 12839 | 2 |
| B | 0 | 10575 | 2 |
| C | 0 | 10503 | 2 |
| D | 0 | 12438 | 2 |
| Quadrant | Total seconds | Saturated seconds | Saturation percentage |
|---|---|---|---|
| A | 5199 | 34 | 0.653972% |
| B | 5199 | 12 | 0.230814% |
| C | 5198 | 4 | 0.076953% |
| D | 5198 | 133 | 2.558676% |
Noise dominated data is calculated using 1-second bins in cleaned event files. If a bin has >2000 counts, and if more than 50% of those come from <1% of pixels, then it is considered to be noise-dominated and hence unusable.
| Quadrant | # 1 sec bins | Bins with >0 counts | Bins with >2000 counts | High rate bins dominated by noise | Noise dominated (total time) | Noise dominated (detector-on time) | Marked lightcurve |
|---|---|---|---|---|---|---|---|
| A | 7321 | 5200 | 22 | 22 | 0.30% | 0.42% | 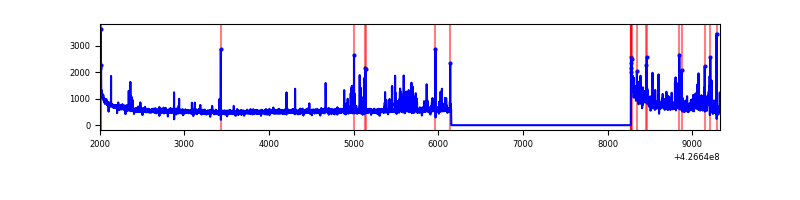 |
| B | 7321 | 5200 | 3 | 3 | 0.04% | 0.06% | 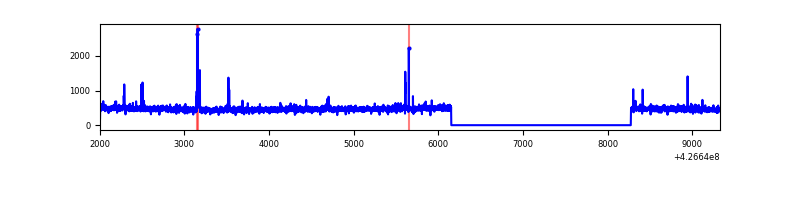 |
| C | 7320 | 5199 | 0 | 0 | 0.00% | 0.00% | 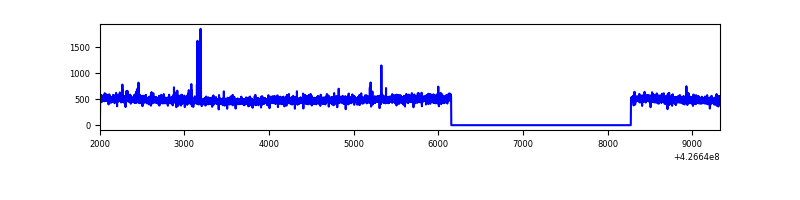 |
| D | 7320 | 5199 | 124 | 124 | 1.69% | 2.39% | 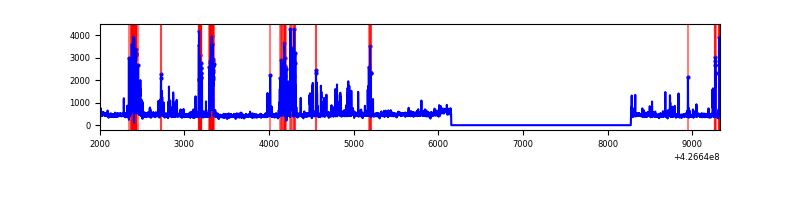 |
Top three noisy pixels from each quadrant. If the there are fewer than three noisy pixels in the level2.evt file, extra rows are filled as -1
| Pixel properties | Quadrant properties | ||||||
|---|---|---|---|---|---|---|---|
| Quadrant | DetID | PixID | Counts | Sigma | Mean | Median | Sigma |
| A | 10 | 83 | 526205 | 4216.14 | 609 | 596 | 124.7 |
| A | 15 | 222 | 225762 | 1806.15 | 609 | 596 | 124.7 |
| A | 15 | 223 | 151006 | 1206.5 | 609 | 596 | 124.7 |
| B | 3 | 112 | 35839 | 298.62 | 609 | 594 | 118.0 |
| B | 12 | 111 | 14451 | 117.41 | 609 | 594 | 118.0 |
| B | 11 | 111 | 13697 | 111.02 | 609 | 594 | 118.0 |
| C | 15 | 214 | 217276 | 1572.83 | 590 | 594 | 137.8 |
| C | 8 | 79 | 21295 | 150.26 | 590 | 594 | 137.8 |
| C | 13 | 61 | 4066 | 25.2 | 590 | 594 | 137.8 |
| D | 1 | 52 | 309417 | 2165.13 | 580 | 562 | 142.6 |
| D | 12 | 6 | 303972 | 2126.96 | 580 | 562 | 142.6 |
| D | 13 | 249 | 92032 | 641.22 | 580 | 562 | 142.6 |
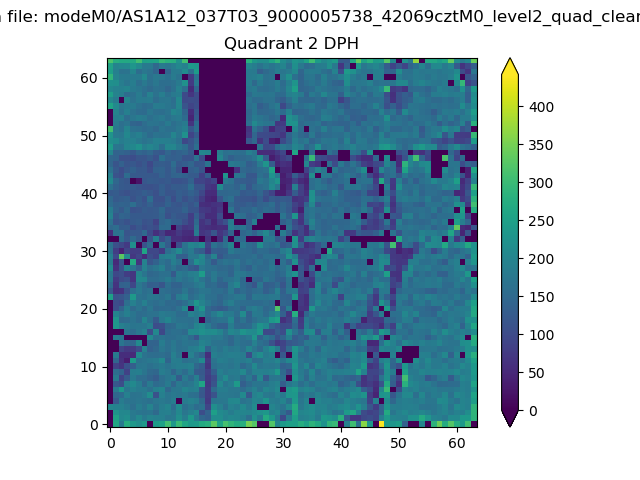
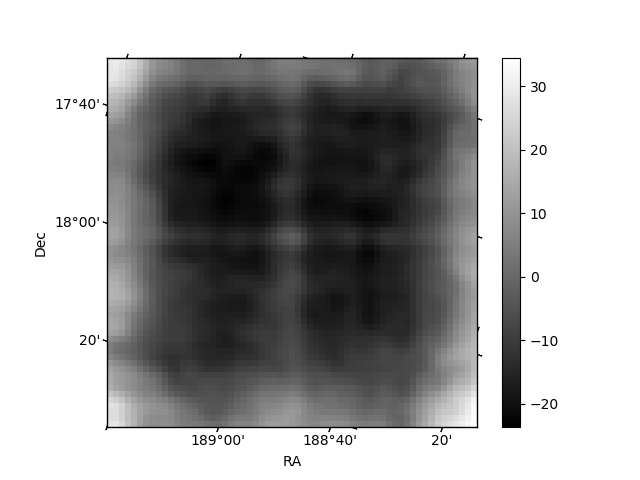
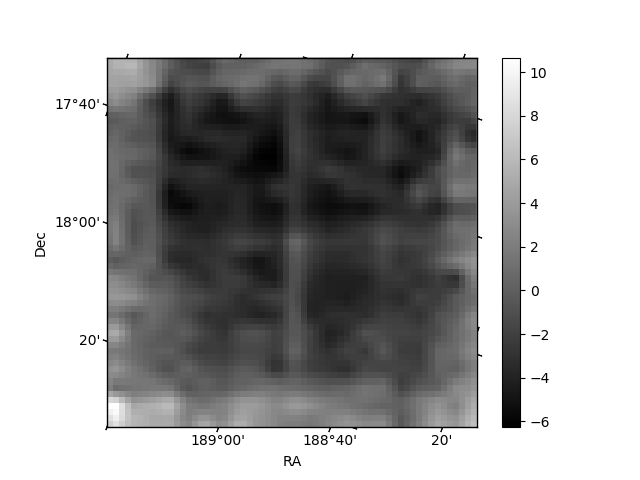
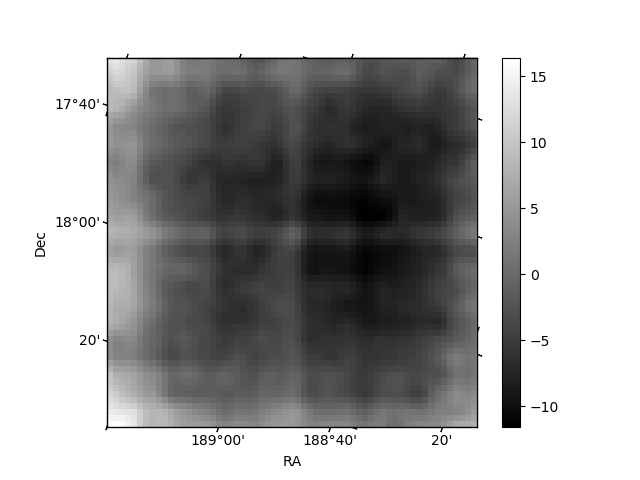
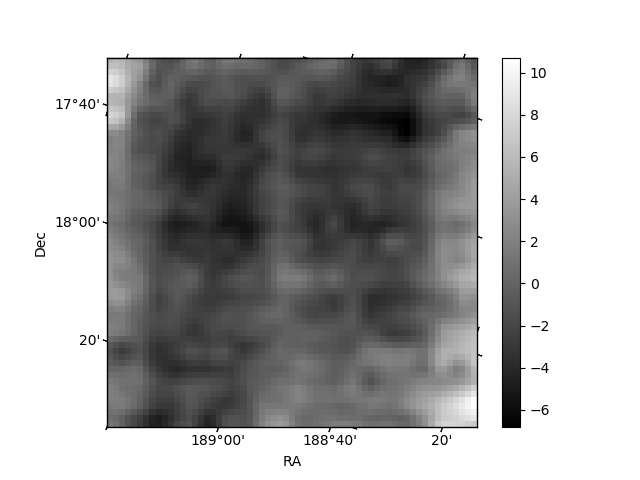
Histogram calculated using DETX and DETY for each event in the final _common_clean file
| Quadrant A | 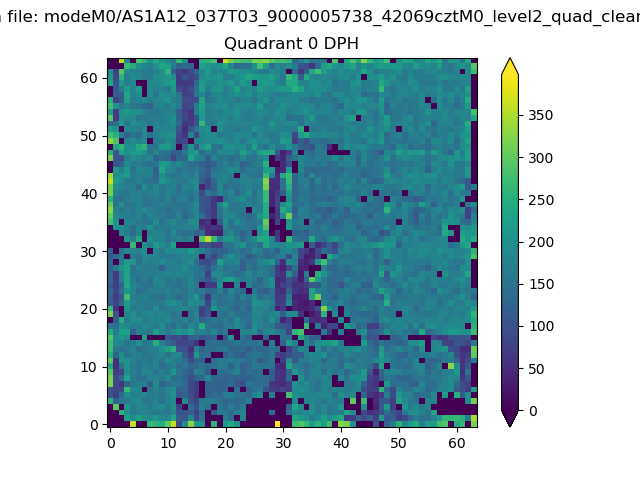 |
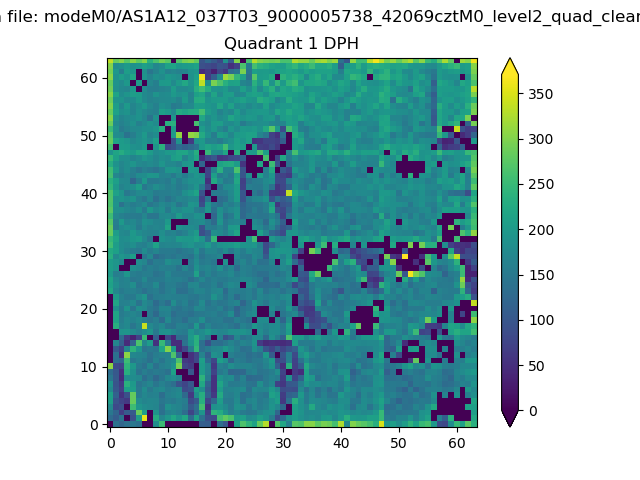 |
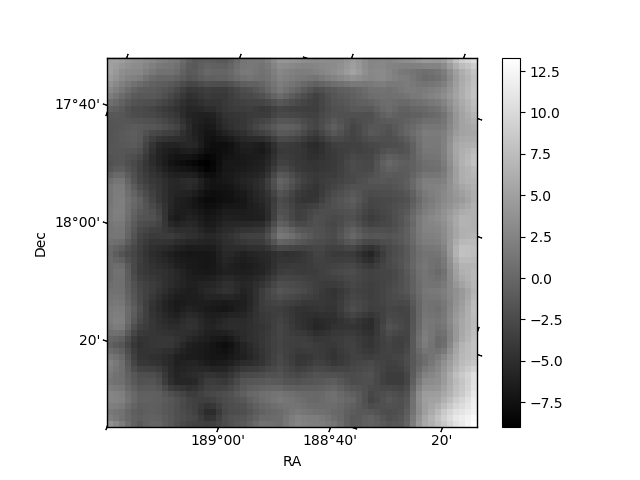
Quadrant B |
|---|---|---|---|
| Quadrant D | 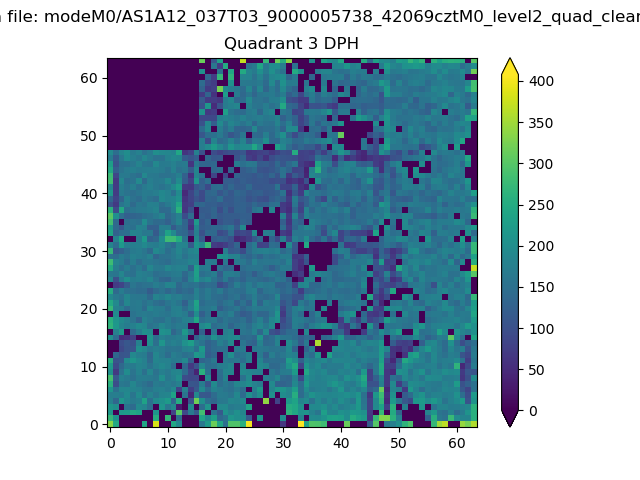 |
 |
Quadrant C |
| Plot type | Count rate plots | Images |
|---|---|---|
| Comparison with Poisson distribution Blue bars denote a histogram of data divided into 1 sec bins. Red curve is a Poisson curve with rate = median count rate of data. |
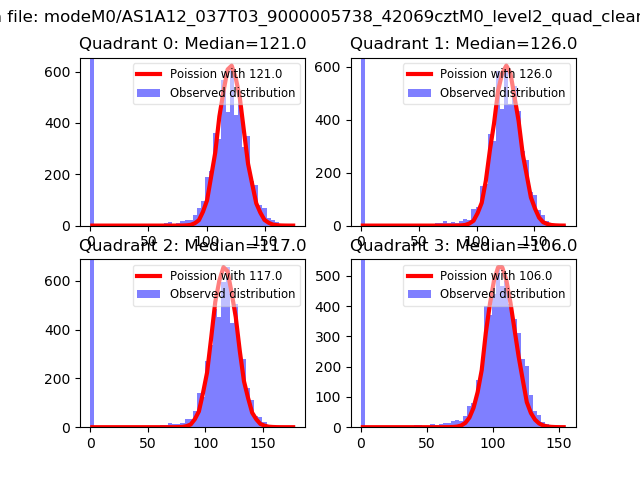 |
 |
| Quadrant-wise count rates Data is divided into 100 sec bins |
 |
|
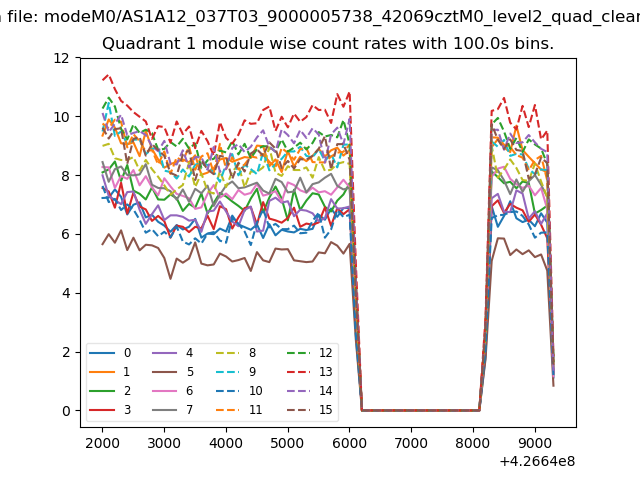
| Module-wise count rates for Quadrant A Data is divided into 100 sec bins |
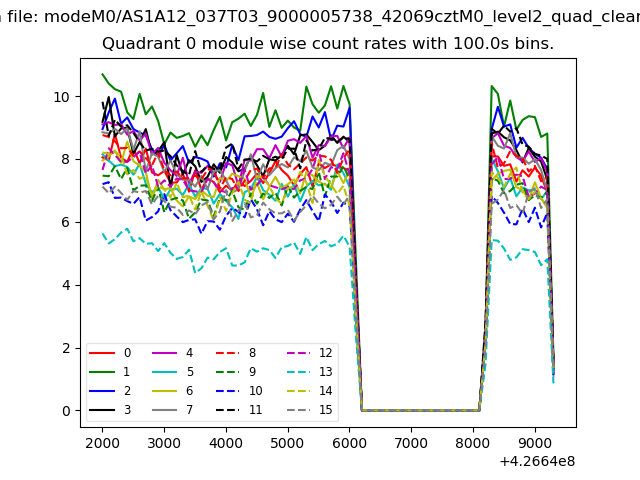 |
 |
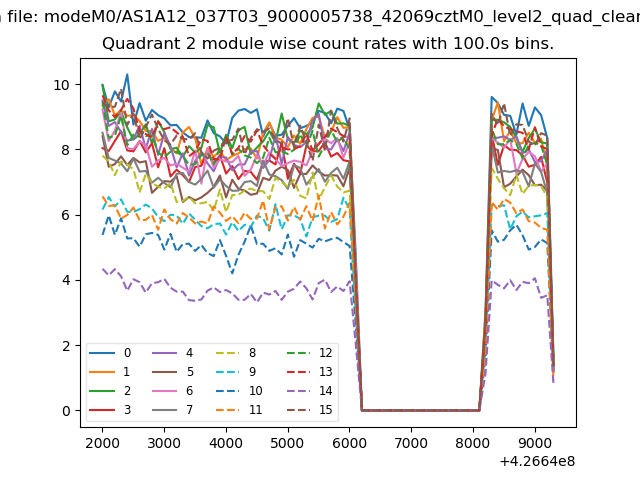
| Module-wise count rates for Quadrant B Data is divided into 100 sec bins |
 |
 |
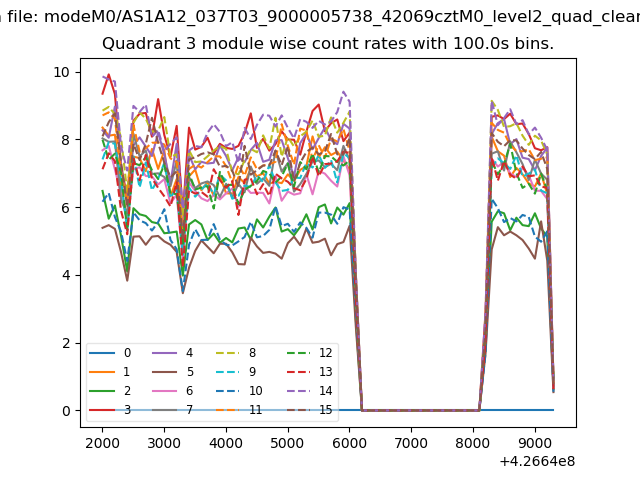
| Module-wise count rates for Quadrant C Data is divided into 100 sec bins |
 |
 |
| Module-wise count rates for Quadrant D Data is divided into 100 sec bins |
 |
 |
| Parameter | Plot |
|---|---|
| CZT HV Monitor | 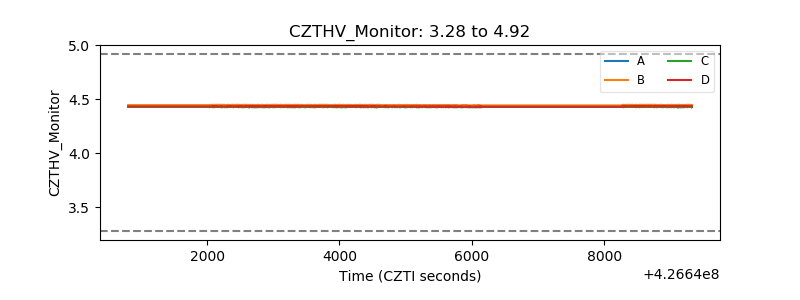 |
| D_VDD | 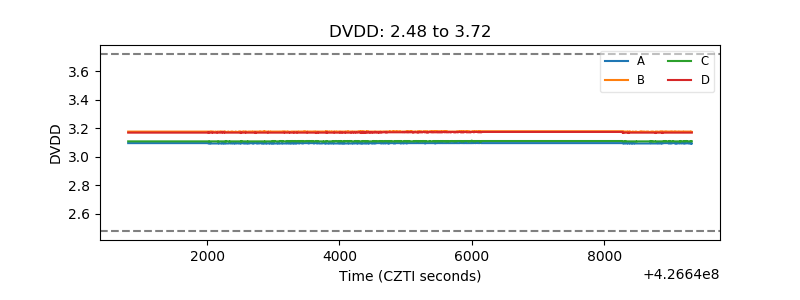 |
| Temperature 1 | 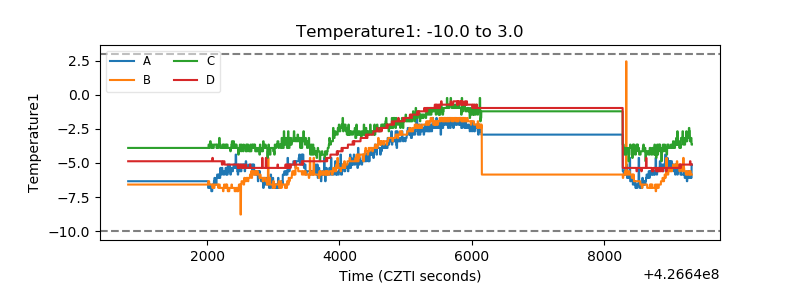 |
| Veto HV Monitor | 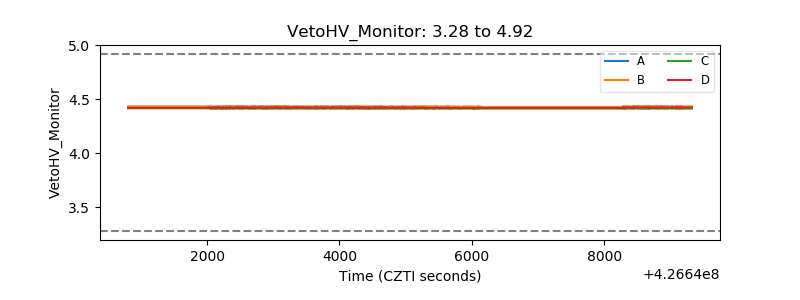 |
| Veto LLD | 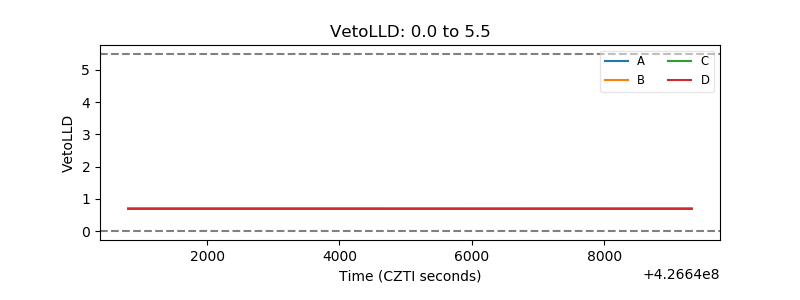 |
| Alpha Counter | 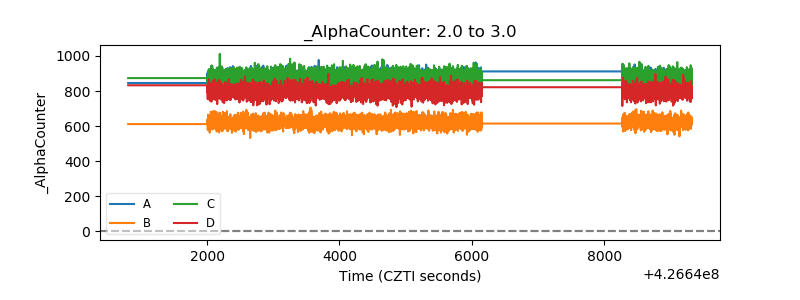 |
| _CPM_Rate | 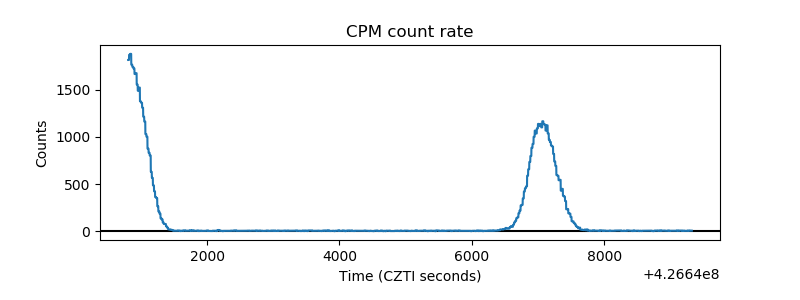 |
| CZT Counter | 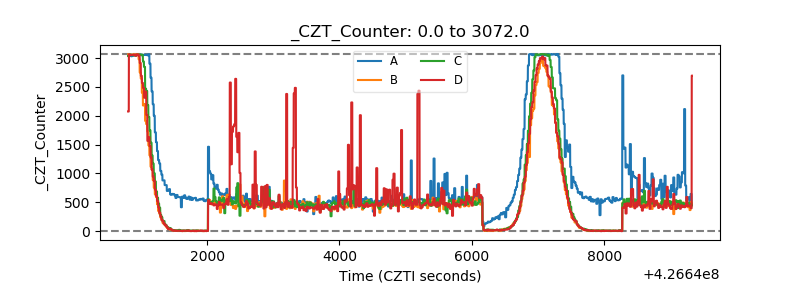 |
| +2.5 Volts monitor |  |
| +5 Volts monitor | 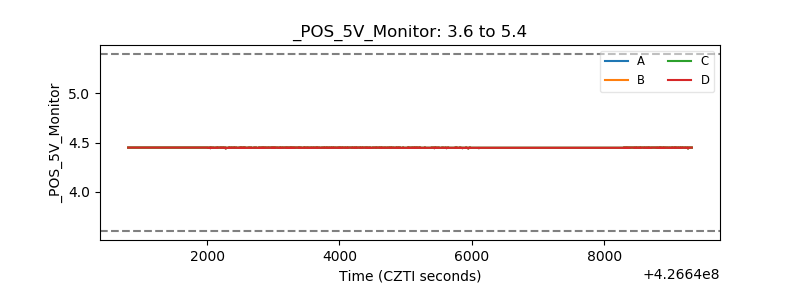 |
| _ROLL_ROT | 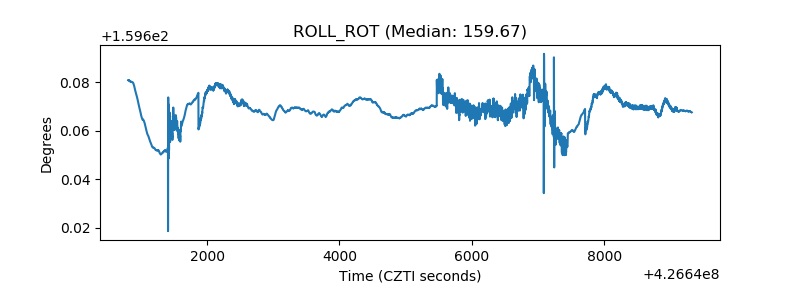 |
| _Roll_DEC | 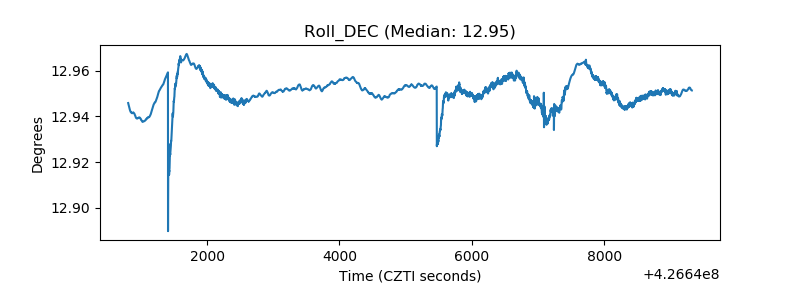 |
| _Roll_RA | 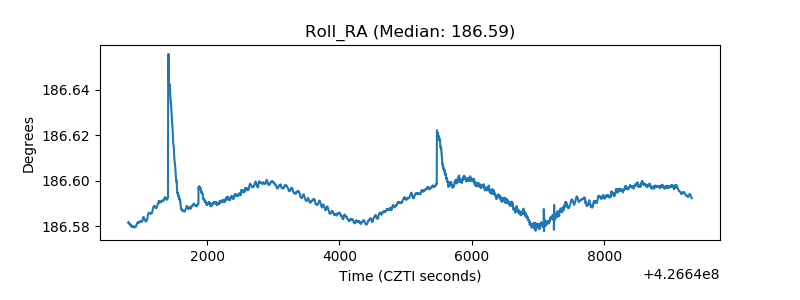 |
| Veto Counter | 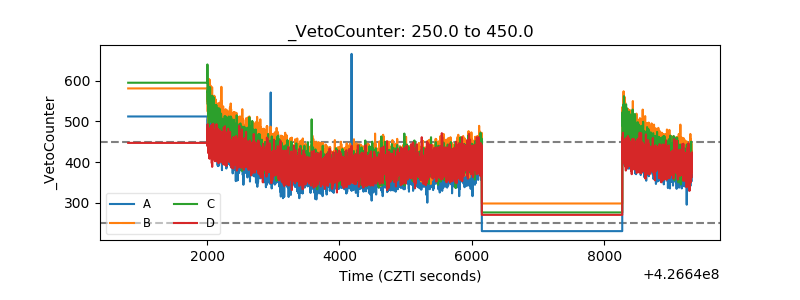 |