| Param | Original file | Final file |
|---|---|---|
| Filename | modeM0/AS1A12_037T03_9000005738_42070cztM0_level2.fits | modeM0/AS1A12_037T03_9000005738_42070cztM0_level2_quad_clean.evt |
| Size (bytes) | 327,741,120 | 88,021,440 |
| Size | 312.6 MB | 83.9 MB |
| Events in quadrant A | 3,877,974 | 592,944 |
| Events in quadrant B | 2,381,124 | 619,131 |
| Events in quadrant C | 2,455,695 | 576,563 |
| Events in quadrant D | 3,019,854 | 519,518 |
| Mode SS | |||
|---|---|---|---|
| Quadrant | BADHDUFLAG | Total packets | Discarded packets |
| A | 0 | 104 | 0 |
| B | 0 | 104 | 0 |
| C | 0 | 104 | 0 |
| D | 0 | 104 | 0 |
| Mode M9 | |||
|---|---|---|---|
| Quadrant | BADHDUFLAG | Total packets | Discarded packets |
| A | 0 | 21 | 0 |
| B | 0 | 21 | 0 |
| C | 0 | 21 | 0 |
| D | 0 | 21 | 0 |
| Mode M0 | |||
|---|---|---|---|
| Quadrant | BADHDUFLAG | Total packets | Discarded packets |
| A | 0 | 15174 | 1 |
| B | 0 | 10425 | 1 |
| C | 0 | 10266 | 1 |
| D | 0 | 12515 | 1 |
| Quadrant | Total seconds | Saturated seconds | Saturation percentage |
|---|---|---|---|
| A | 5098 | 59 | 1.157317% |
| B | 5098 | 13 | 0.255002% |
| C | 5099 | 3 | 0.058835% |
| D | 5099 | 160 | 3.137870% |
Noise dominated data is calculated using 1-second bins in cleaned event files. If a bin has >2000 counts, and if more than 50% of those come from <1% of pixels, then it is considered to be noise-dominated and hence unusable.
| Quadrant | # 1 sec bins | Bins with >0 counts | Bins with >2000 counts | High rate bins dominated by noise | Noise dominated (total time) | Noise dominated (detector-on time) | Marked lightcurve |
|---|---|---|---|---|---|---|---|
| A | 7222 | 5099 | 27 | 27 | 0.37% | 0.53% | 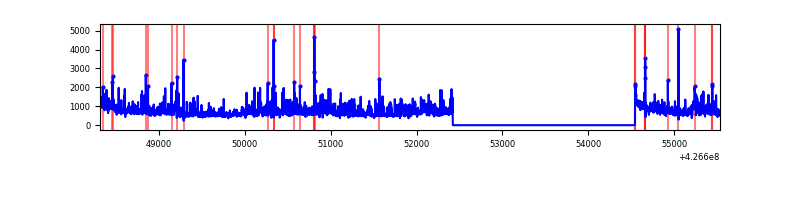 |
| B | 7222 | 5099 | 6 | 6 | 0.08% | 0.12% | 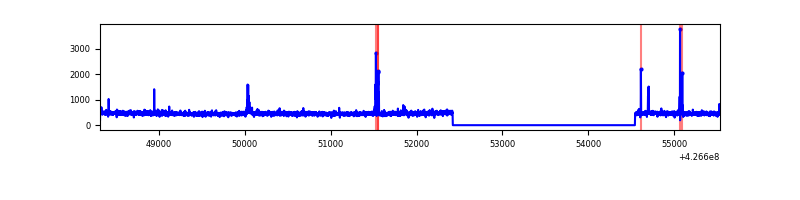 |
| C | 7223 | 5100 | 1 | 1 | 0.01% | 0.02% | 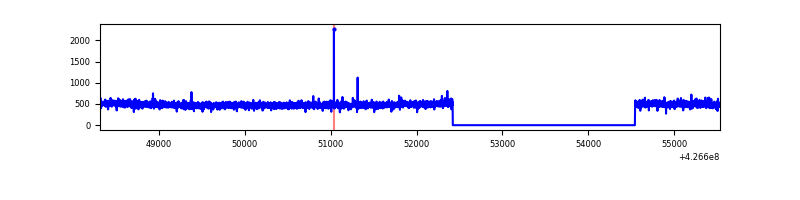 |
| D | 7223 | 5100 | 136 | 136 | 1.88% | 2.67% | 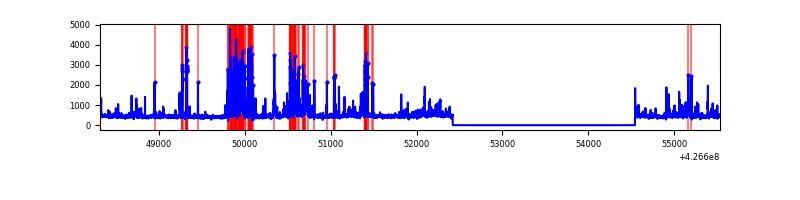 |
Top three noisy pixels from each quadrant. If the there are fewer than three noisy pixels in the level2.evt file, extra rows are filled as -1
| Pixel properties | Quadrant properties | ||||||
|---|---|---|---|---|---|---|---|
| Quadrant | DetID | PixID | Counts | Sigma | Mean | Median | Sigma |
| A | 15 | 222 | 818407 | 6731.92 | 587 | 575 | 121.5 |
| A | 10 | 83 | 497745 | 4092.42 | 587 | 575 | 121.5 |
| A | 15 | 223 | 276393 | 2270.38 | 587 | 575 | 121.5 |
| B | 5 | 255 | 40174 | 350.45 | 586 | 571 | 113.0 |
| B | 3 | 112 | 39426 | 343.83 | 586 | 571 | 113.0 |
| B | 12 | 111 | 14230 | 120.87 | 586 | 571 | 113.0 |
| C | 15 | 214 | 213449 | 1598.47 | 570 | 575 | 133.2 |
| C | 7 | 220 | 8990 | 63.19 | 570 | 575 | 133.2 |
| C | 12 | 249 | 6346 | 43.33 | 570 | 575 | 133.2 |
| D | 12 | 6 | 316863 | 2305.88 | 561 | 545 | 137.2 |
| D | 13 | 249 | 266998 | 1942.37 | 561 | 545 | 137.2 |
| D | 1 | 52 | 86547 | 626.93 | 561 | 545 | 137.2 |
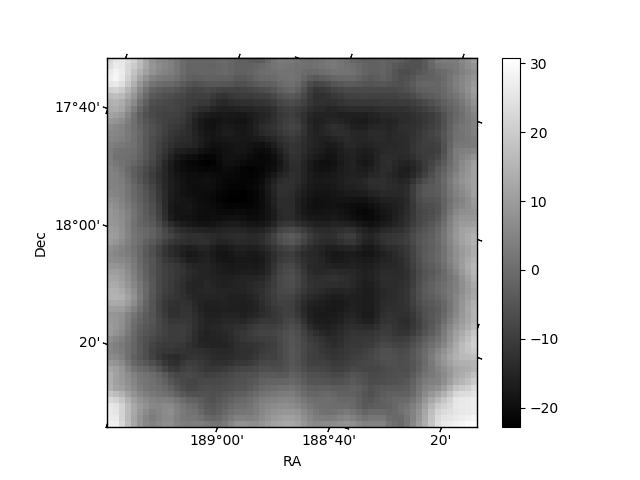
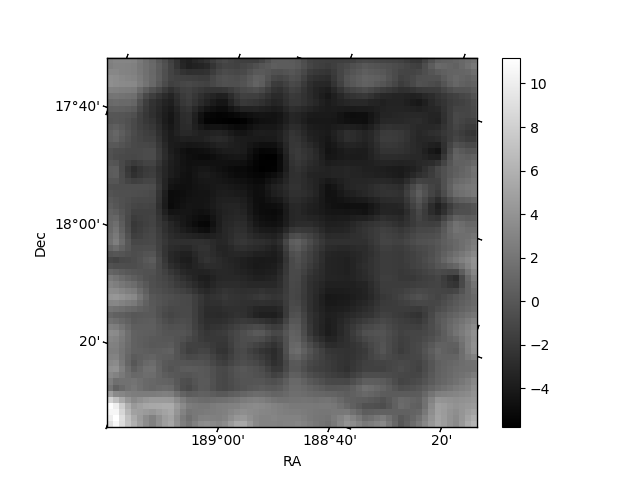
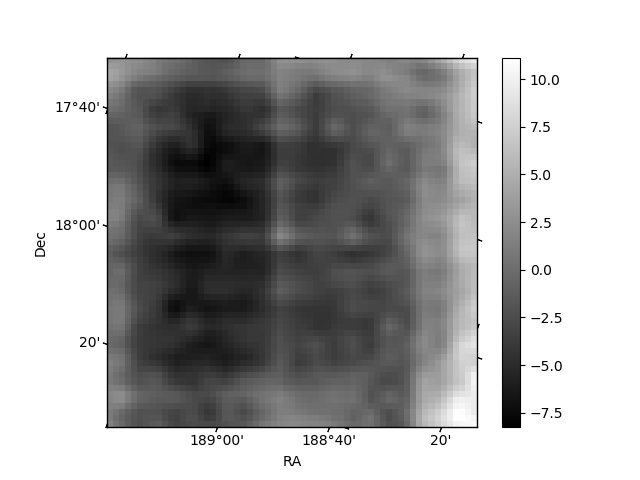
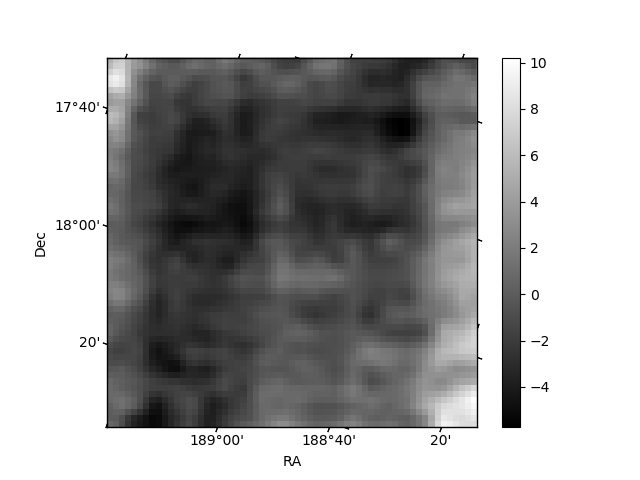
Histogram calculated using DETX and DETY for each event in the final _common_clean file
| Quadrant A | 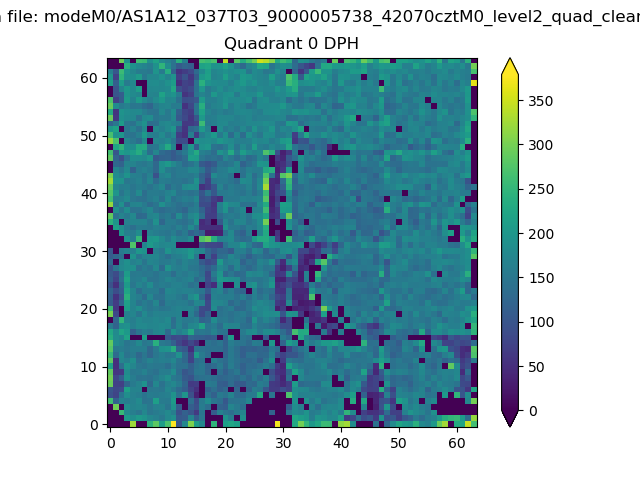 |
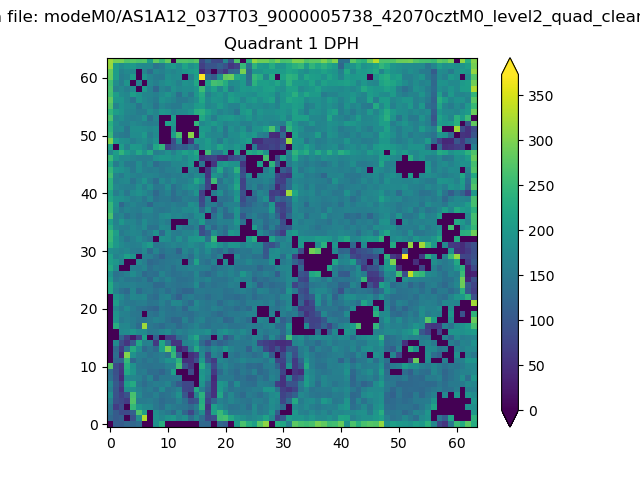 |
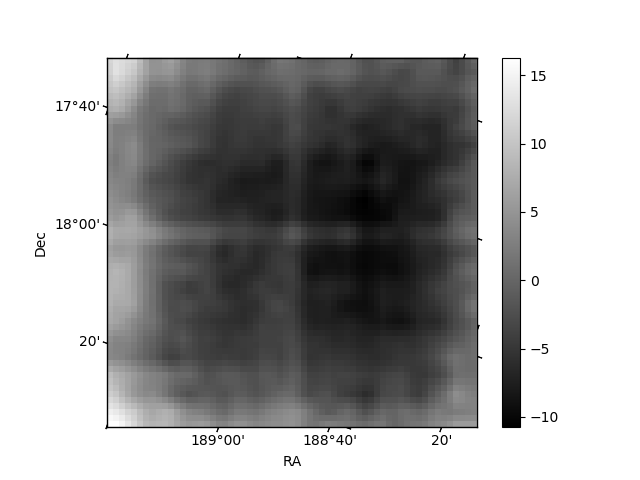
Quadrant B |
|---|---|---|---|
| Quadrant D | 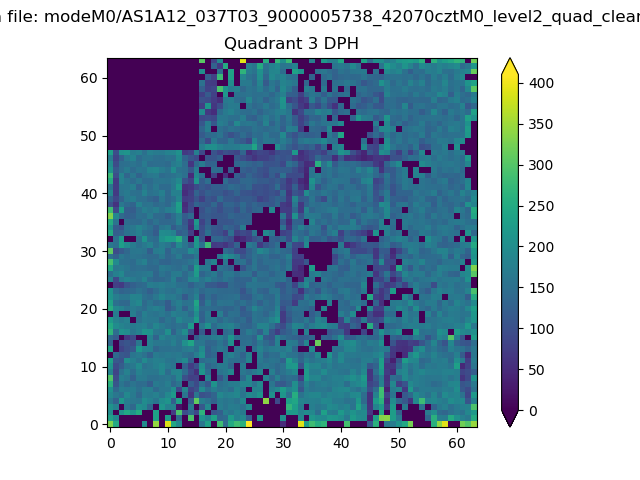 |
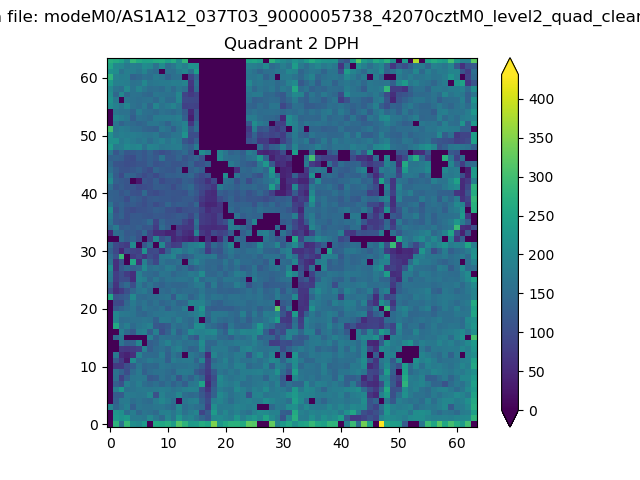 |
Quadrant C |
| Plot type | Count rate plots | Images |
|---|---|---|
| Comparison with Poisson distribution Blue bars denote a histogram of data divided into 1 sec bins. Red curve is a Poisson curve with rate = median count rate of data. |
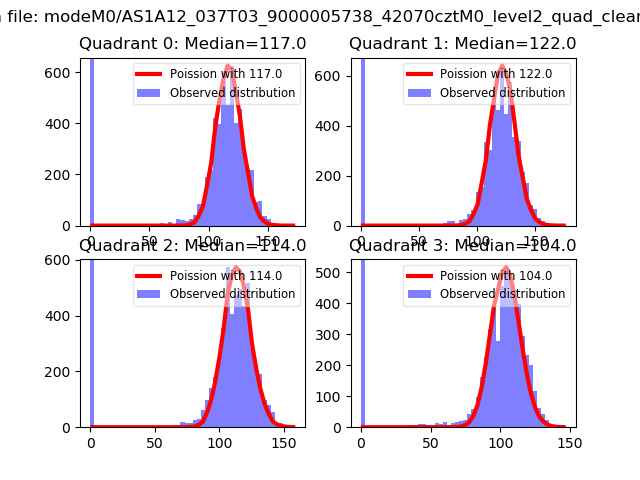 |
 |
| Quadrant-wise count rates Data is divided into 100 sec bins |
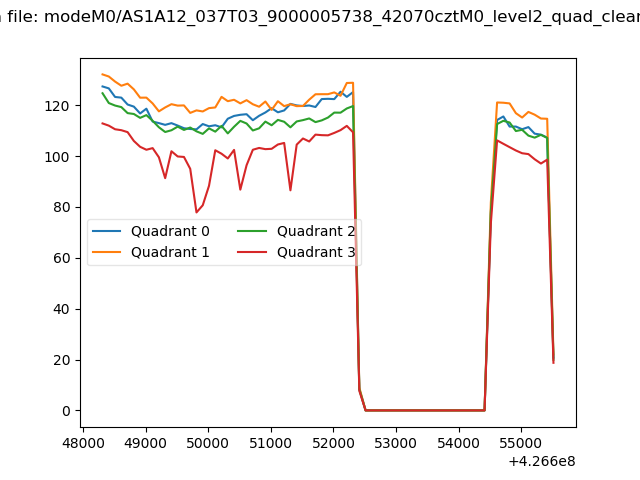 |
|
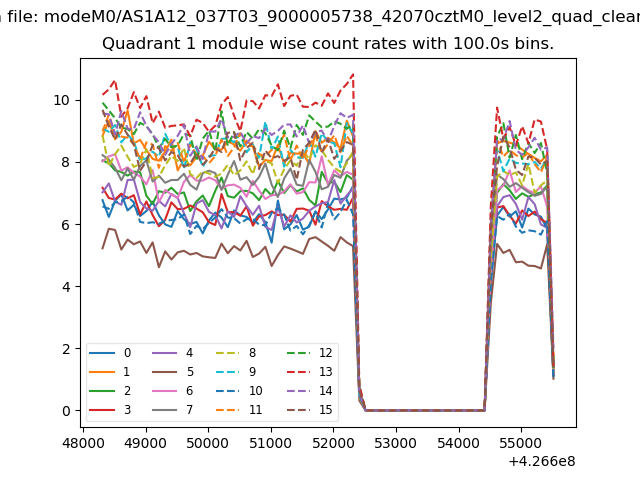
| Module-wise count rates for Quadrant A Data is divided into 100 sec bins |
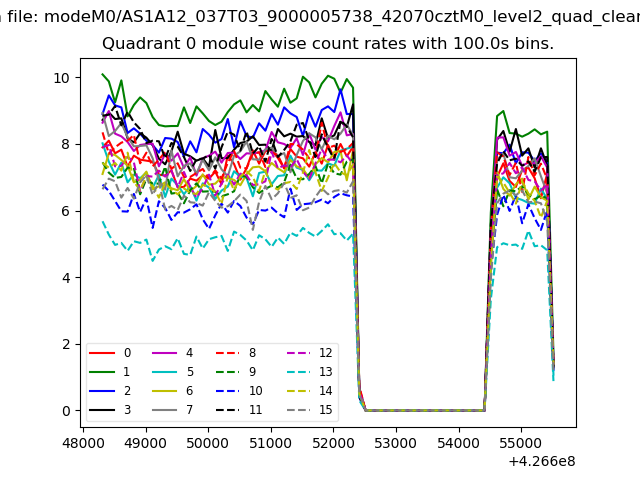 |
 |
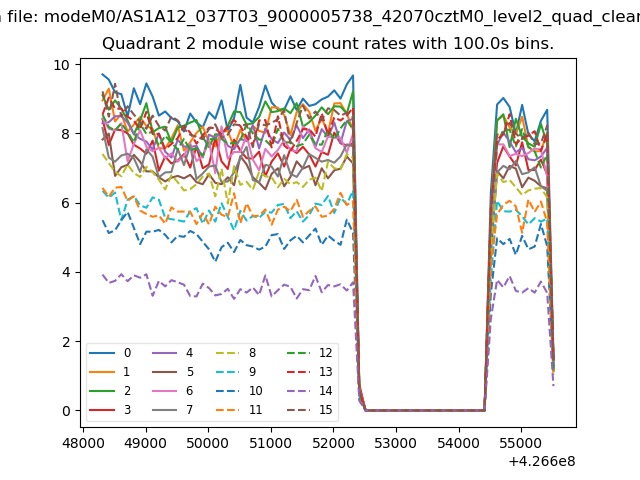
| Module-wise count rates for Quadrant B Data is divided into 100 sec bins |
 |
 |
| Module-wise count rates for Quadrant C Data is divided into 100 sec bins |
 |
 |
| Module-wise count rates for Quadrant D Data is divided into 100 sec bins |
 |
 |
| Parameter | Plot |
|---|---|
| CZT HV Monitor | 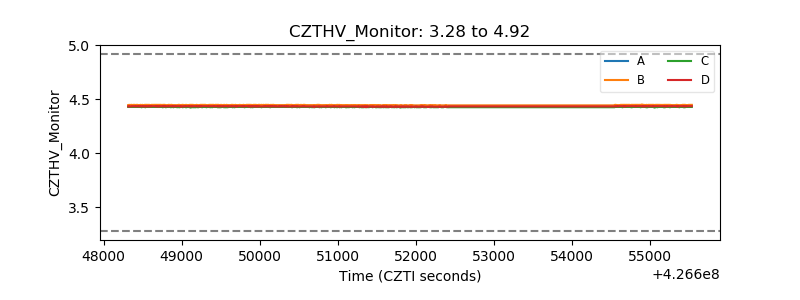 |
| D_VDD | 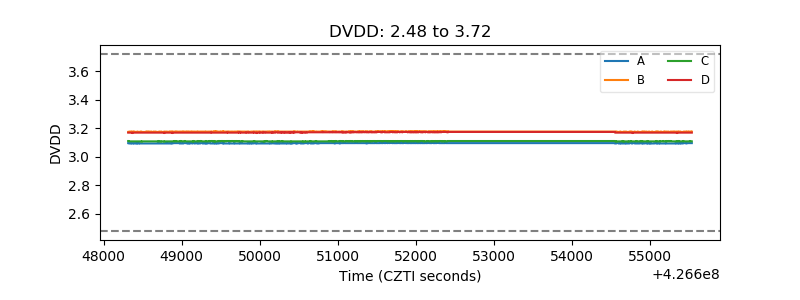 |
| Temperature 1 | 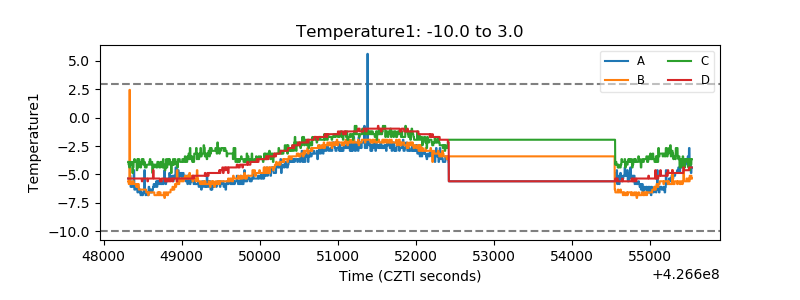 |
| Veto HV Monitor |  |
| Veto LLD | 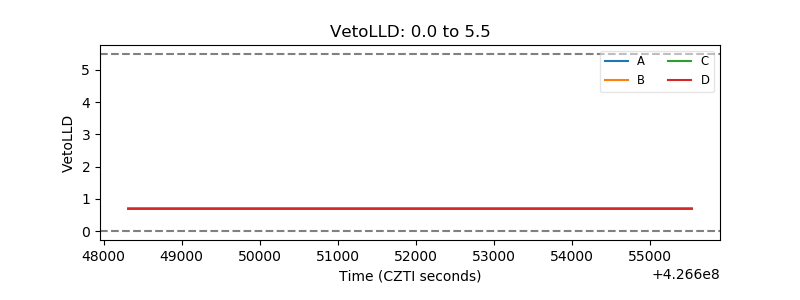 |
| Alpha Counter | 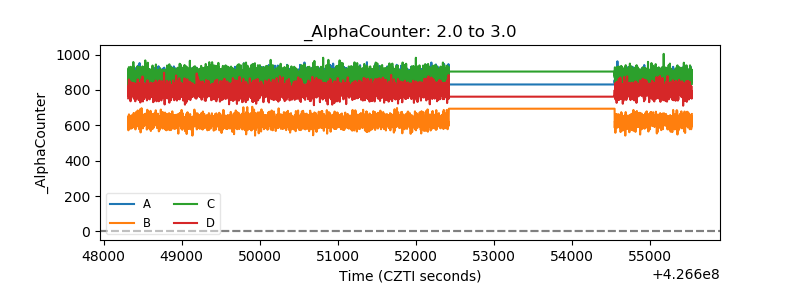 |
| _CPM_Rate | 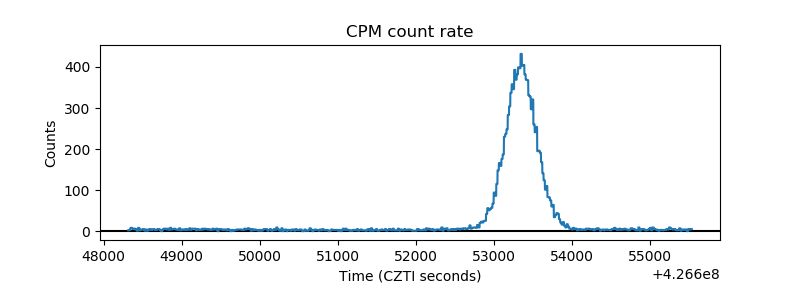 |
| CZT Counter | 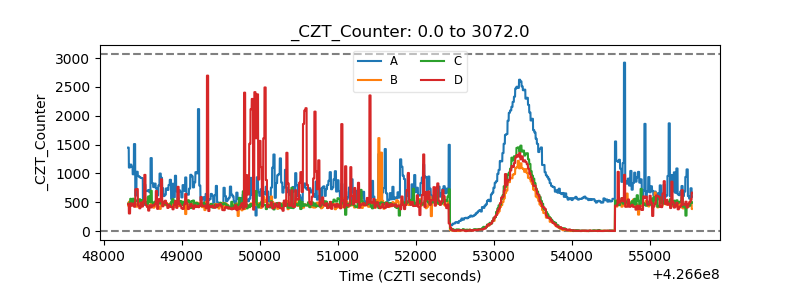 |
| +2.5 Volts monitor | 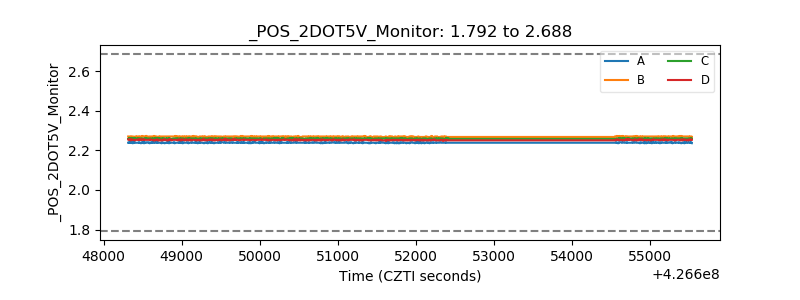 |
| +5 Volts monitor | 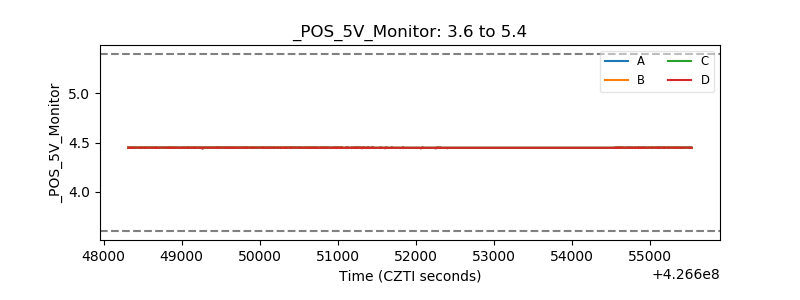 |
| _ROLL_ROT | 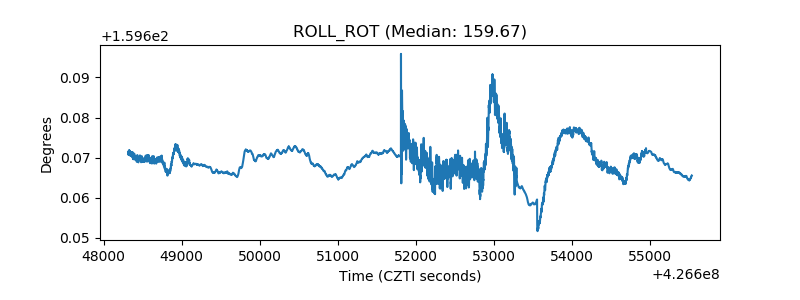 |
| _Roll_DEC | 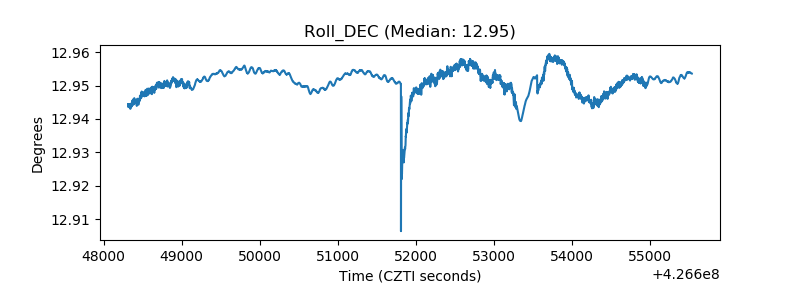 |
| _Roll_RA | 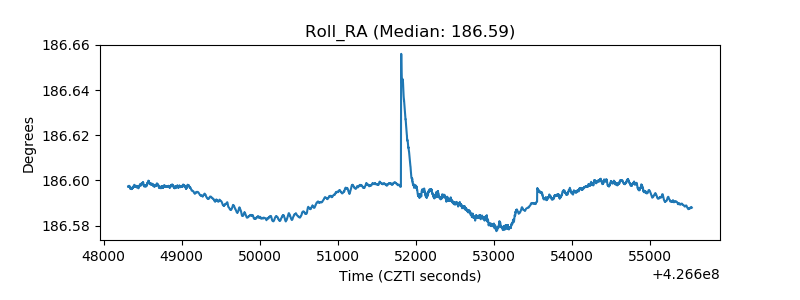 |
| Veto Counter |  |