| Param | Original file | Final file |
|---|---|---|
| Filename | modeM0/AS1A12_037T03_9000005738_42071cztM0_level2.fits | modeM0/AS1A12_037T03_9000005738_42071cztM0_level2_quad_clean.evt |
| Size (bytes) | 332,942,400 | 83,741,760 |
| Size | 317.5 MB | 79.9 MB |
| Events in quadrant A | 4,357,114 | 556,495 |
| Events in quadrant B | 2,354,796 | 583,916 |
| Events in quadrant C | 2,396,224 | 547,840 |
| Events in quadrant D | 2,825,827 | 495,877 |
| Mode SS | |||
|---|---|---|---|
| Quadrant | BADHDUFLAG | Total packets | Discarded packets |
| A | 0 | 102 | 0 |
| B | 0 | 102 | 0 |
| C | 0 | 102 | 0 |
| D | 0 | 102 | 0 |
| Mode M9 | |||
|---|---|---|---|
| Quadrant | BADHDUFLAG | Total packets | Discarded packets |
| A | 0 | 25 | 0 |
| B | 0 | 26 | 0 |
| C | 0 | 26 | 0 |
| D | 0 | 26 | 0 |
| Mode M0 | |||
|---|---|---|---|
| Quadrant | BADHDUFLAG | Total packets | Discarded packets |
| A | 0 | 16596 | 2 |
| B | 0 | 10414 | 2 |
| C | 0 | 10119 | 2 |
| D | 0 | 11847 | 2 |
| Quadrant | Total seconds | Saturated seconds | Saturation percentage |
|---|---|---|---|
| A | 5017 | 109 | 2.172613% |
| B | 5017 | 23 | 0.458441% |
| C | 5017 | 5 | 0.099661% |
| D | 5016 | 120 | 2.392344% |
Noise dominated data is calculated using 1-second bins in cleaned event files. If a bin has >2000 counts, and if more than 50% of those come from <1% of pixels, then it is considered to be noise-dominated and hence unusable.
| Quadrant | # 1 sec bins | Bins with >0 counts | Bins with >2000 counts | High rate bins dominated by noise | Noise dominated (total time) | Noise dominated (detector-on time) | Marked lightcurve |
|---|---|---|---|---|---|---|---|
| A | 7019 | 5018 | 79 | 79 | 1.13% | 1.57% | 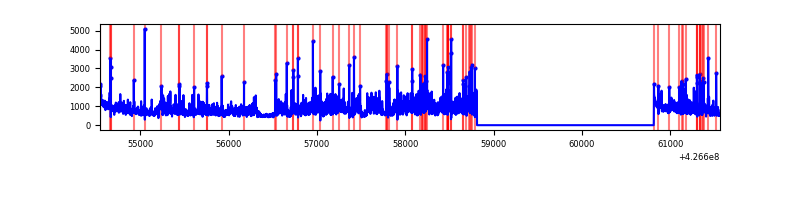 |
| B | 7019 | 5018 | 10 | 10 | 0.14% | 0.20% | 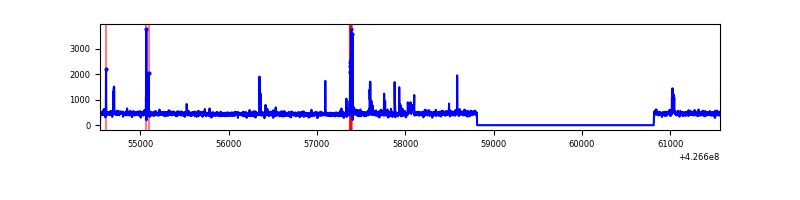 |
| C | 7019 | 5018 | 0 | 0 | 0.00% | 0.00% | 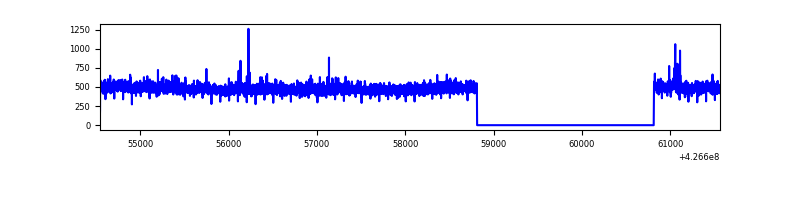 |
| D | 7018 | 5017 | 84 | 84 | 1.20% | 1.67% | 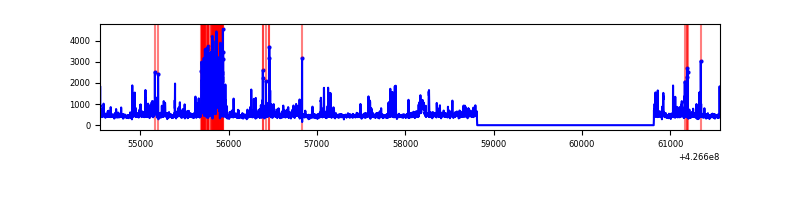 |
Top three noisy pixels from each quadrant. If the there are fewer than three noisy pixels in the level2.evt file, extra rows are filled as -1
| Pixel properties | Quadrant properties | ||||||
|---|---|---|---|---|---|---|---|
| Quadrant | DetID | PixID | Counts | Sigma | Mean | Median | Sigma |
| A | 15 | 222 | 1599337 | 13855.72 | 561 | 550 | 115.4 |
| A | 10 | 83 | 535843 | 4639.06 | 561 | 550 | 115.4 |
| A | 15 | 223 | 34375 | 293.14 | 561 | 550 | 115.4 |
| B | 3 | 112 | 67380 | 615.03 | 562 | 548 | 108.7 |
| B | 15 | 85 | 51875 | 472.34 | 562 | 548 | 108.7 |
| B | 5 | 255 | 27736 | 250.2 | 562 | 548 | 108.7 |
| C | 15 | 214 | 211744 | 1633.86 | 549 | 552 | 129.3 |
| C | 7 | 220 | 16616 | 124.28 | 549 | 552 | 129.3 |
| C | 12 | 249 | 15230 | 113.55 | 549 | 552 | 129.3 |
| D | 12 | 6 | 281596 | 2093.32 | 544 | 529 | 134.3 |
| D | 1 | 52 | 136879 | 1015.5 | 544 | 529 | 134.3 |
| D | 12 | 217 | 93604 | 693.2 | 544 | 529 | 134.3 |
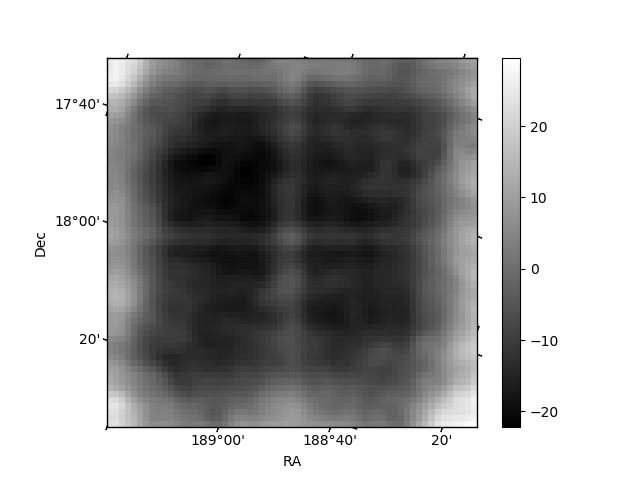
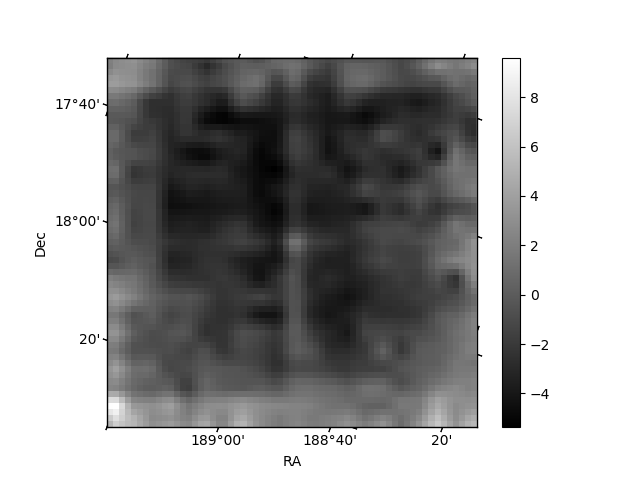
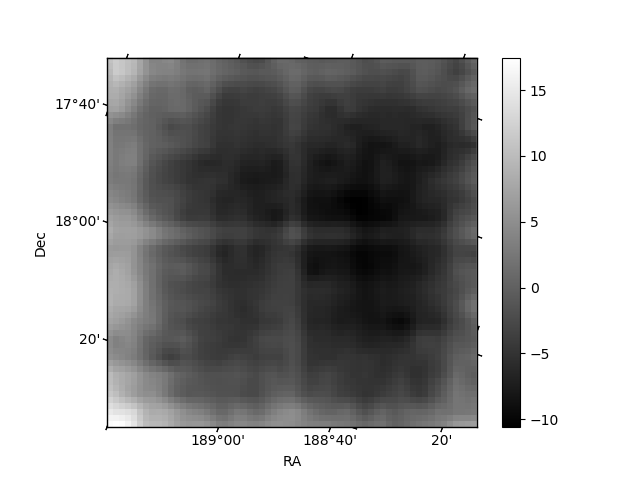
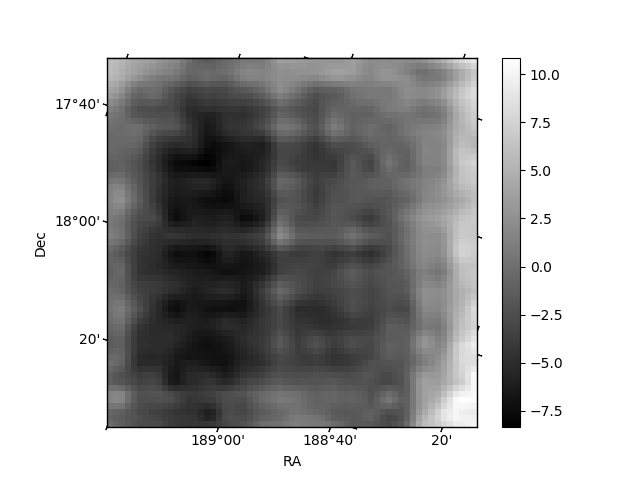
Histogram calculated using DETX and DETY for each event in the final _common_clean file
| Quadrant A | 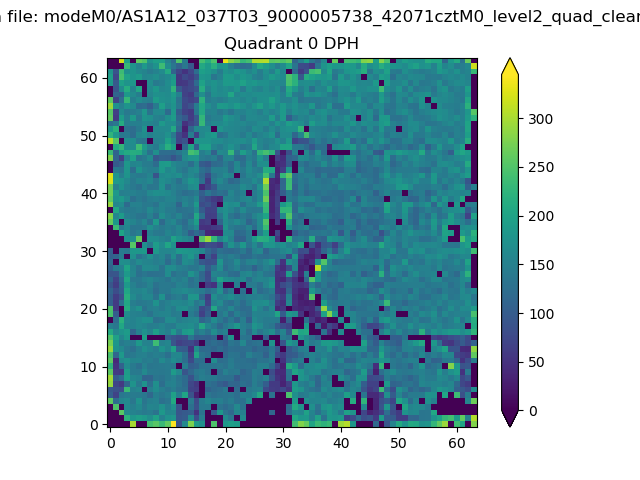 |
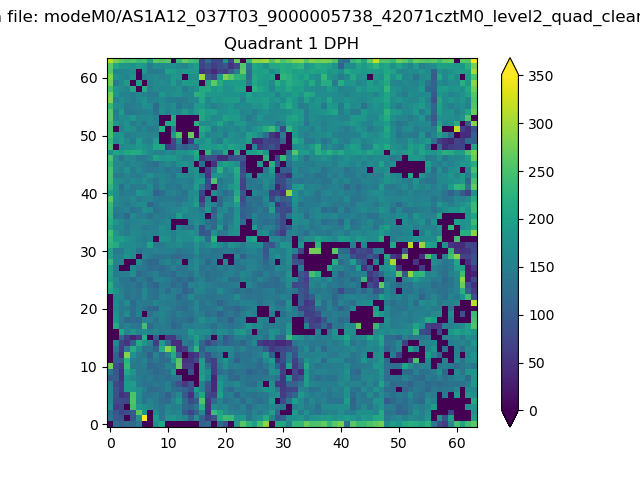 |
Quadrant B |
|---|---|---|---|
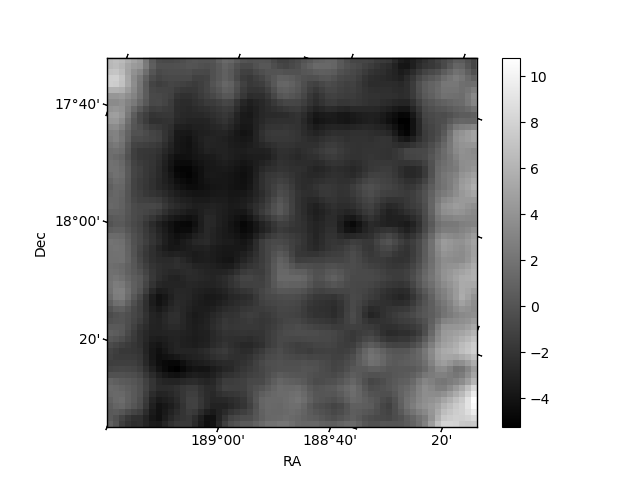
| Quadrant D | 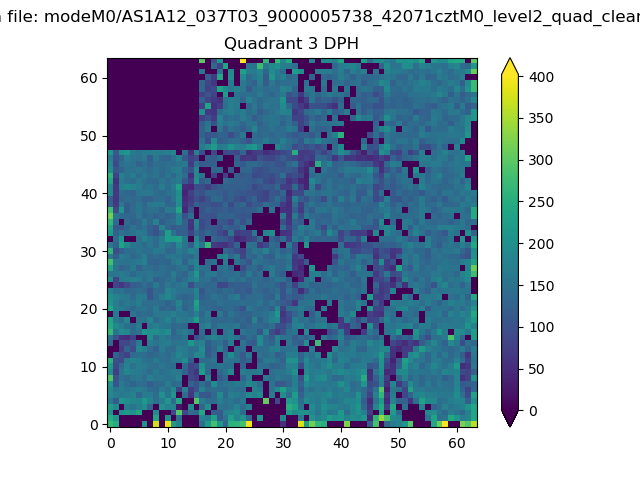 |
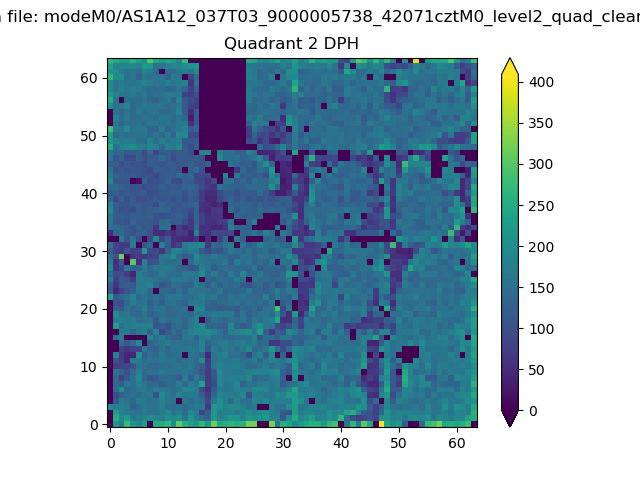 |
Quadrant C |
| Plot type | Count rate plots | Images |
|---|---|---|
| Comparison with Poisson distribution Blue bars denote a histogram of data divided into 1 sec bins. Red curve is a Poisson curve with rate = median count rate of data. |
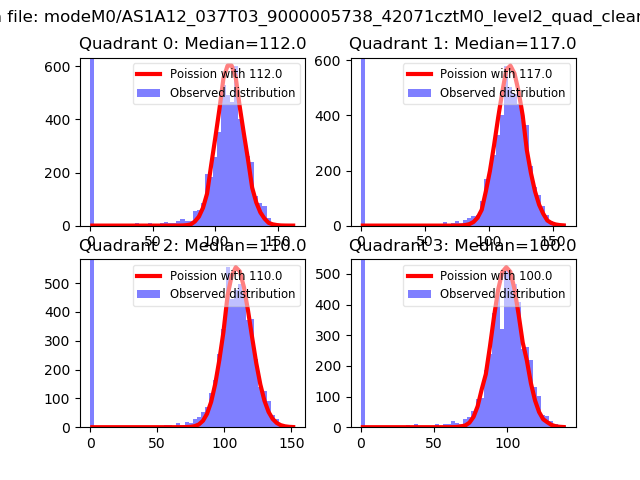 |
 |
| Quadrant-wise count rates Data is divided into 100 sec bins |
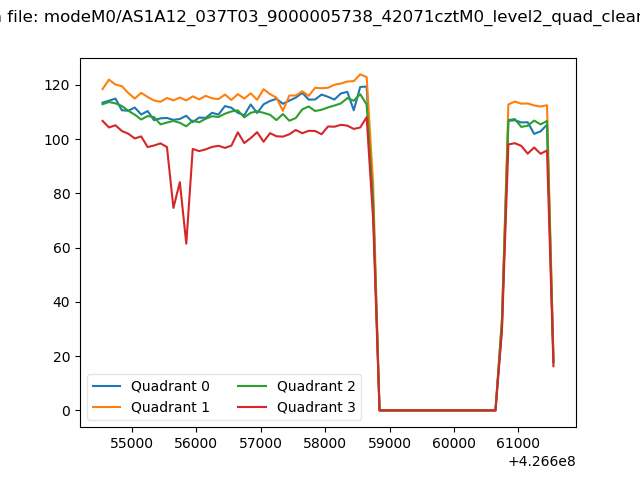 |
|
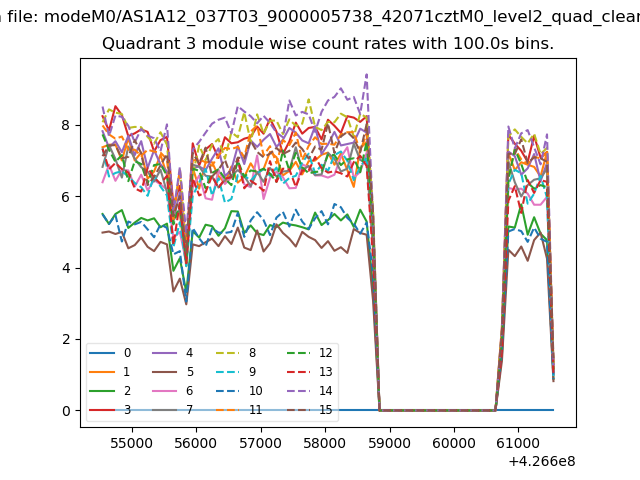
| Module-wise count rates for Quadrant A Data is divided into 100 sec bins |
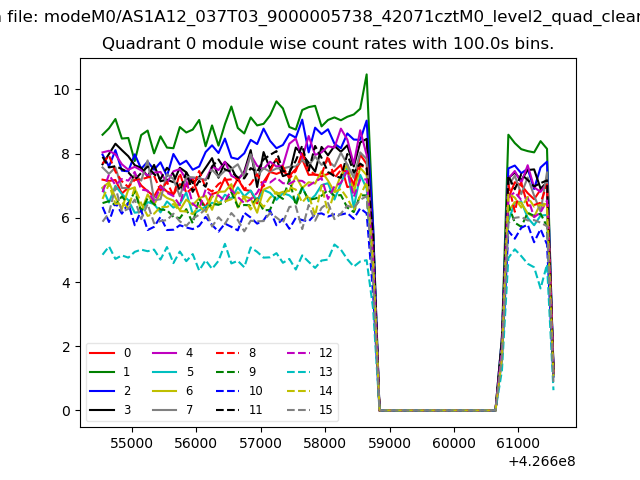 |
 |
| Module-wise count rates for Quadrant B Data is divided into 100 sec bins |
 |
 |
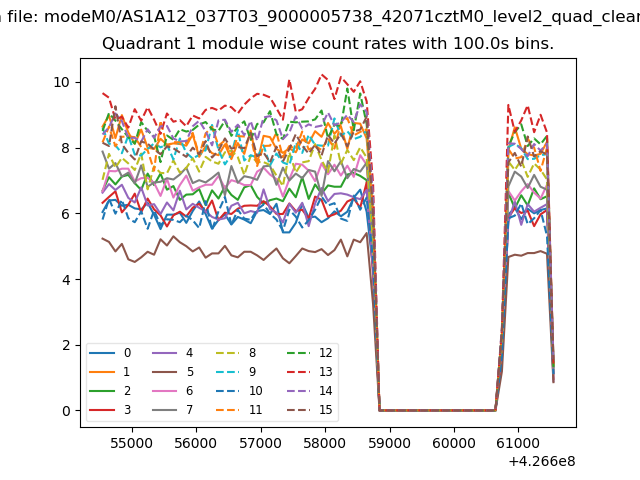
| Module-wise count rates for Quadrant C Data is divided into 100 sec bins |
 |
 |
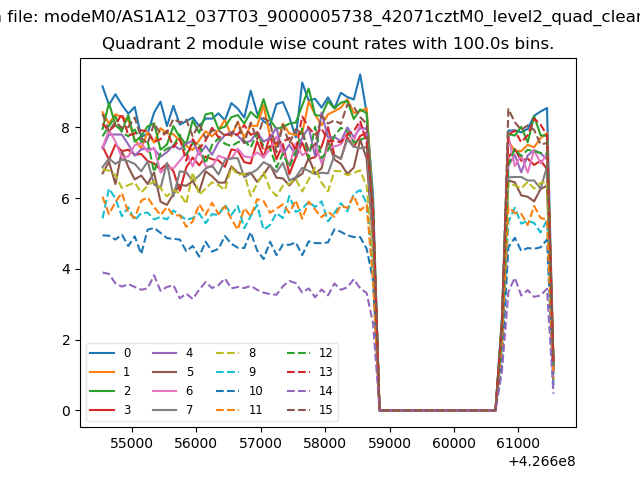
| Module-wise count rates for Quadrant D Data is divided into 100 sec bins |
 |
 |
| Parameter | Plot |
|---|---|
| CZT HV Monitor | 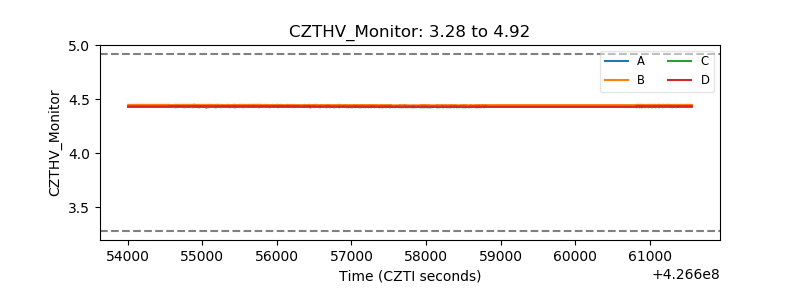 |
| D_VDD | 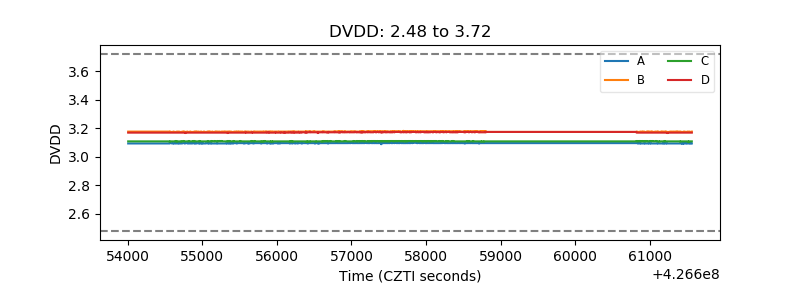 |
| Temperature 1 | 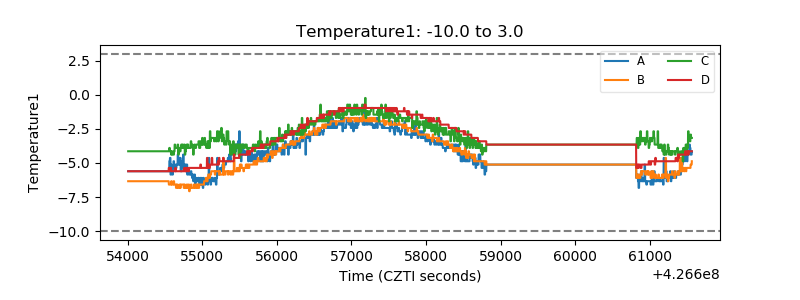 |
| Veto HV Monitor |  |
| Veto LLD | 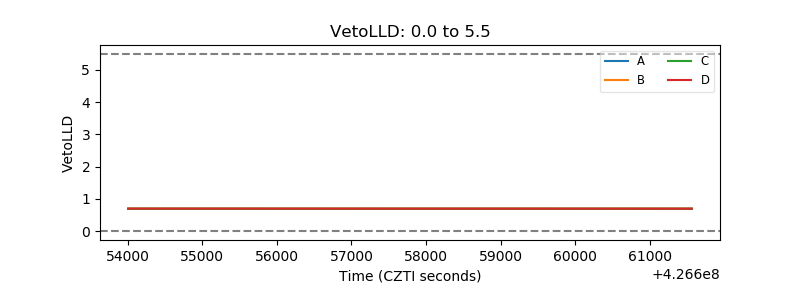 |
| Alpha Counter |  |
| _CPM_Rate |  |
| CZT Counter | 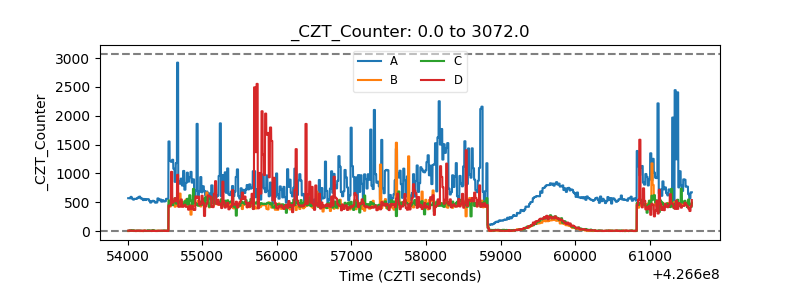 |
| +2.5 Volts monitor | 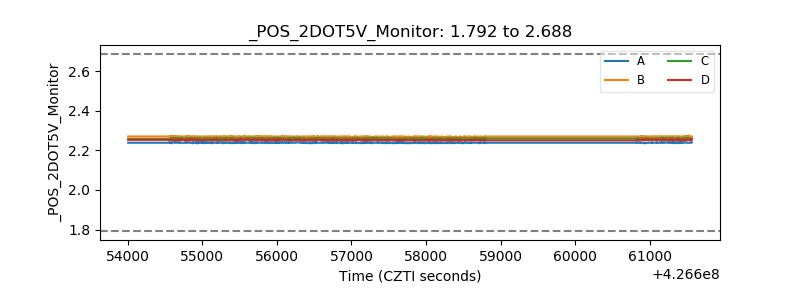 |
| +5 Volts monitor | 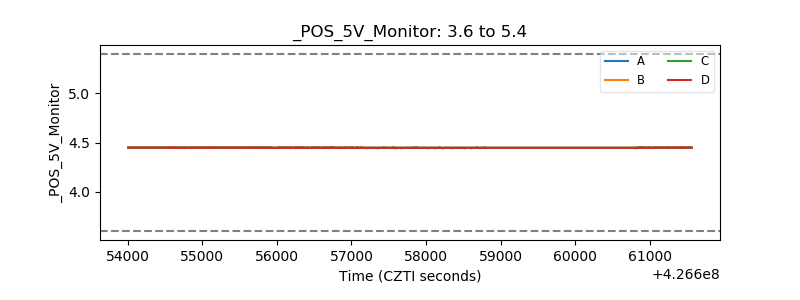 |
| _ROLL_ROT | 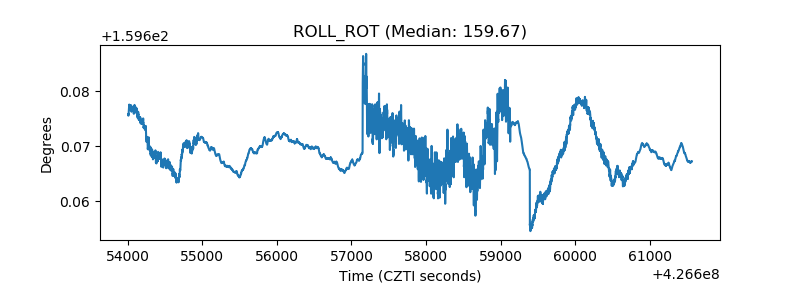 |
| _Roll_DEC | 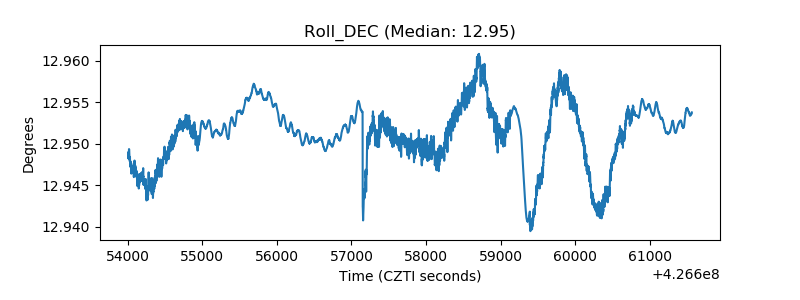 |
| _Roll_RA | 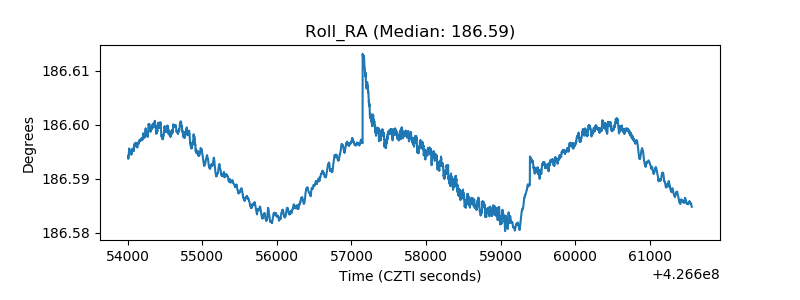 |
| Veto Counter | 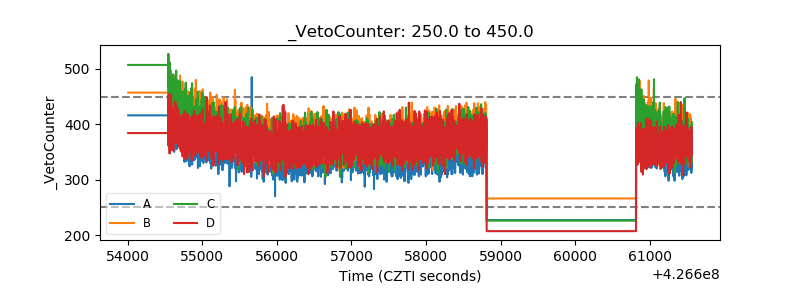 |