| Param | Original file | Final file |
|---|---|---|
| Filename | modeM0/AS1A12_037T03_9000005738_42073cztM0_level2.fits | modeM0/AS1A12_037T03_9000005738_42073cztM0_level2_quad_clean.evt |
| Size (bytes) | 368,697,600 | 94,383,360 |
| Size | 351.6 MB | 90.0 MB |
| Events in quadrant A | 3,850,993 | 629,311 |
| Events in quadrant B | 2,607,719 | 651,030 |
| Events in quadrant C | 2,716,351 | 617,701 |
| Events in quadrant D | 4,021,832 | 554,541 |
| Mode SS | |||
|---|---|---|---|
| Quadrant | BADHDUFLAG | Total packets | Discarded packets |
| A | 0 | 120 | 0 |
| B | 0 | 120 | 0 |
| C | 0 | 120 | 0 |
| D | 0 | 120 | 0 |
| Mode M9 | |||
|---|---|---|---|
| Quadrant | BADHDUFLAG | Total packets | Discarded packets |
| A | 0 | 31 | 0 |
| B | 0 | 31 | 0 |
| C | 0 | 31 | 0 |
| D | 0 | 31 | 0 |
| Mode M0 | |||
|---|---|---|---|
| Quadrant | BADHDUFLAG | Total packets | Discarded packets |
| A | 0 | 14938 | 2 |
| B | 0 | 11879 | 2 |
| C | 0 | 11675 | 2 |
| D | 0 | 15902 | 2 |
| Quadrant | Total seconds | Saturated seconds | Saturation percentage |
|---|---|---|---|
| A | 5796 | 82 | 1.414769% |
| B | 5797 | 24 | 0.414007% |
| C | 5797 | 3 | 0.051751% |
| D | 5797 | 206 | 3.553562% |
Noise dominated data is calculated using 1-second bins in cleaned event files. If a bin has >2000 counts, and if more than 50% of those come from <1% of pixels, then it is considered to be noise-dominated and hence unusable.
| Quadrant | # 1 sec bins | Bins with >0 counts | Bins with >2000 counts | High rate bins dominated by noise | Noise dominated (total time) | Noise dominated (detector-on time) | Marked lightcurve |
|---|---|---|---|---|---|---|---|
| A | 8870 | 5798 | 97 | 97 | 1.09% | 1.67% | 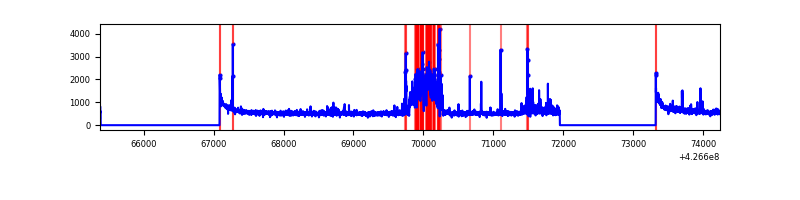 |
| B | 8871 | 5799 | 7 | 7 | 0.08% | 0.12% | 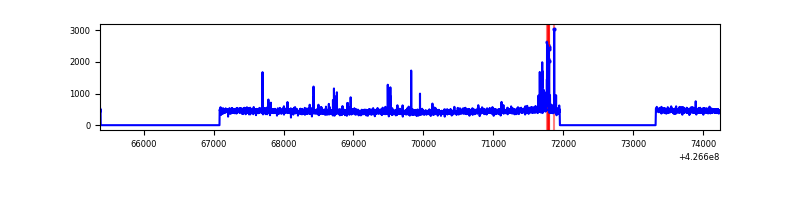 |
| C | 8871 | 5799 | 0 | 0 | 0.00% | 0.00% | 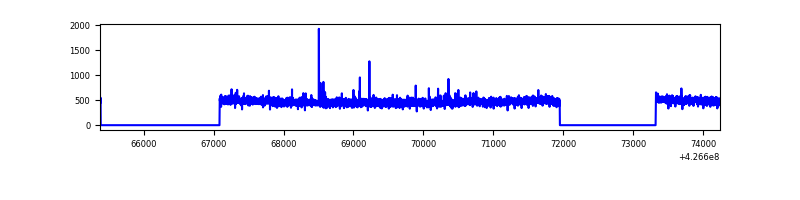 |
| D | 8871 | 5799 | 163 | 163 | 1.84% | 2.81% | 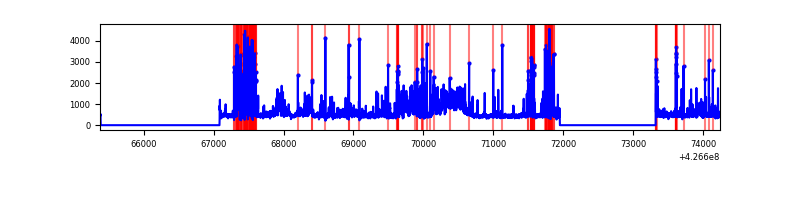 |
Top three noisy pixels from each quadrant. If the there are fewer than three noisy pixels in the level2.evt file, extra rows are filled as -1
| Pixel properties | Quadrant properties | ||||||
|---|---|---|---|---|---|---|---|
| Quadrant | DetID | PixID | Counts | Sigma | Mean | Median | Sigma |
| A | 10 | 83 | 599482 | 4540.24 | 640 | 625 | 131.9 |
| A | 9 | 240 | 481690 | 3647.2 | 640 | 625 | 131.9 |
| A | 15 | 222 | 264540 | 2000.87 | 640 | 625 | 131.9 |
| B | 5 | 255 | 93103 | 731.46 | 638 | 620 | 126.4 |
| B | 12 | 111 | 15805 | 120.1 | 638 | 620 | 126.4 |
| B | 11 | 111 | 14588 | 110.47 | 638 | 620 | 126.4 |
| C | 15 | 214 | 244599 | 1666.74 | 625 | 631 | 146.4 |
| C | 12 | 249 | 17478 | 115.1 | 625 | 631 | 146.4 |
| C | 1 | 241 | 9070 | 57.65 | 625 | 631 | 146.4 |
| D | 12 | 6 | 452505 | 2976.56 | 617 | 599 | 151.8 |
| D | 1 | 47 | 379351 | 2494.72 | 617 | 599 | 151.8 |
| D | 1 | 52 | 291754 | 1917.75 | 617 | 599 | 151.8 |
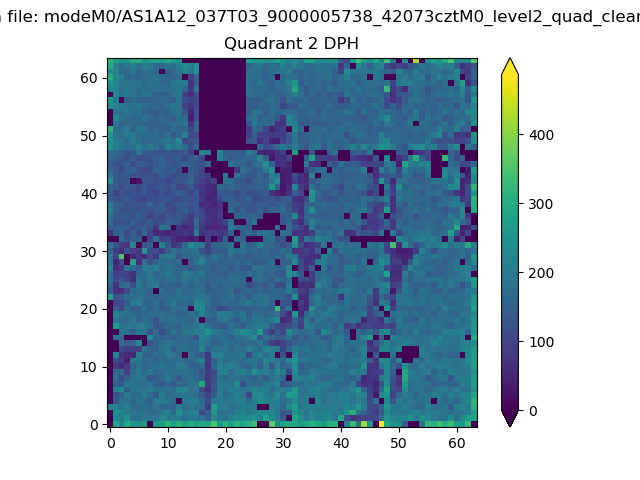
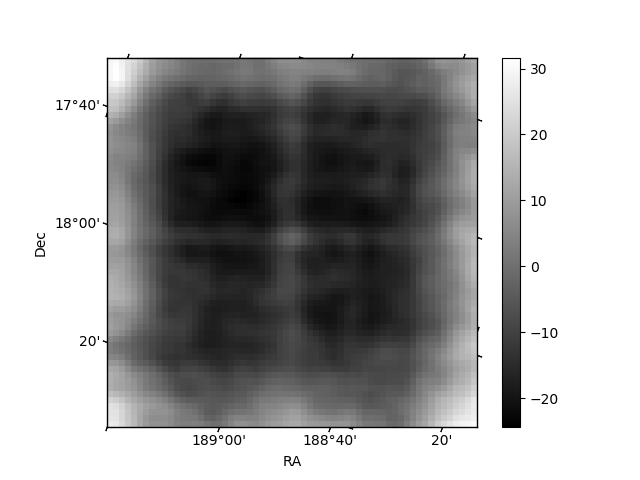
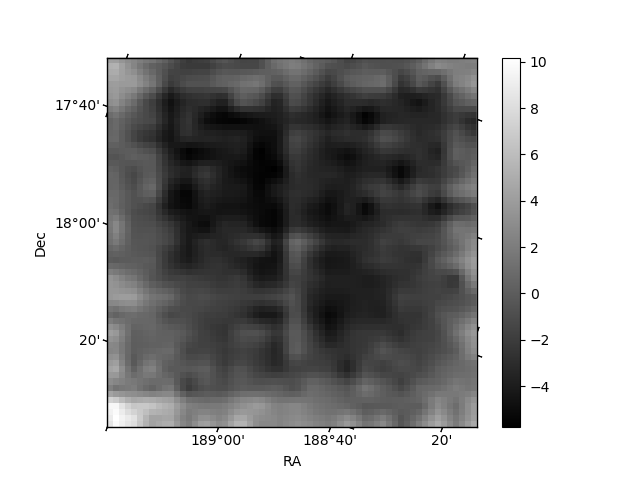
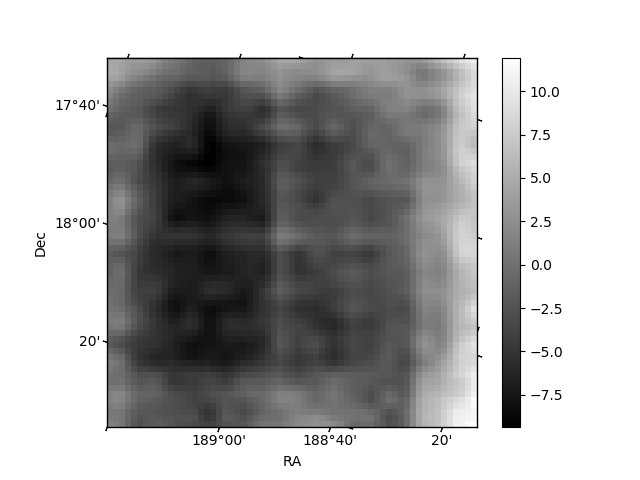
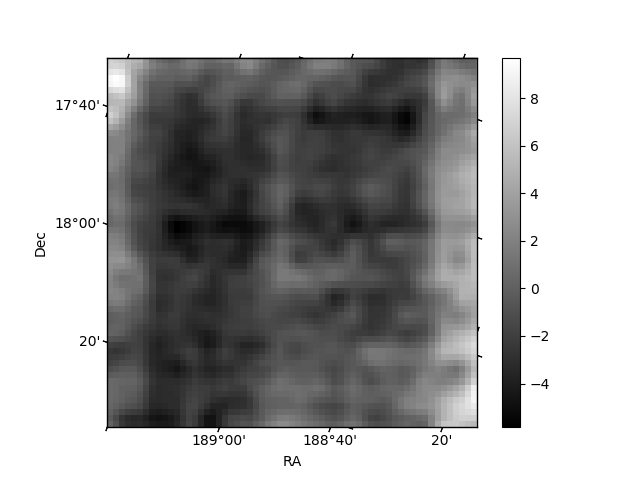
Histogram calculated using DETX and DETY for each event in the final _common_clean file
| Quadrant A | 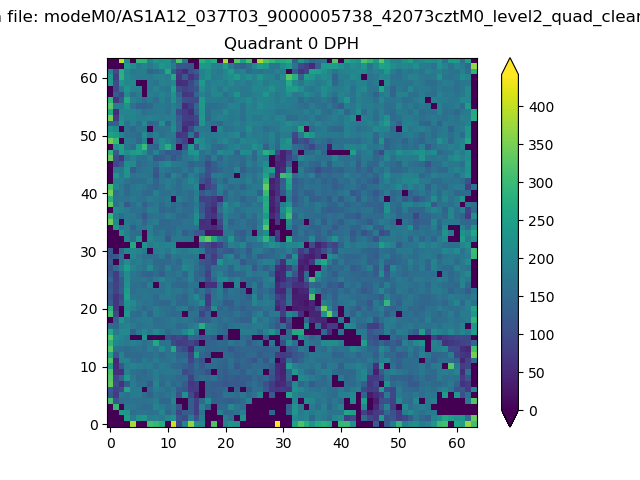 |
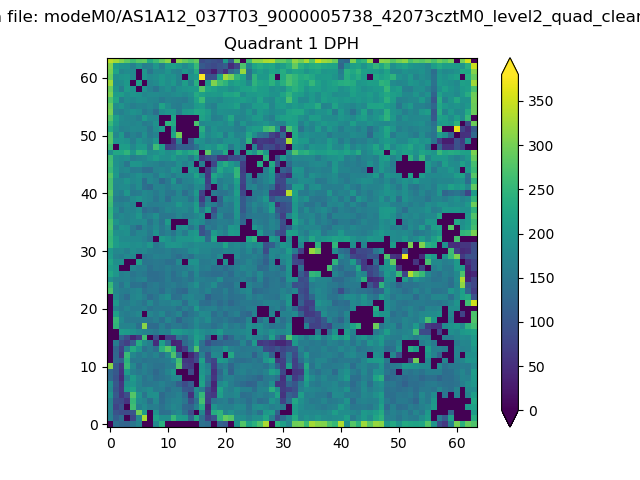 |
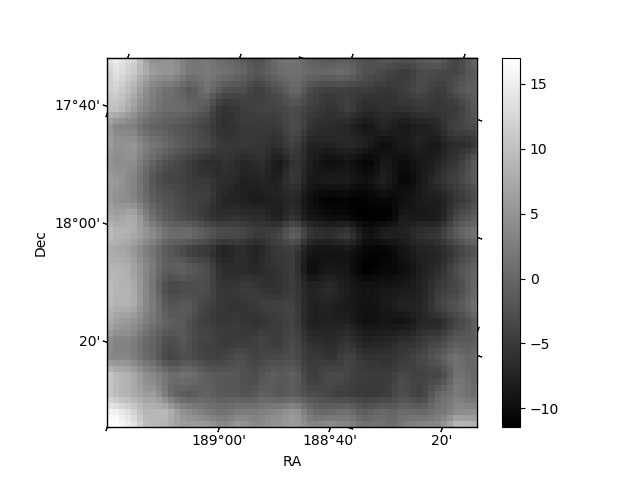
Quadrant B |
|---|---|---|---|
| Quadrant D | 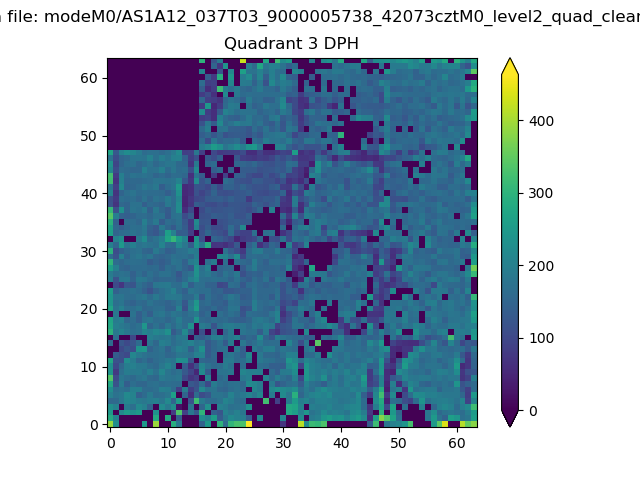 |
 |
Quadrant C |
| Plot type | Count rate plots | Images |
|---|---|---|
| Comparison with Poisson distribution Blue bars denote a histogram of data divided into 1 sec bins. Red curve is a Poisson curve with rate = median count rate of data. |
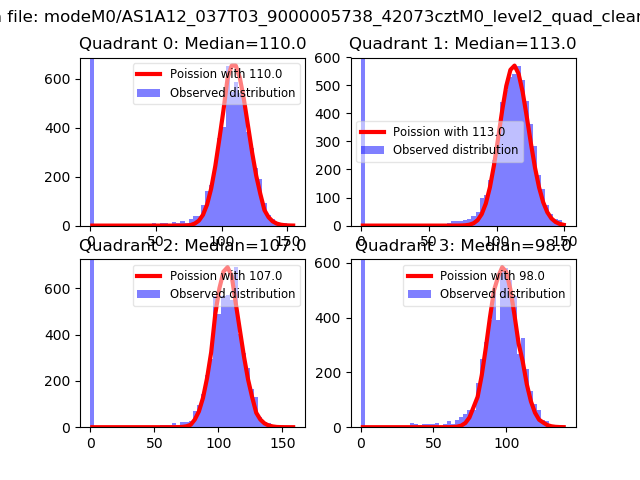 |
 |
| Quadrant-wise count rates Data is divided into 100 sec bins |
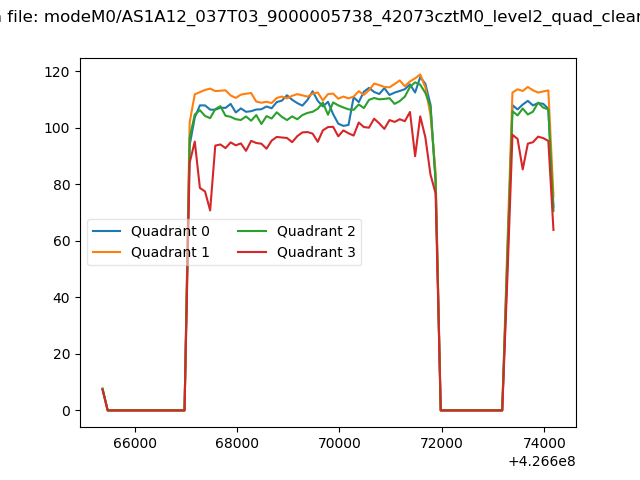 |
|
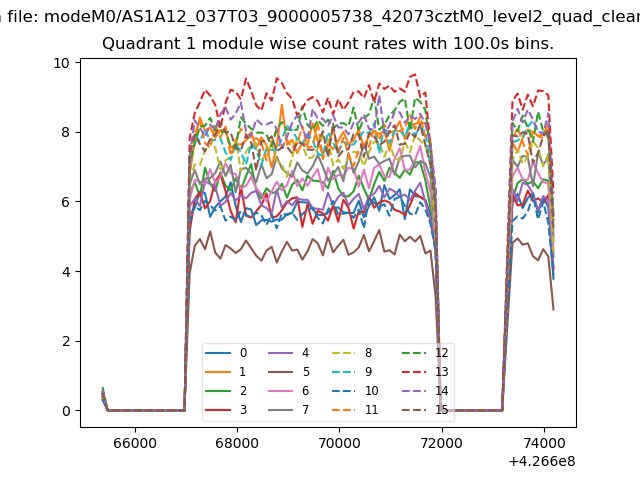
| Module-wise count rates for Quadrant A Data is divided into 100 sec bins |
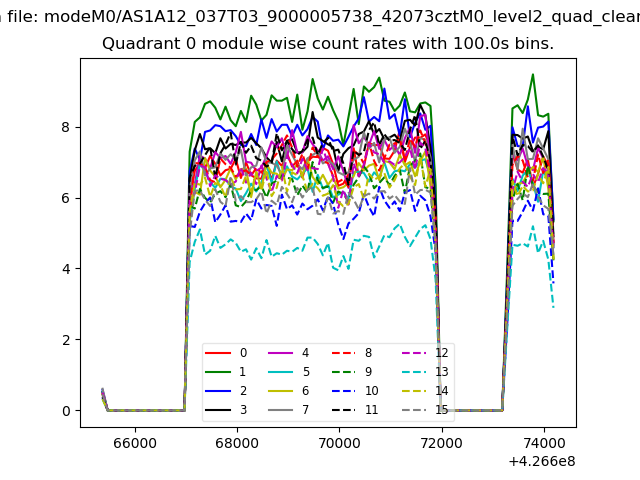 |
 |
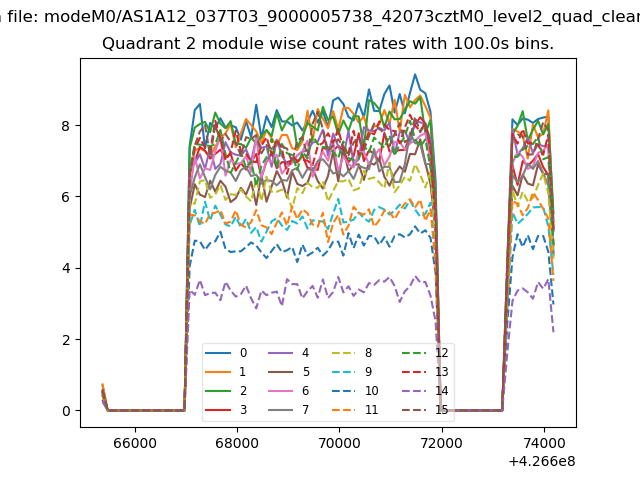
| Module-wise count rates for Quadrant B Data is divided into 100 sec bins |
 |
 |
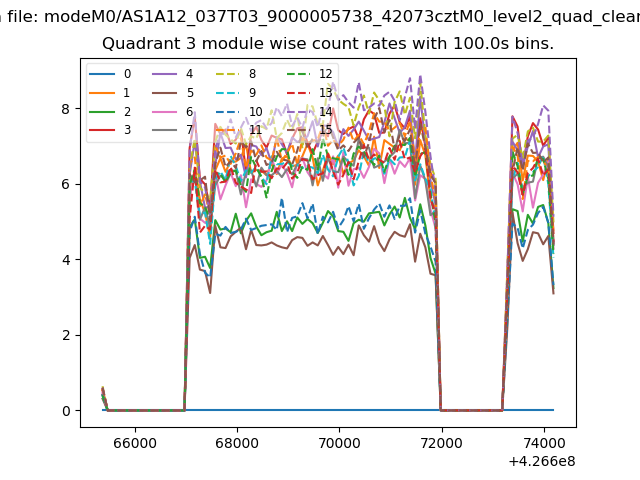
| Module-wise count rates for Quadrant C Data is divided into 100 sec bins |
 |
 |
| Module-wise count rates for Quadrant D Data is divided into 100 sec bins |
 |
 |
| Parameter | Plot |
|---|---|
| CZT HV Monitor |  |
| D_VDD | 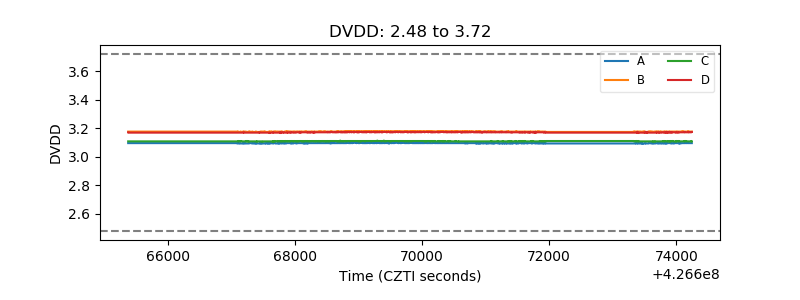 |
| Temperature 1 | 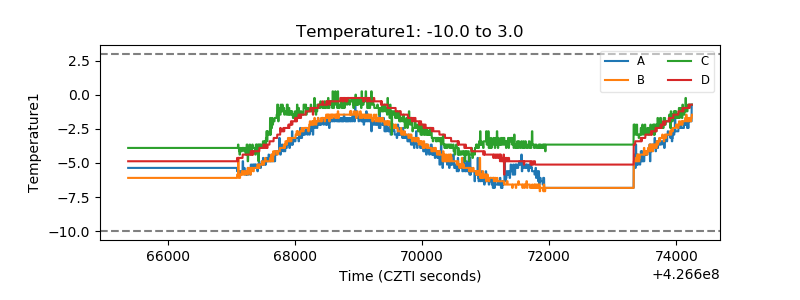 |
| Veto HV Monitor | 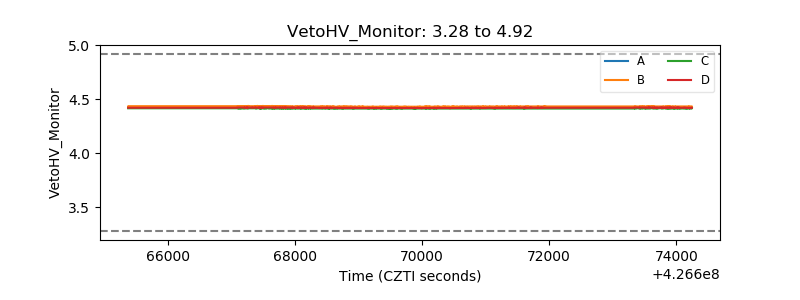 |
| Veto LLD | 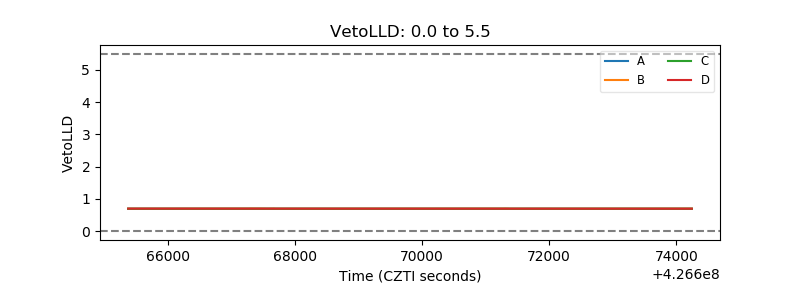 |
| Alpha Counter |  |
| _CPM_Rate |  |
| CZT Counter | 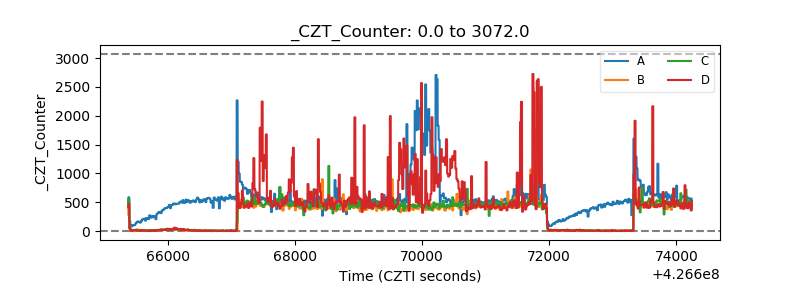 |
| +2.5 Volts monitor | 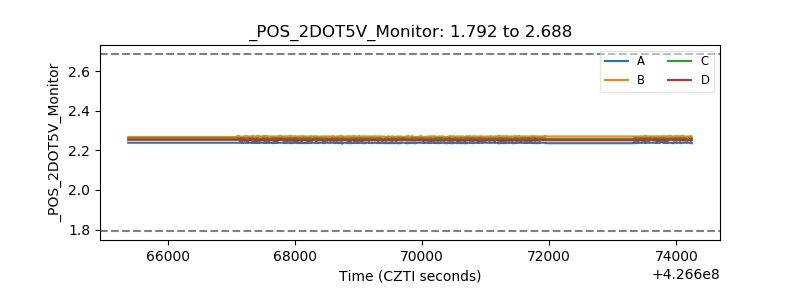 |
| +5 Volts monitor |  |
| _ROLL_ROT | 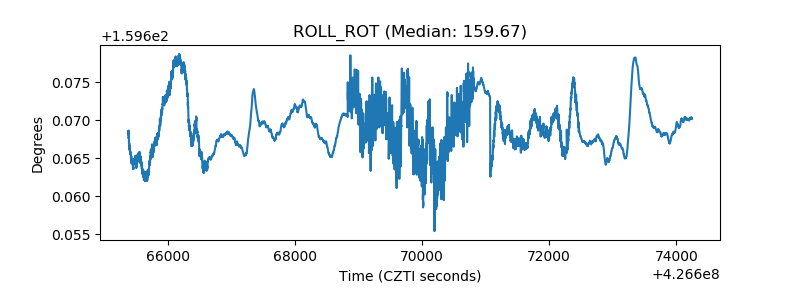 |
| _Roll_DEC | 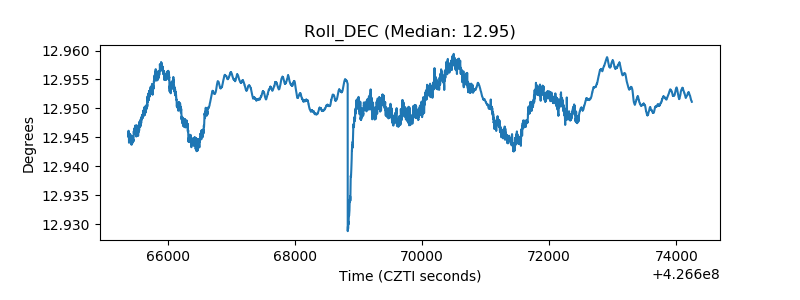 |
| _Roll_RA | 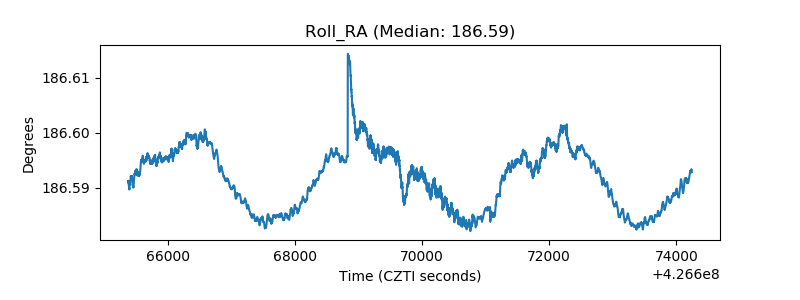 |
| Veto Counter | 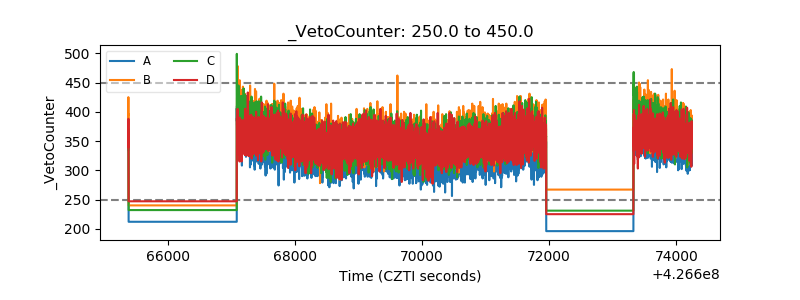 |