| Param | Original file | Final file |
|---|---|---|
| Filename | modeM0/AS1A12_037T03_9000005738_42074cztM0_level2.fits | modeM0/AS1A12_037T03_9000005738_42074cztM0_level2_quad_clean.evt |
| Size (bytes) | 361,598,400 | 97,678,080 |
| Size | 344.8 MB | 93.2 MB |
| Events in quadrant A | 4,075,315 | 649,727 |
| Events in quadrant B | 2,686,308 | 669,820 |
| Events in quadrant C | 2,793,430 | 636,228 |
| Events in quadrant D | 3,361,201 | 580,612 |
| Mode SS | |||
|---|---|---|---|
| Quadrant | BADHDUFLAG | Total packets | Discarded packets |
| A | 0 | 124 | 0 |
| B | 0 | 124 | 0 |
| C | 0 | 124 | 0 |
| D | 0 | 124 | 0 |
| Mode M9 | |||
|---|---|---|---|
| Quadrant | BADHDUFLAG | Total packets | Discarded packets |
| A | 0 | 16 | 0 |
| B | 0 | 17 | 0 |
| C | 0 | 17 | 0 |
| D | 0 | 17 | 0 |
| Mode M0 | |||
|---|---|---|---|
| Quadrant | BADHDUFLAG | Total packets | Discarded packets |
| A | 0 | 15984 | 2 |
| B | 0 | 12271 | 2 |
| C | 0 | 12114 | 2 |
| D | 0 | 14164 | 2 |
| Quadrant | Total seconds | Saturated seconds | Saturation percentage |
|---|---|---|---|
| A | 6024 | 58 | 0.962815% |
| B | 6024 | 20 | 0.332005% |
| C | 6024 | 4 | 0.066401% |
| D | 6024 | 112 | 1.859230% |
Noise dominated data is calculated using 1-second bins in cleaned event files. If a bin has >2000 counts, and if more than 50% of those come from <1% of pixels, then it is considered to be noise-dominated and hence unusable.
| Quadrant | # 1 sec bins | Bins with >0 counts | Bins with >2000 counts | High rate bins dominated by noise | Noise dominated (total time) | Noise dominated (detector-on time) | Marked lightcurve |
|---|---|---|---|---|---|---|---|
| A | 7308 | 6025 | 33 | 33 | 0.45% | 0.55% | 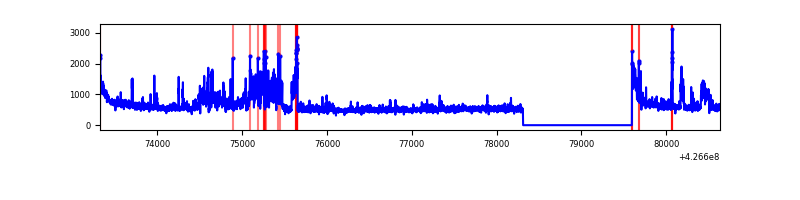 |
| B | 7308 | 6025 | 10 | 10 | 0.14% | 0.17% | 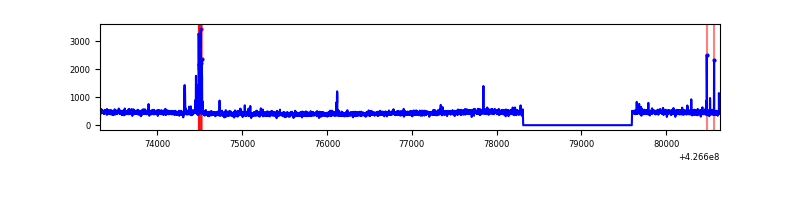 |
| C | 7308 | 6025 | 0 | 0 | 0.00% | 0.00% | 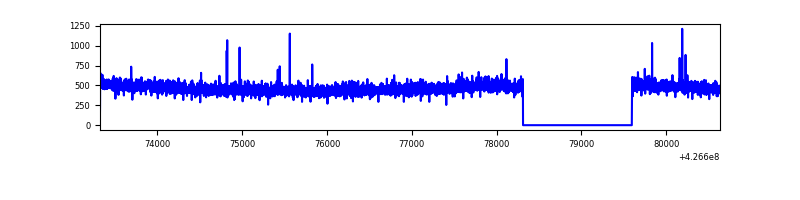 |
| D | 7308 | 6025 | 94 | 94 | 1.29% | 1.56% | 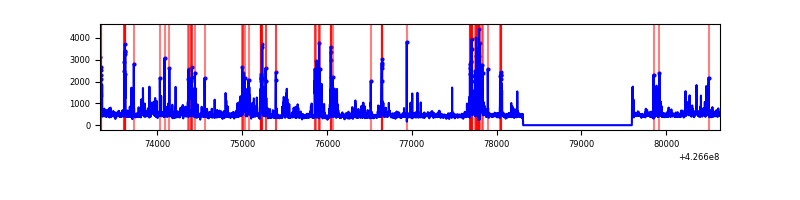 |
Top three noisy pixels from each quadrant. If the there are fewer than three noisy pixels in the level2.evt file, extra rows are filled as -1
| Pixel properties | Quadrant properties | ||||||
|---|---|---|---|---|---|---|---|
| Quadrant | DetID | PixID | Counts | Sigma | Mean | Median | Sigma |
| A | 15 | 222 | 782590 | 5718.8 | 665 | 651 | 136.7 |
| A | 10 | 83 | 624041 | 4559.24 | 665 | 651 | 136.7 |
| A | 12 | 189 | 58601 | 423.82 | 665 | 651 | 136.7 |
| B | 5 | 255 | 55835 | 429.31 | 659 | 641 | 128.6 |
| B | 3 | 112 | 35859 | 273.93 | 659 | 641 | 128.6 |
| B | 12 | 111 | 16229 | 121.25 | 659 | 641 | 128.6 |
| C | 15 | 214 | 251514 | 1662.27 | 647 | 650 | 150.9 |
| C | 12 | 249 | 12182 | 76.41 | 647 | 650 | 150.9 |
| C | 3 | 233 | 5622 | 32.95 | 647 | 650 | 150.9 |
| D | 1 | 52 | 225380 | 1409.69 | 645 | 628 | 159.4 |
| D | 13 | 249 | 196541 | 1228.81 | 645 | 628 | 159.4 |
| D | 12 | 6 | 153114 | 956.42 | 645 | 628 | 159.4 |
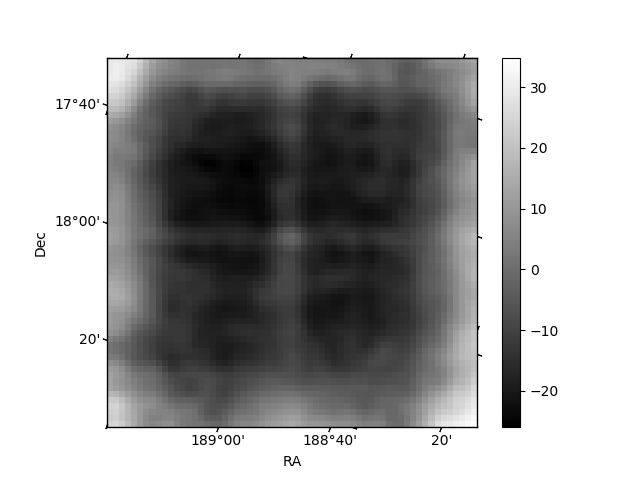
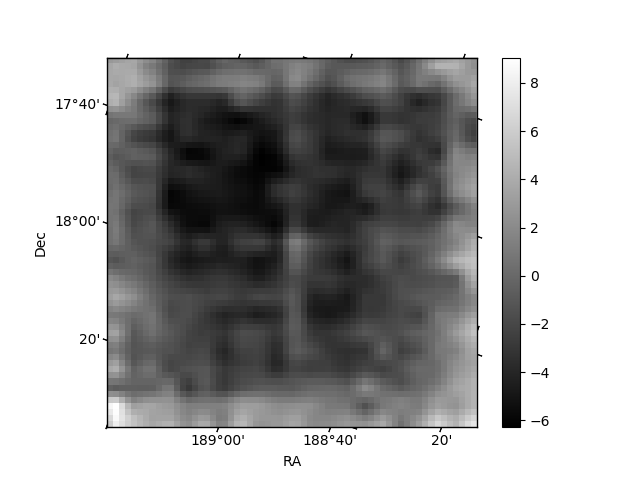
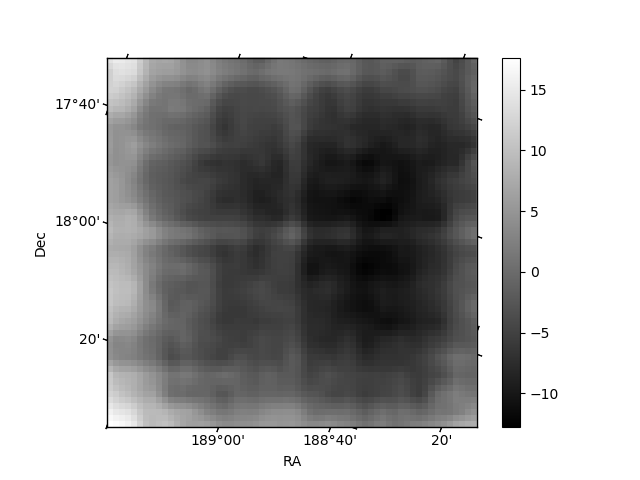
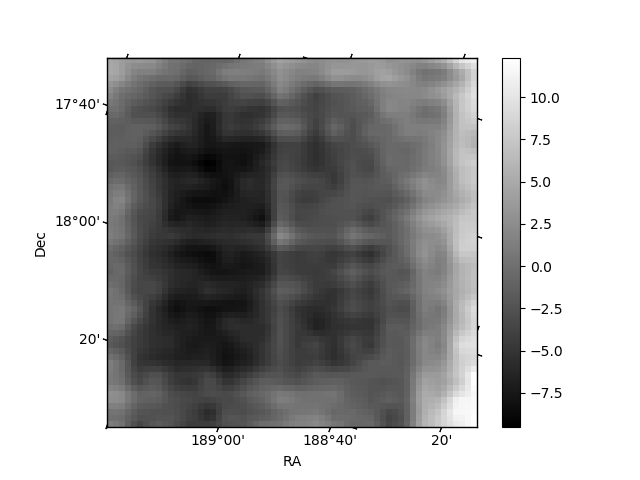
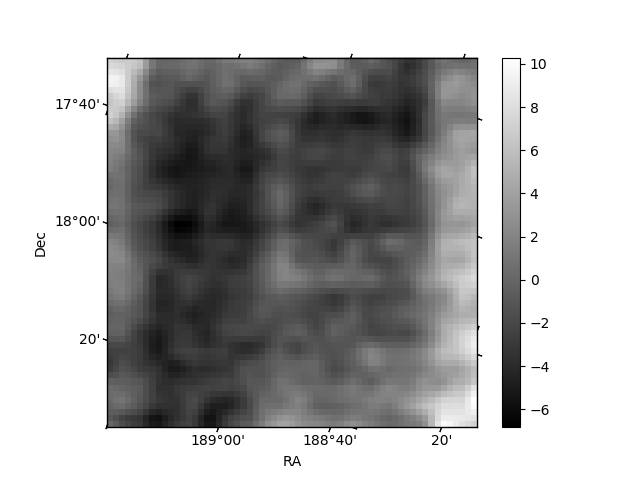
Histogram calculated using DETX and DETY for each event in the final _common_clean file
| Quadrant A | 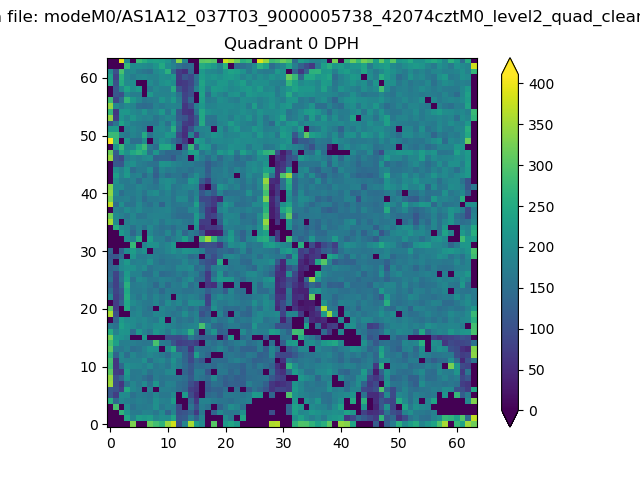 |
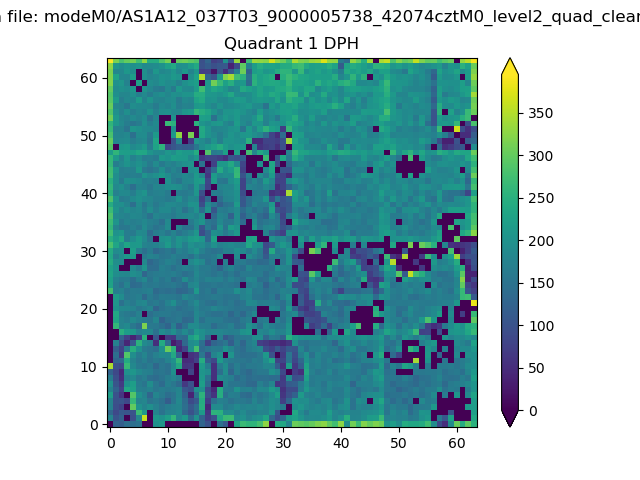 |
Quadrant B |
|---|---|---|---|
| Quadrant D | 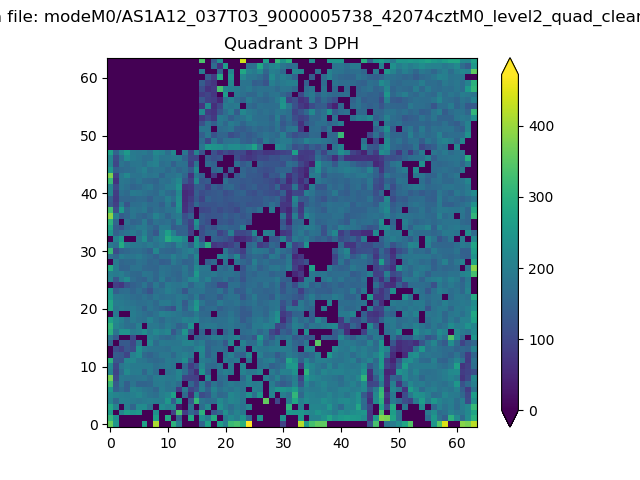 |
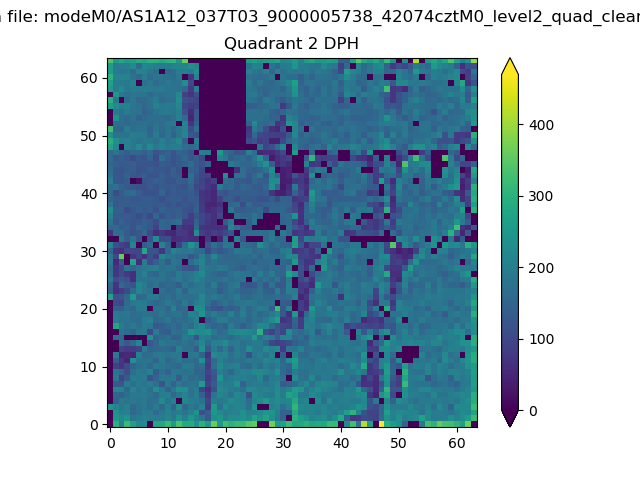 |
Quadrant C |
| Plot type | Count rate plots | Images |
|---|---|---|
| Comparison with Poisson distribution Blue bars denote a histogram of data divided into 1 sec bins. Red curve is a Poisson curve with rate = median count rate of data. |
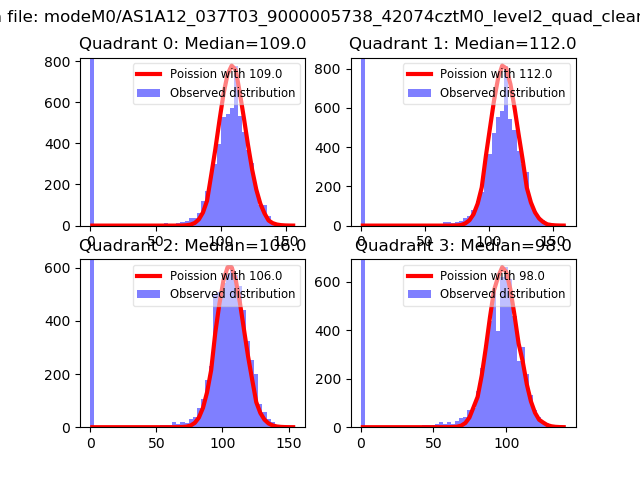 |
 |
| Quadrant-wise count rates Data is divided into 100 sec bins |
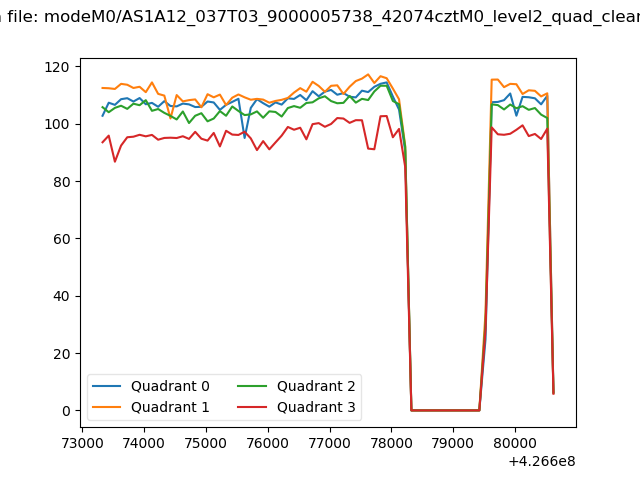 |
|
| Module-wise count rates for Quadrant A Data is divided into 100 sec bins |
 |
 |
| Module-wise count rates for Quadrant B Data is divided into 100 sec bins |
 |
 |
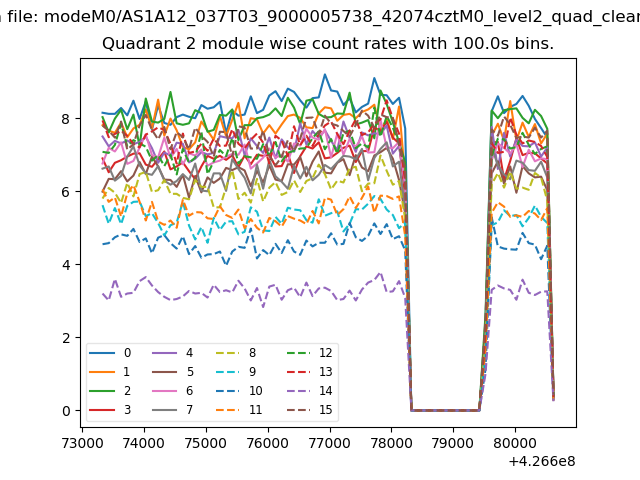
| Module-wise count rates for Quadrant C Data is divided into 100 sec bins |
 |
 |
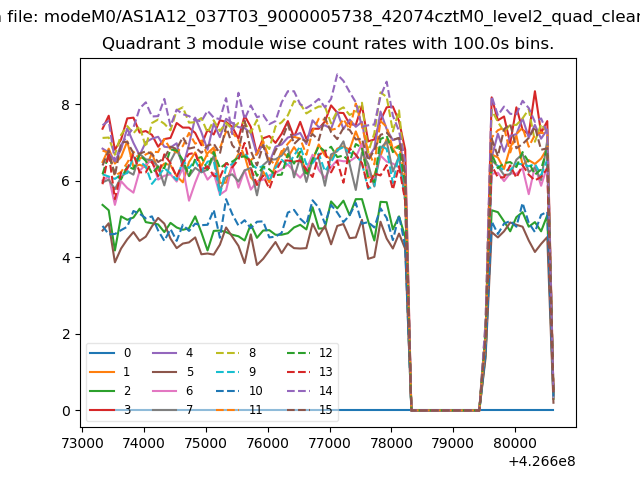
| Module-wise count rates for Quadrant D Data is divided into 100 sec bins |
 |
 |
| Parameter | Plot |
|---|---|
| CZT HV Monitor | 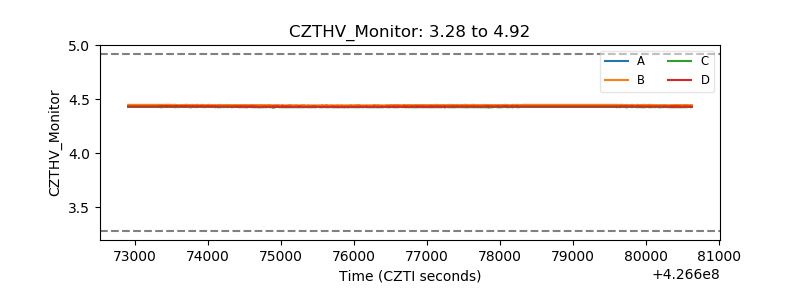 |
| D_VDD | 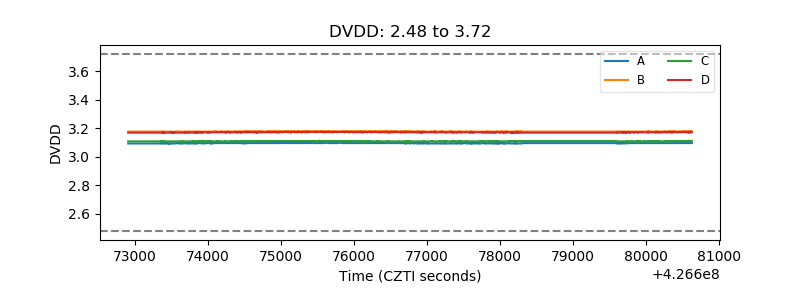 |
| Temperature 1 | 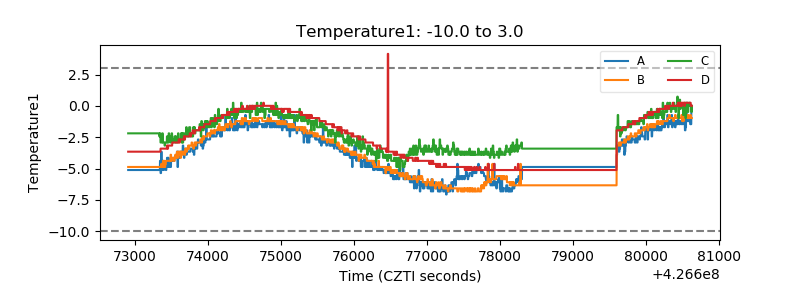 |
| Veto HV Monitor | 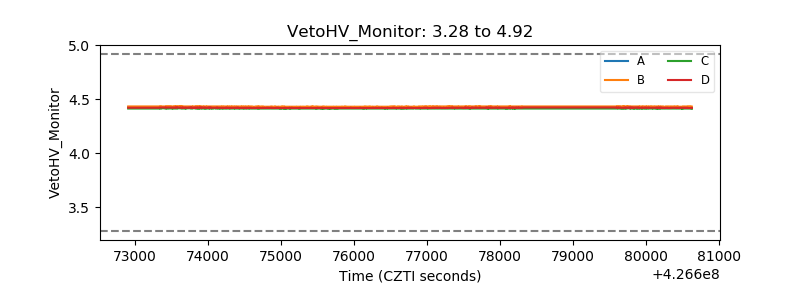 |
| Veto LLD | 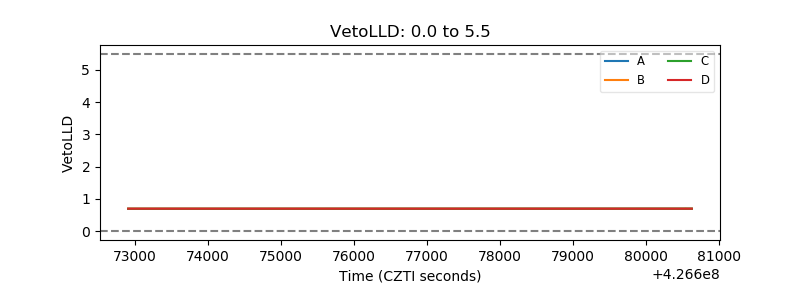 |
| Alpha Counter |  |
| _CPM_Rate |  |
| CZT Counter | 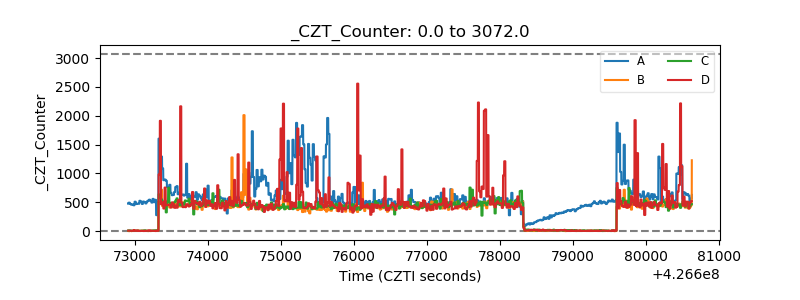 |
| +2.5 Volts monitor | 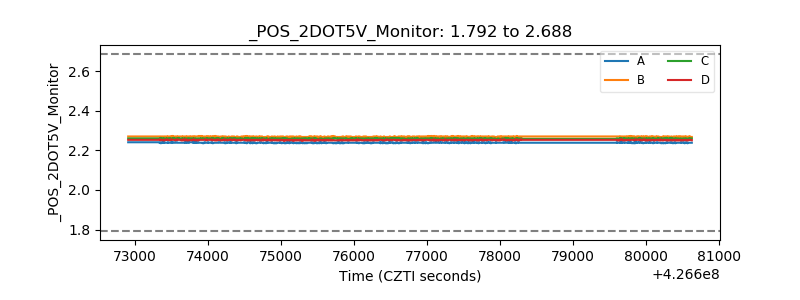 |
| +5 Volts monitor |  |
| _ROLL_ROT | 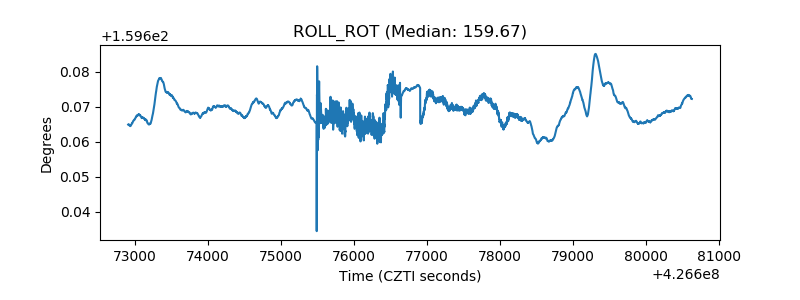 |
| _Roll_DEC | 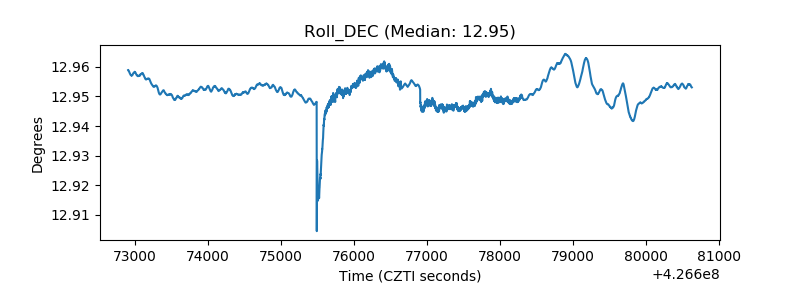 |
| _Roll_RA | 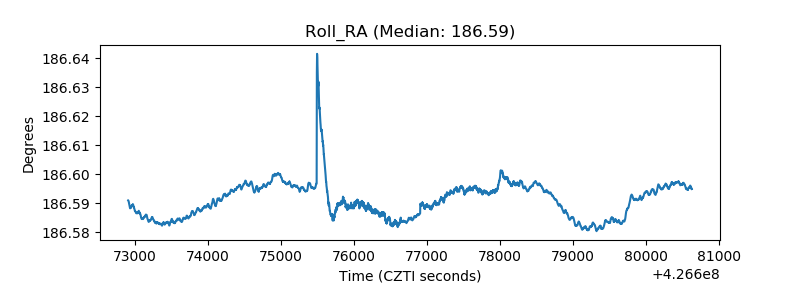 |
| Veto Counter |  |