| Param | Original file | Final file |
|---|---|---|
| Filename | modeM0/AS1A12_037T03_9000005738_42077cztM0_level2.fits | modeM0/AS1A12_037T03_9000005738_42077cztM0_level2_quad_clean.evt |
| Size (bytes) | 768,911,040 | 184,919,040 |
| Size | 733.3 MB | 176.4 MB |
| Events in quadrant A | 10,476,637 | 1,202,389 |
| Events in quadrant B | 5,105,366 | 1,272,581 |
| Events in quadrant C | 5,313,650 | 1,211,509 |
| Events in quadrant D | 6,667,745 | 1,108,916 |
| Mode SS | |||
|---|---|---|---|
| Quadrant | BADHDUFLAG | Total packets | Discarded packets |
| A | 0 | 236 | 0 |
| B | 0 | 236 | 0 |
| C | 0 | 236 | 0 |
| D | 0 | 236 | 0 |
| Mode M9 | |||
|---|---|---|---|
| Quadrant | BADHDUFLAG | Total packets | Discarded packets |
| A | 0 | 27 | 0 |
| B | 0 | 27 | 0 |
| C | 0 | 27 | 0 |
| D | 0 | 27 | 0 |
| Mode M0 | |||
|---|---|---|---|
| Quadrant | BADHDUFLAG | Total packets | Discarded packets |
| A | 0 | 39012 | 24 |
| B | 0 | 23708 | 6 |
| C | 0 | 23453 | 13 |
| D | 0 | 27766 | 7 |
| Quadrant | Total seconds | Saturated seconds | Saturation percentage |
|---|---|---|---|
| A | 11606 | 577 | 4.971566% |
| B | 11612 | 45 | 0.387530% |
| C | 11607 | 7 | 0.060308% |
| D | 11612 | 200 | 1.722356% |
Noise dominated data is calculated using 1-second bins in cleaned event files. If a bin has >2000 counts, and if more than 50% of those come from <1% of pixels, then it is considered to be noise-dominated and hence unusable.
| Quadrant | # 1 sec bins | Bins with >0 counts | Bins with >2000 counts | High rate bins dominated by noise | Noise dominated (total time) | Noise dominated (detector-on time) | Marked lightcurve |
|---|---|---|---|---|---|---|---|
| A | 14329 | 11614 | 525 | 525 | 3.66% | 4.52% | 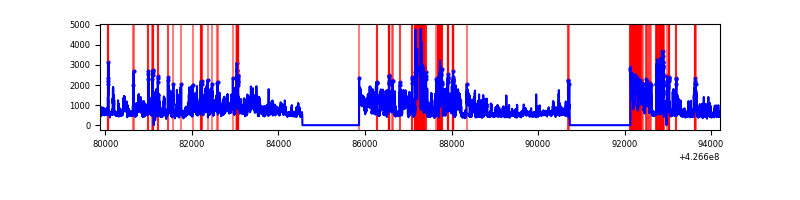 |
| B | 14330 | 11616 | 19 | 19 | 0.13% | 0.16% | 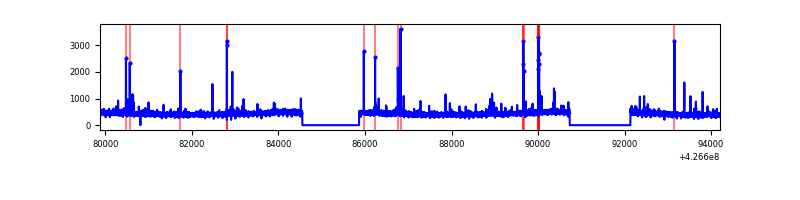 |
| C | 14330 | 11614 | 0 | 0 | 0.00% | 0.00% |  |
| D | 14330 | 11617 | 151 | 151 | 1.05% | 1.30% | 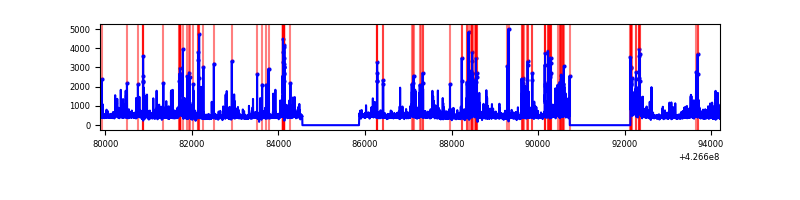 |
Top three noisy pixels from each quadrant. If the there are fewer than three noisy pixels in the level2.evt file, extra rows are filled as -1
| Pixel properties | Quadrant properties | ||||||
|---|---|---|---|---|---|---|---|
| Quadrant | DetID | PixID | Counts | Sigma | Mean | Median | Sigma |
| A | 15 | 222 | 3919679 | 15635.48 | 1224 | 1197 | 250.6 |
| A | 10 | 83 | 1061686 | 4231.55 | 1224 | 1197 | 250.6 |
| A | 15 | 223 | 656029 | 2612.9 | 1224 | 1197 | 250.6 |
| B | 5 | 255 | 120261 | 496.99 | 1248 | 1216 | 239.5 |
| B | 3 | 112 | 43809 | 177.82 | 1248 | 1216 | 239.5 |
| B | 12 | 111 | 30545 | 122.44 | 1248 | 1216 | 239.5 |
| C | 15 | 214 | 475363 | 1646.15 | 1224 | 1232 | 288.0 |
| C | 0 | 207 | 43821 | 147.87 | 1224 | 1232 | 288.0 |
| C | 12 | 249 | 21321 | 69.75 | 1224 | 1232 | 288.0 |
| D | 1 | 52 | 675496 | 2265.4 | 1216 | 1181 | 297.7 |
| D | 12 | 6 | 302745 | 1013.12 | 1216 | 1181 | 297.7 |
| D | 13 | 249 | 249193 | 833.21 | 1216 | 1181 | 297.7 |
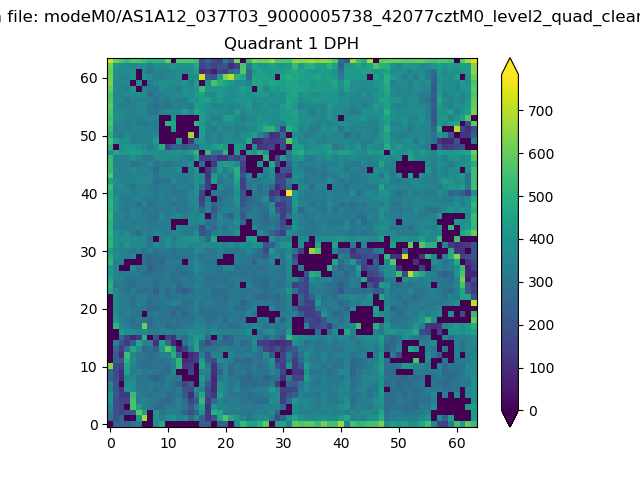
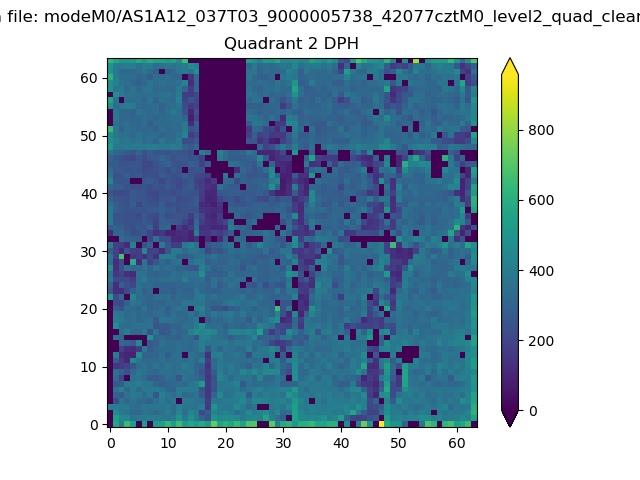
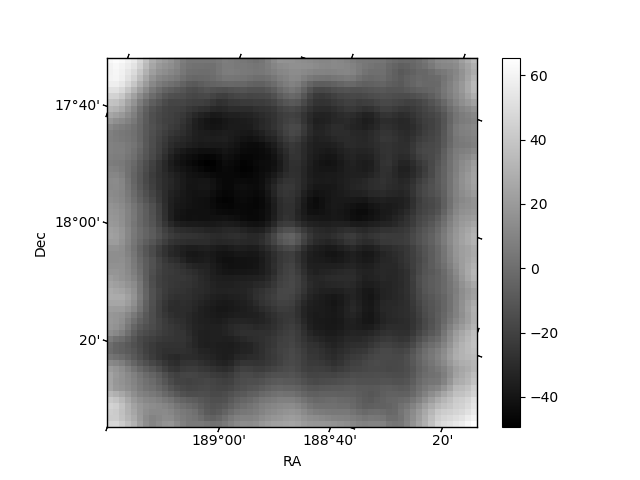
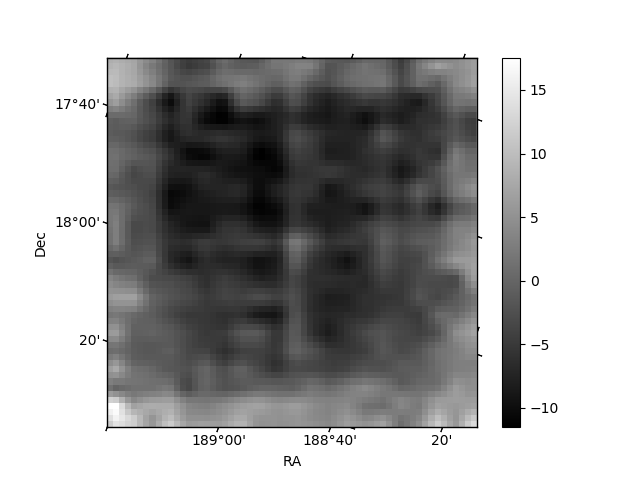
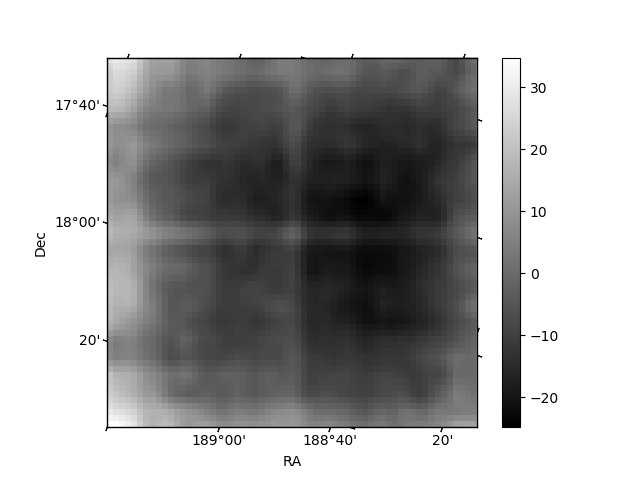
Histogram calculated using DETX and DETY for each event in the final _common_clean file
| Quadrant A | 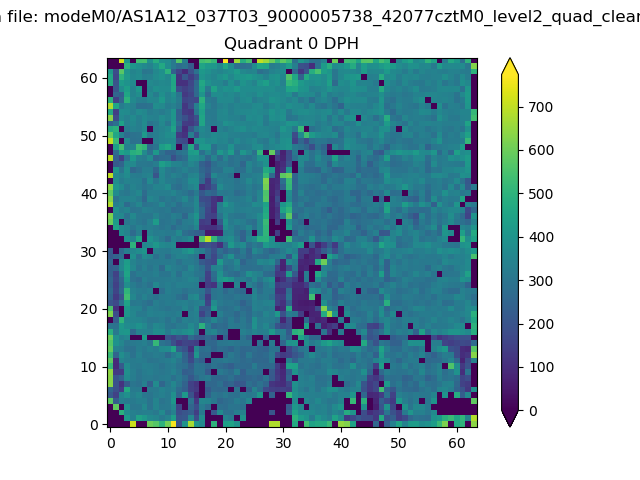 |
 |
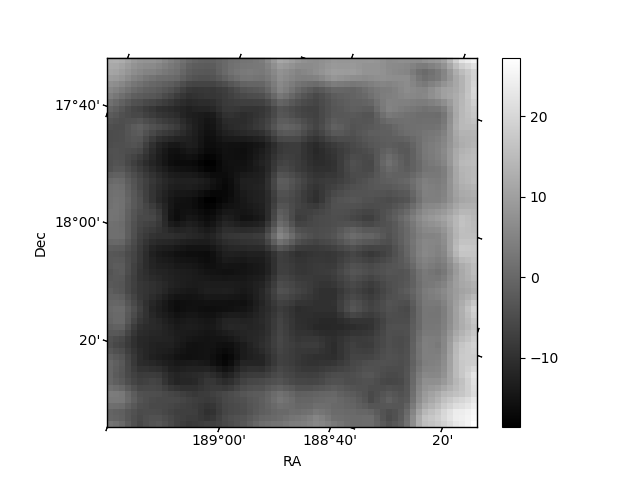
Quadrant B |
|---|---|---|---|
| Quadrant D | 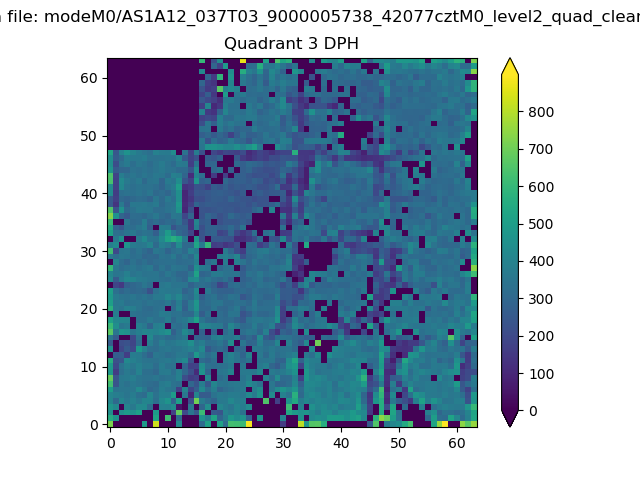 |
 |
Quadrant C |
| Plot type | Count rate plots | Images |
|---|---|---|
| Comparison with Poisson distribution Blue bars denote a histogram of data divided into 1 sec bins. Red curve is a Poisson curve with rate = median count rate of data. |
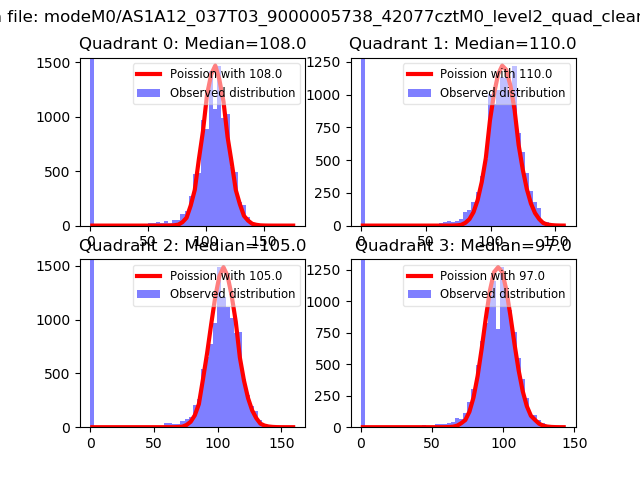 |
 |
| Quadrant-wise count rates Data is divided into 100 sec bins |
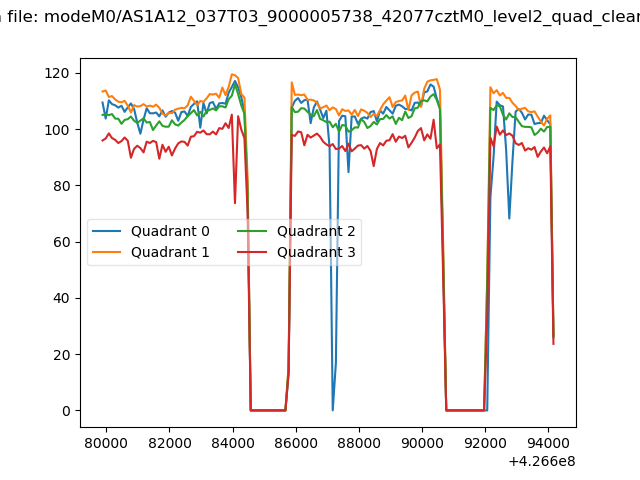 |
|
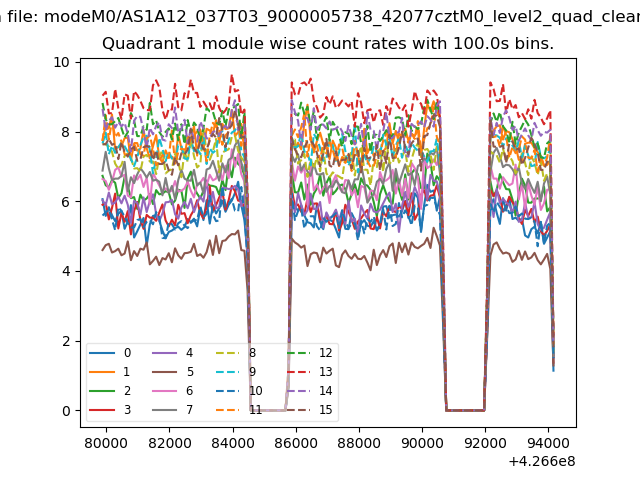
| Module-wise count rates for Quadrant A Data is divided into 100 sec bins |
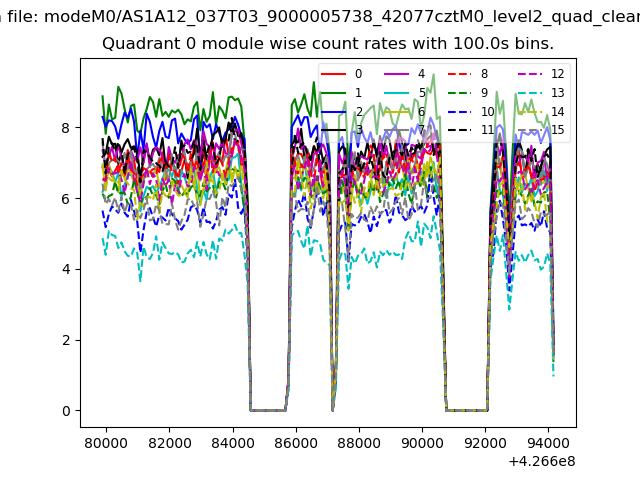 |
 |
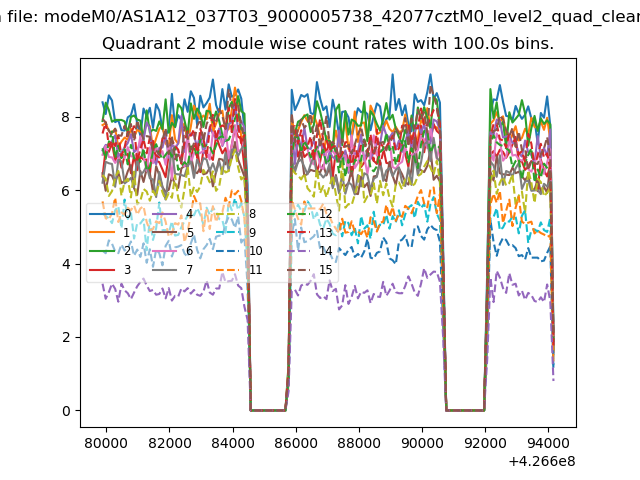
| Module-wise count rates for Quadrant B Data is divided into 100 sec bins |
 |
 |
| Module-wise count rates for Quadrant C Data is divided into 100 sec bins |
 |
 |
| Module-wise count rates for Quadrant D Data is divided into 100 sec bins |
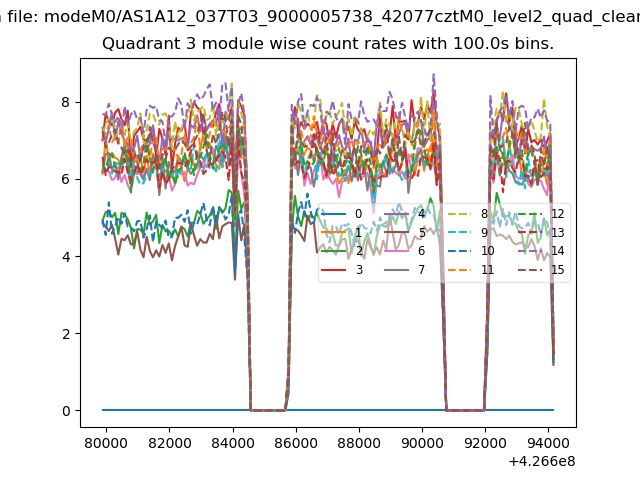 |
 |
| Parameter | Plot |
|---|---|
| CZT HV Monitor | 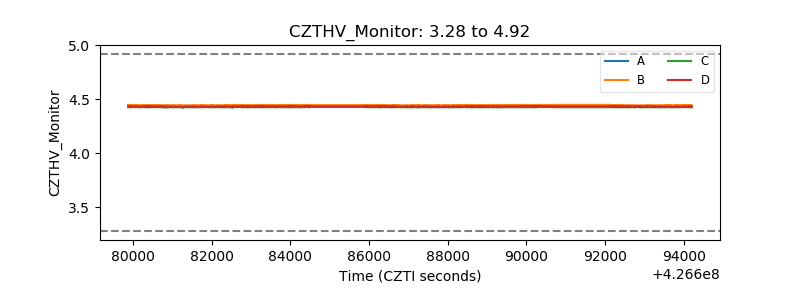 |
| D_VDD | 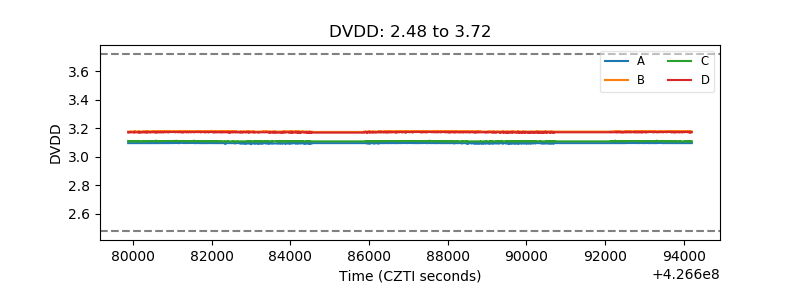 |
| Temperature 1 | 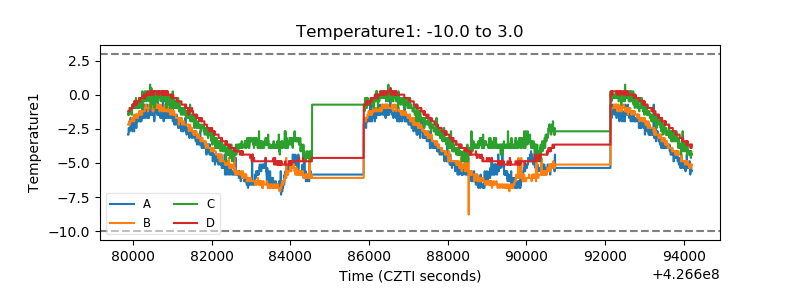 |
| Veto HV Monitor |  |
| Veto LLD | 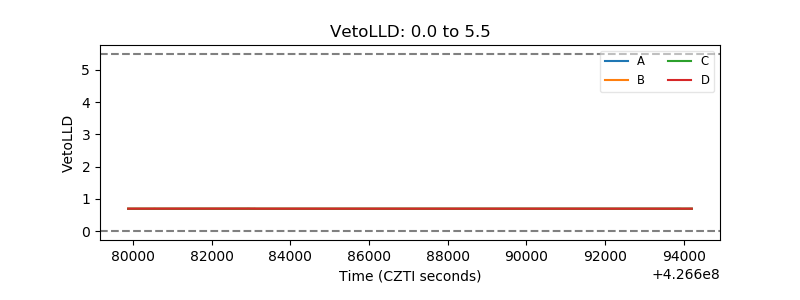 |
| Alpha Counter |  |
| _CPM_Rate |  |
| CZT Counter | 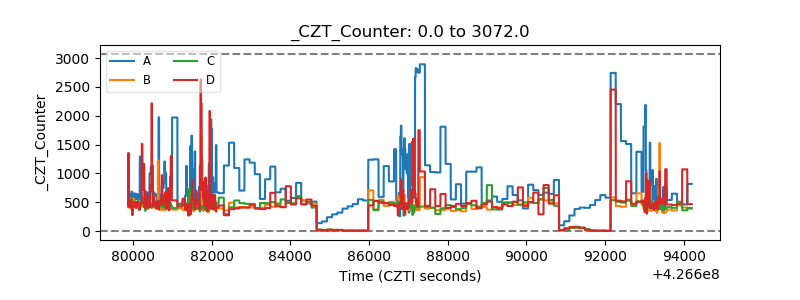 |
| +2.5 Volts monitor | 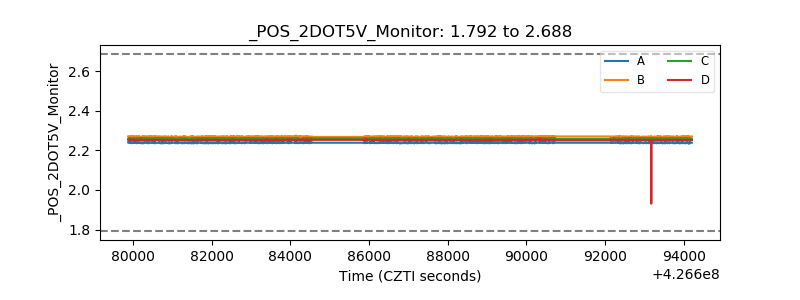 |
| +5 Volts monitor |  |
| _ROLL_ROT | 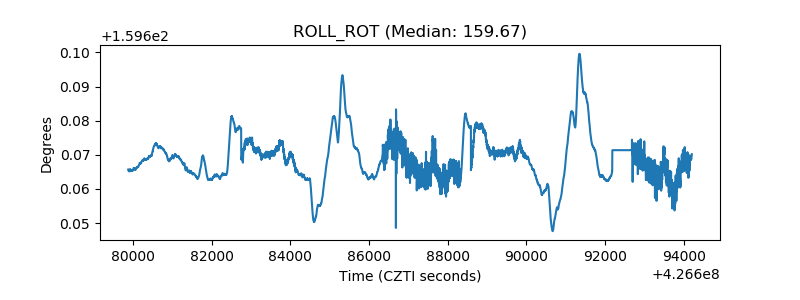 |
| _Roll_DEC | 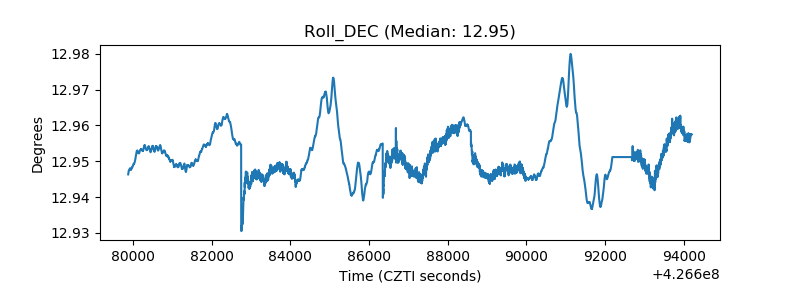 |
| _Roll_RA | 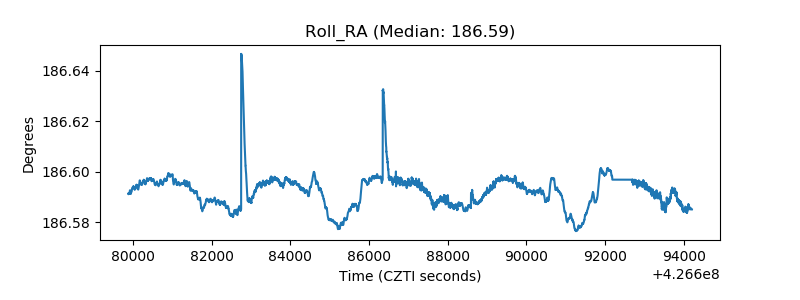 |
| Veto Counter | 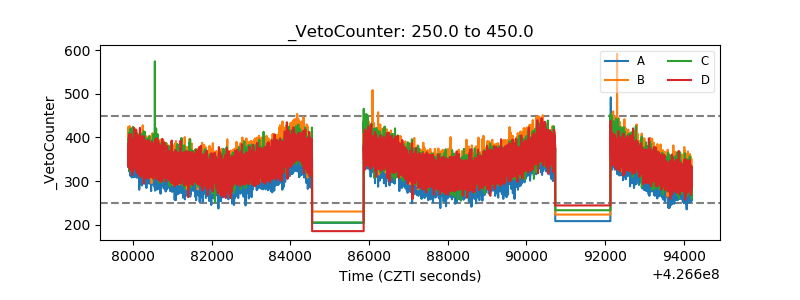 |