| Param | Original file | Final file |
|---|---|---|
| Filename | modeM0/AS1A12_044T22_9000005740_42078cztM0_level2.fits | modeM0/AS1A12_044T22_9000005740_42078cztM0_level2_quad_clean.evt |
| Size (bytes) | 359,366,400 | 90,391,680 |
| Size | 342.7 MB | 86.2 MB |
| Events in quadrant A | 4,718,782 | 596,645 |
| Events in quadrant B | 2,523,603 | 621,709 |
| Events in quadrant C | 2,586,731 | 589,085 |
| Events in quadrant D | 3,041,473 | 540,964 |
| Mode M0 | |||
|---|---|---|---|
| Quadrant | BADHDUFLAG | Total packets | Discarded packets |
| A | 0 | 17799 | 3 |
| B | 0 | 11421 | 2 |
| C | 0 | 11167 | 2 |
| D | 0 | 12804 | 2 |
| Mode SS | |||
|---|---|---|---|
| Quadrant | BADHDUFLAG | Total packets | Discarded packets |
| A | 0 | 116 | 0 |
| B | 0 | 116 | 0 |
| C | 0 | 116 | 0 |
| D | 0 | 116 | 0 |
| Mode M9 | |||
|---|---|---|---|
| Quadrant | BADHDUFLAG | Total packets | Discarded packets |
| A | 0 | 31 | 0 |
| B | 0 | 31 | 0 |
| C | 0 | 31 | 0 |
| D | 0 | 31 | 0 |
| Quadrant | Total seconds | Saturated seconds | Saturation percentage |
|---|---|---|---|
| A | 5551 | 201 | 3.620969% |
| B | 5551 | 30 | 0.540443% |
| C | 5551 | 4 | 0.072059% |
| D | 5551 | 101 | 1.819492% |
Noise dominated data is calculated using 1-second bins in cleaned event files. If a bin has >2000 counts, and if more than 50% of those come from <1% of pixels, then it is considered to be noise-dominated and hence unusable.
| Quadrant | # 1 sec bins | Bins with >0 counts | Bins with >2000 counts | High rate bins dominated by noise | Noise dominated (total time) | Noise dominated (detector-on time) | Marked lightcurve |
|---|---|---|---|---|---|---|---|
| A | 8716 | 5553 | 93 | 93 | 1.07% | 1.67% | 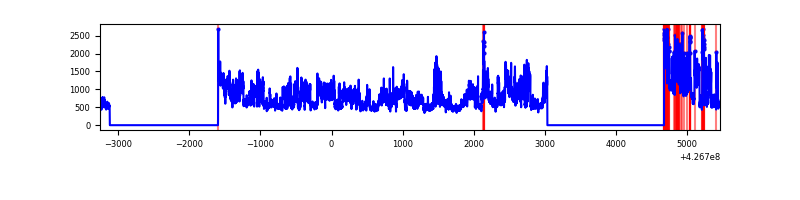 |
| B | 8716 | 5553 | 8 | 8 | 0.09% | 0.14% | 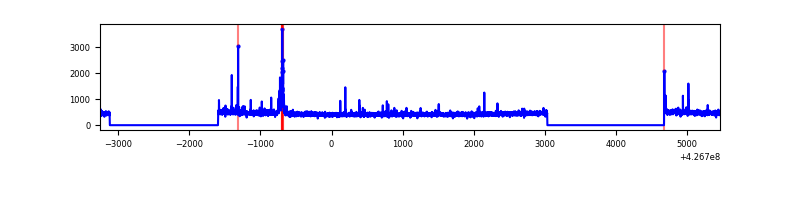 |
| C | 8716 | 5553 | 0 | 0 | 0.00% | 0.00% | 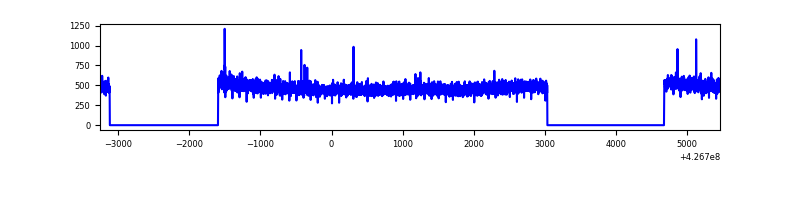 |
| D | 8716 | 5553 | 77 | 77 | 0.88% | 1.39% | 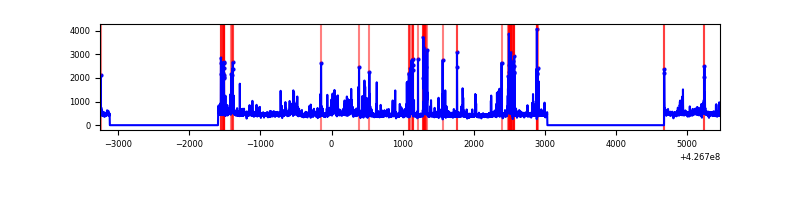 |
Top three noisy pixels from each quadrant. If the there are fewer than three noisy pixels in the level2.evt file, extra rows are filled as -1
| Pixel properties | Quadrant properties | ||||||
|---|---|---|---|---|---|---|---|
| Quadrant | DetID | PixID | Counts | Sigma | Mean | Median | Sigma |
| A | 15 | 222 | 1721012 | 13640.04 | 609 | 596 | 126.1 |
| A | 10 | 83 | 566648 | 4487.85 | 609 | 596 | 126.1 |
| A | 15 | 223 | 54443 | 426.92 | 609 | 596 | 126.1 |
| B | 12 | 18 | 59246 | 490.29 | 611 | 593 | 119.6 |
| B | 3 | 112 | 20128 | 163.3 | 611 | 593 | 119.6 |
| B | 0 | 229 | 18307 | 148.07 | 611 | 593 | 119.6 |
| C | 15 | 214 | 229073 | 1623.93 | 602 | 603 | 140.7 |
| C | 12 | 249 | 4947 | 30.88 | 602 | 603 | 140.7 |
| C | 13 | 61 | 4171 | 25.36 | 602 | 603 | 140.7 |
| D | 12 | 6 | 180793 | 1216.64 | 597 | 579 | 148.1 |
| D | 1 | 52 | 165361 | 1112.46 | 597 | 579 | 148.1 |
| D | 13 | 249 | 132119 | 888.04 | 597 | 579 | 148.1 |
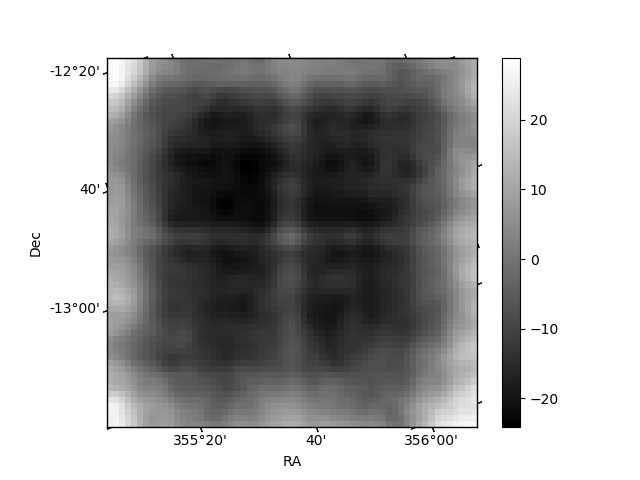
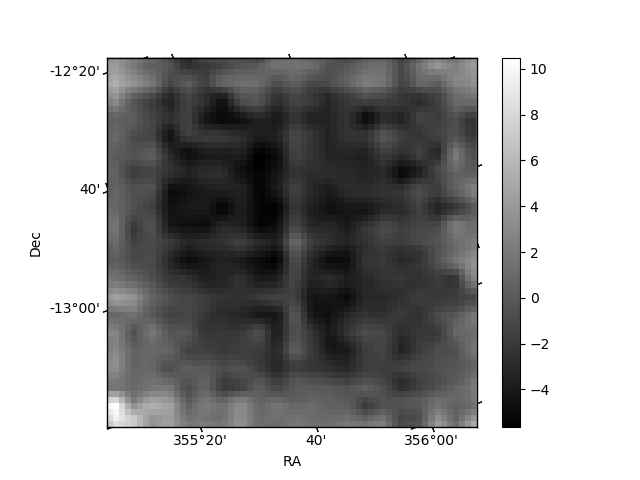
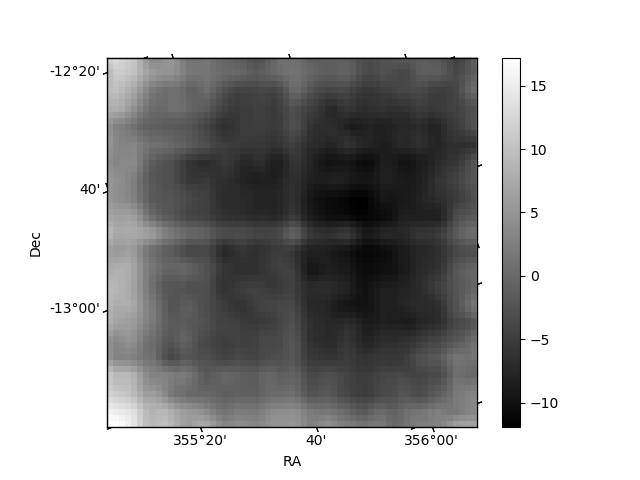
Histogram calculated using DETX and DETY for each event in the final _common_clean file
| Quadrant A | 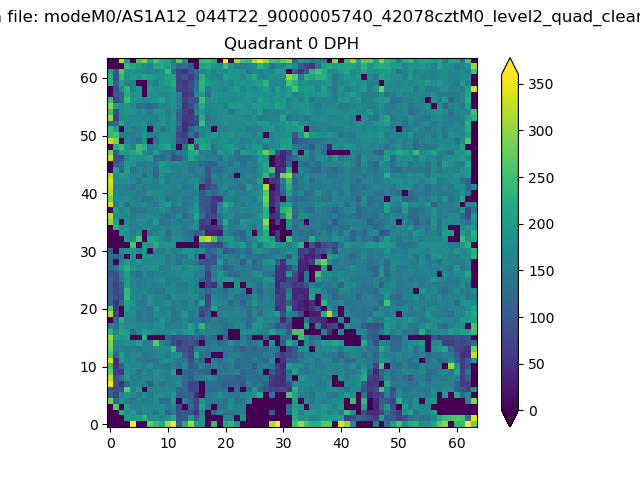 |
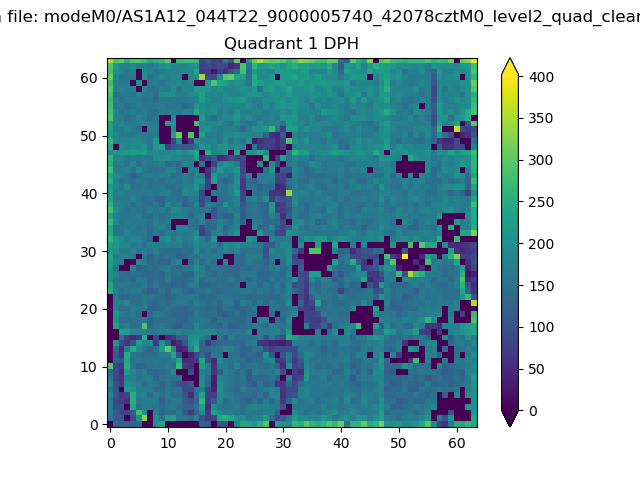 |
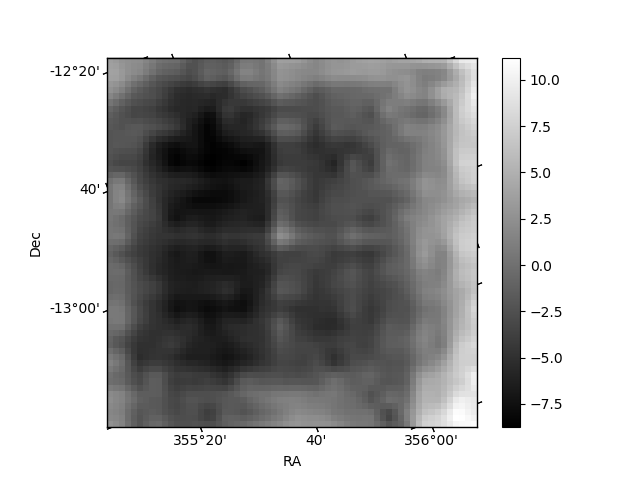
Quadrant B |
|---|---|---|---|
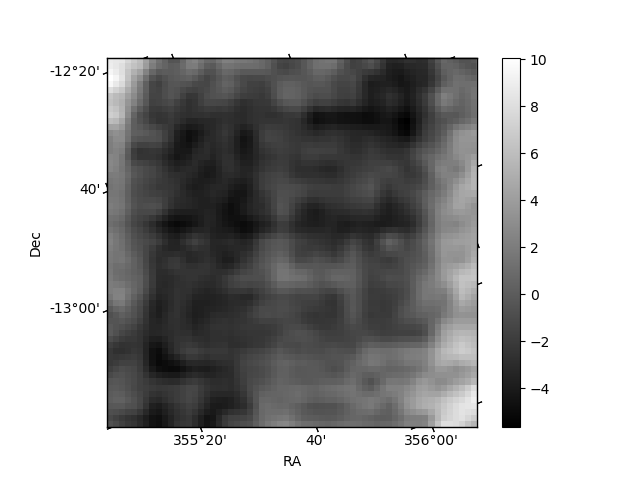
| Quadrant D |  |
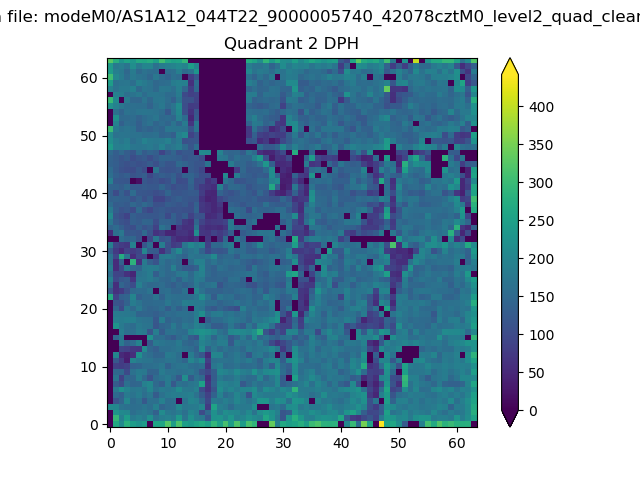 |
Quadrant C |
| Plot type | Count rate plots | Images |
|---|---|---|
| Comparison with Poisson distribution Blue bars denote a histogram of data divided into 1 sec bins. Red curve is a Poisson curve with rate = median count rate of data. |
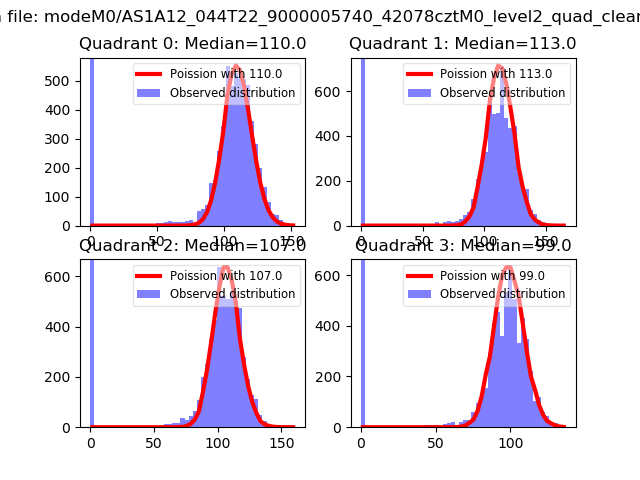 |
 |
| Quadrant-wise count rates Data is divided into 100 sec bins |
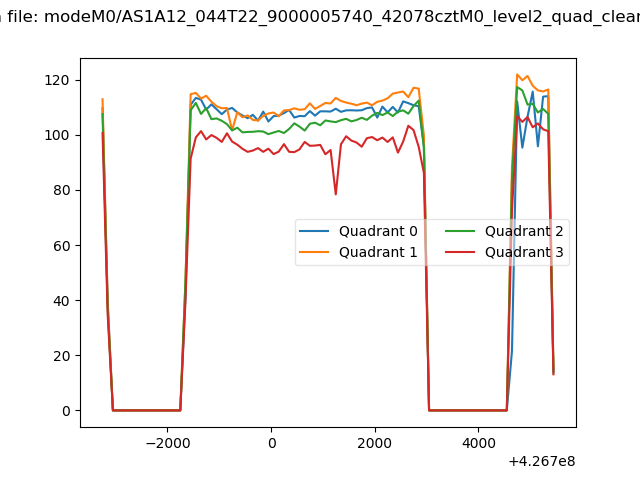 |
|
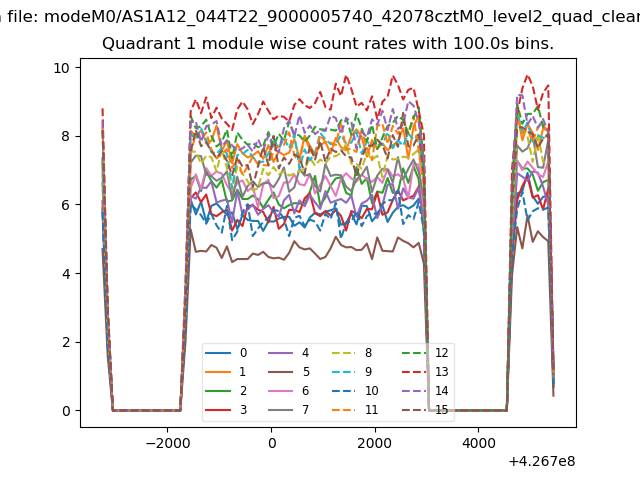
| Module-wise count rates for Quadrant A Data is divided into 100 sec bins |
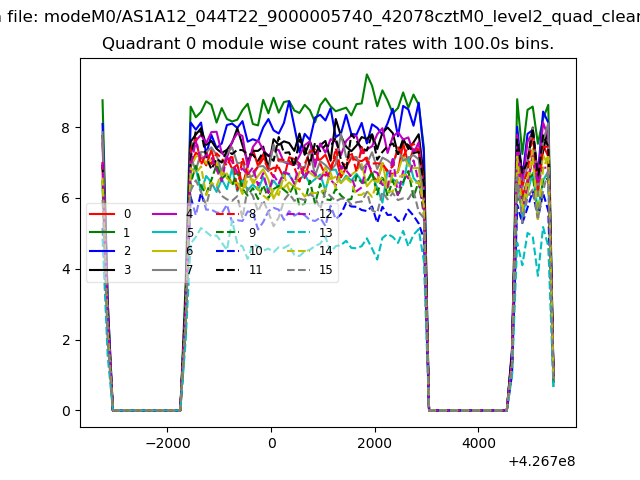 |
 |
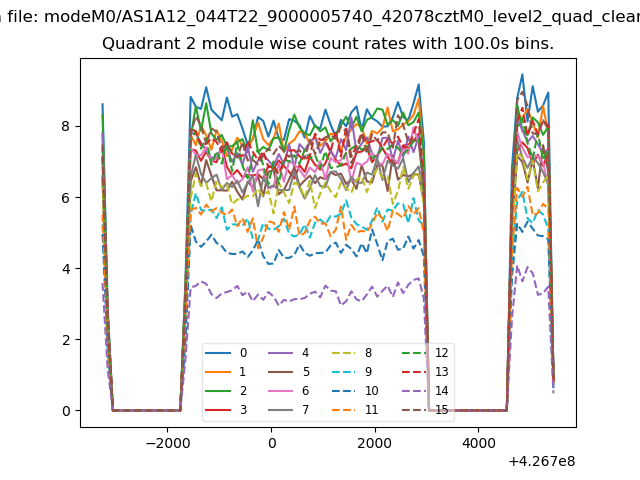
| Module-wise count rates for Quadrant B Data is divided into 100 sec bins |
 |
 |
| Module-wise count rates for Quadrant C Data is divided into 100 sec bins |
 |
 |
| Module-wise count rates for Quadrant D Data is divided into 100 sec bins |
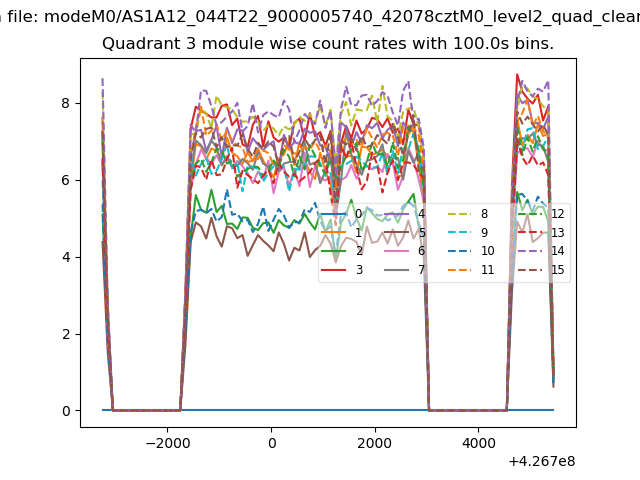 |
 |
| Parameter | Plot |
|---|---|
| CZT HV Monitor | 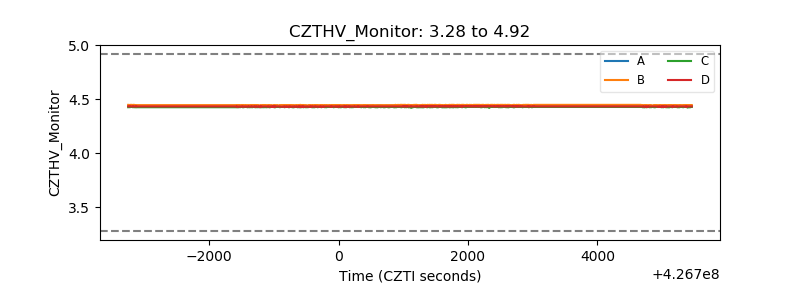 |
| D_VDD | 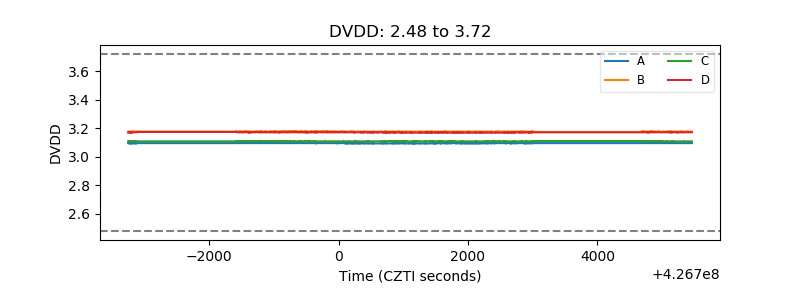 |
| Temperature 1 | 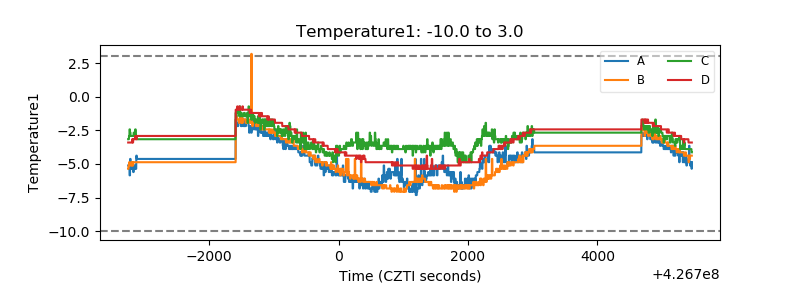 |
| Veto HV Monitor | 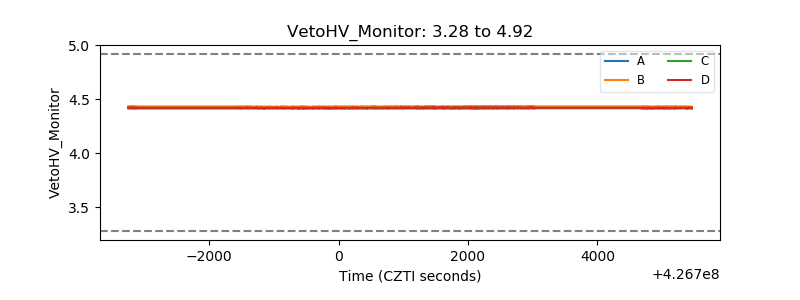 |
| Veto LLD | 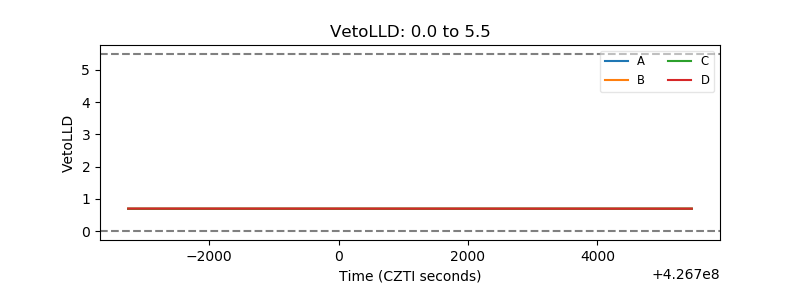 |
| Alpha Counter | 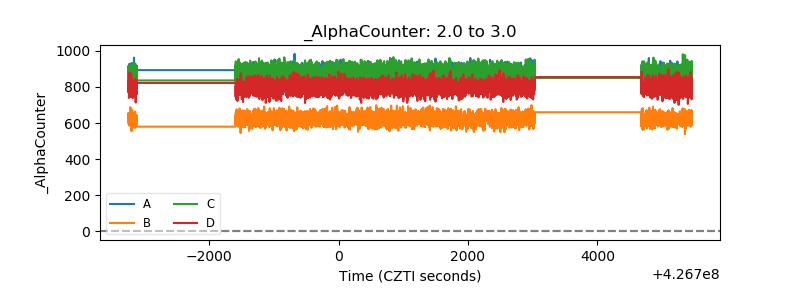 |
| _CPM_Rate | 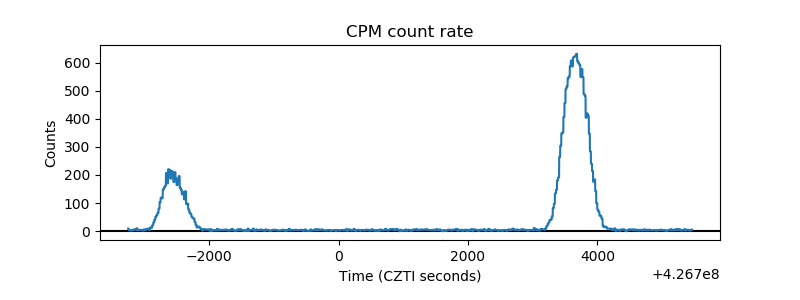 |
| CZT Counter | 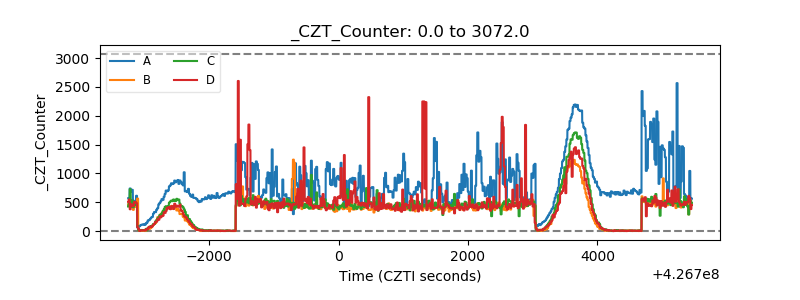 |
| +2.5 Volts monitor | 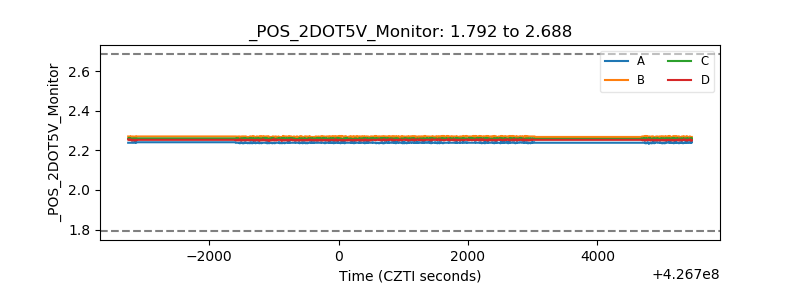 |
| +5 Volts monitor | 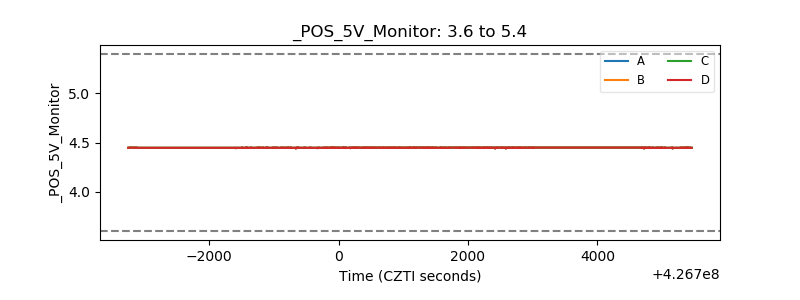 |
| _ROLL_ROT | 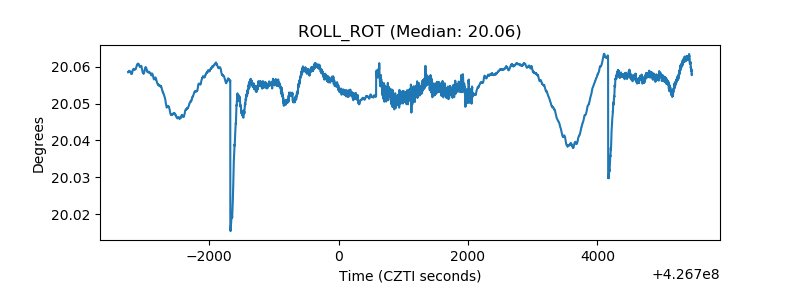 |
| _Roll_DEC | 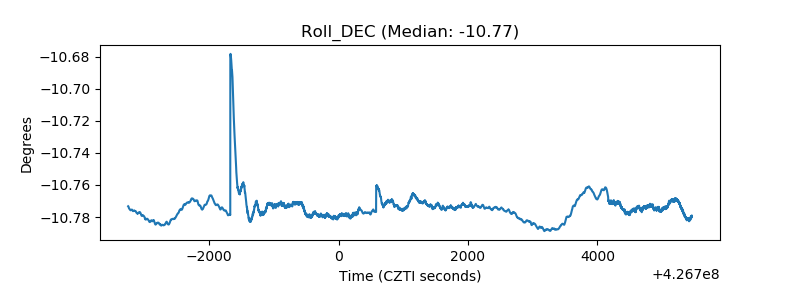 |
| _Roll_RA | 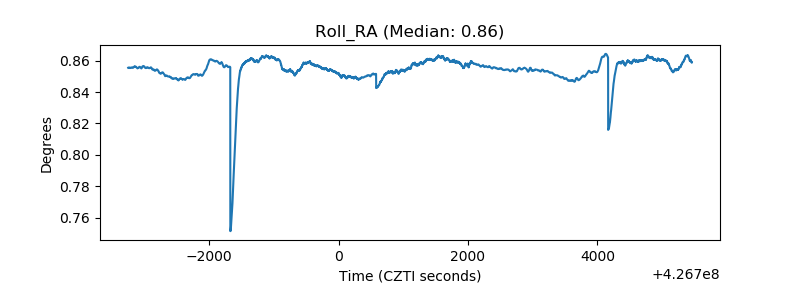 |
| Veto Counter | 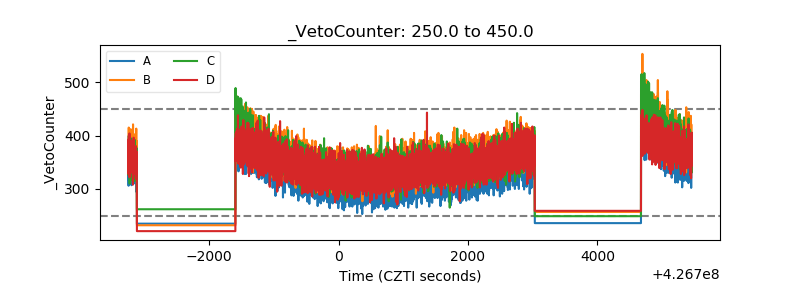 |