| Param | Original file | Final file |
|---|---|---|
| Filename | modeM0/AS1A12_044T22_9000005740_42080cztM0_level2.fits | modeM0/AS1A12_044T22_9000005740_42080cztM0_level2_quad_clean.evt |
| Size (bytes) | 353,059,200 | 88,087,680 |
| Size | 336.7 MB | 84.0 MB |
| Events in quadrant A | 4,930,968 | 572,562 |
| Events in quadrant B | 2,468,498 | 610,999 |
| Events in quadrant C | 2,495,143 | 581,371 |
| Events in quadrant D | 2,761,289 | 530,159 |
| Mode M0 | |||
|---|---|---|---|
| Quadrant | BADHDUFLAG | Total packets | Discarded packets |
| A | 0 | 18109 | 3 |
| B | 0 | 11046 | 2 |
| C | 0 | 10688 | 2 |
| D | 0 | 11960 | 2 |
| Mode SS | |||
|---|---|---|---|
| Quadrant | BADHDUFLAG | Total packets | Discarded packets |
| A | 0 | 112 | 0 |
| B | 0 | 112 | 0 |
| C | 0 | 112 | 0 |
| D | 0 | 112 | 0 |
| Mode M9 | |||
|---|---|---|---|
| Quadrant | BADHDUFLAG | Total packets | Discarded packets |
| A | 0 | 34 | 0 |
| B | 0 | 34 | 0 |
| C | 0 | 34 | 0 |
| D | 0 | 34 | 0 |
| Quadrant | Total seconds | Saturated seconds | Saturation percentage |
|---|---|---|---|
| A | 5307 | 351 | 6.613906% |
| B | 5307 | 45 | 0.847937% |
| C | 5307 | 6 | 0.113058% |
| D | 5307 | 89 | 1.677030% |
Noise dominated data is calculated using 1-second bins in cleaned event files. If a bin has >2000 counts, and if more than 50% of those come from <1% of pixels, then it is considered to be noise-dominated and hence unusable.
| Quadrant | # 1 sec bins | Bins with >0 counts | Bins with >2000 counts | High rate bins dominated by noise | Noise dominated (total time) | Noise dominated (detector-on time) | Marked lightcurve |
|---|---|---|---|---|---|---|---|
| A | 8711 | 5309 | 256 | 256 | 2.94% | 4.82% | 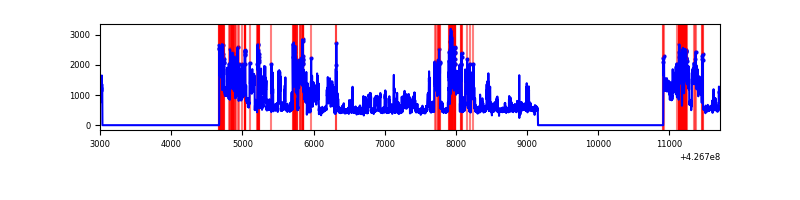 |
| B | 8711 | 5309 | 12 | 12 | 0.14% | 0.23% | 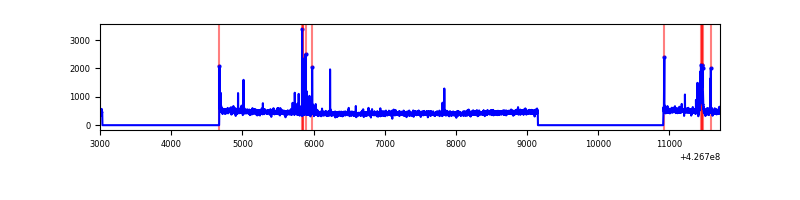 |
| C | 8711 | 5309 | 0 | 0 | 0.00% | 0.00% | 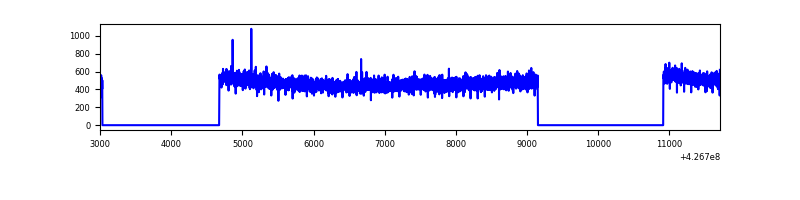 |
| D | 8711 | 5309 | 66 | 66 | 0.76% | 1.24% | 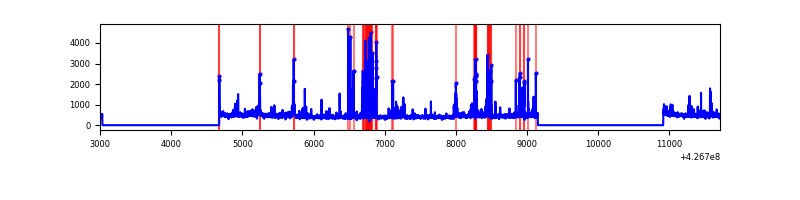 |
Top three noisy pixels from each quadrant. If the there are fewer than three noisy pixels in the level2.evt file, extra rows are filled as -1
| Pixel properties | Quadrant properties | ||||||
|---|---|---|---|---|---|---|---|
| Quadrant | DetID | PixID | Counts | Sigma | Mean | Median | Sigma |
| A | 15 | 222 | 2106361 | 17351.25 | 585 | 573 | 121.4 |
| A | 10 | 83 | 531879 | 4377.85 | 585 | 573 | 121.4 |
| A | 15 | 223 | 15285 | 121.22 | 585 | 573 | 121.4 |
| B | 3 | 112 | 46734 | 399.94 | 592 | 577 | 115.4 |
| B | 5 | 255 | 39779 | 339.68 | 592 | 577 | 115.4 |
| B | 5 | 168 | 16031 | 133.91 | 592 | 577 | 115.4 |
| C | 15 | 214 | 219746 | 1598.37 | 583 | 586 | 137.1 |
| C | 13 | 61 | 3770 | 23.22 | 583 | 586 | 137.1 |
| C | 12 | 249 | 3282 | 19.66 | 583 | 586 | 137.1 |
| D | 12 | 6 | 261513 | 1834.15 | 576 | 559 | 142.3 |
| D | 13 | 249 | 109518 | 765.83 | 576 | 559 | 142.3 |
| D | 10 | 199 | 74765 | 521.57 | 576 | 559 | 142.3 |
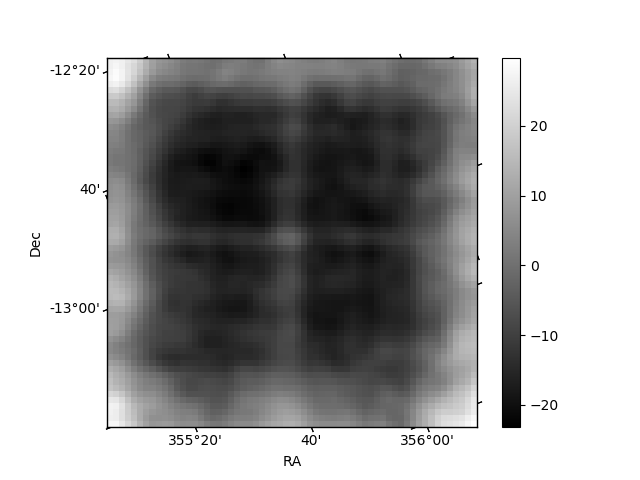
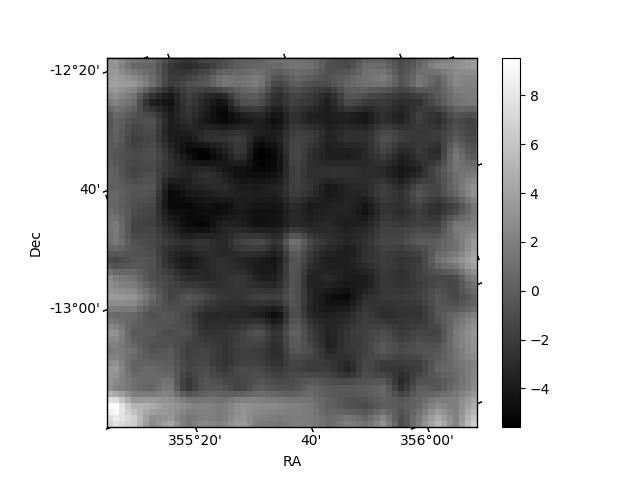
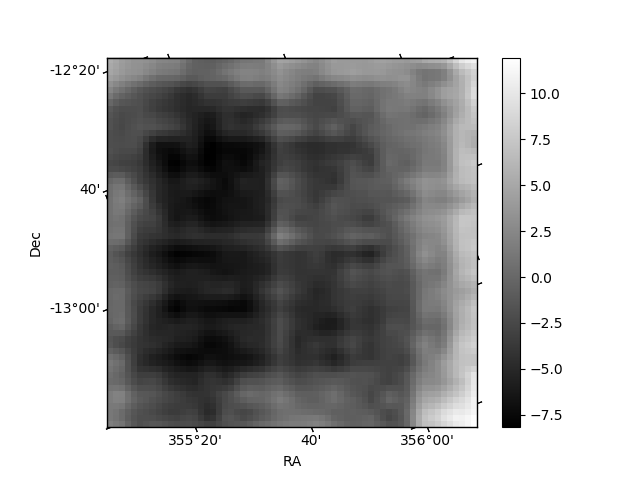
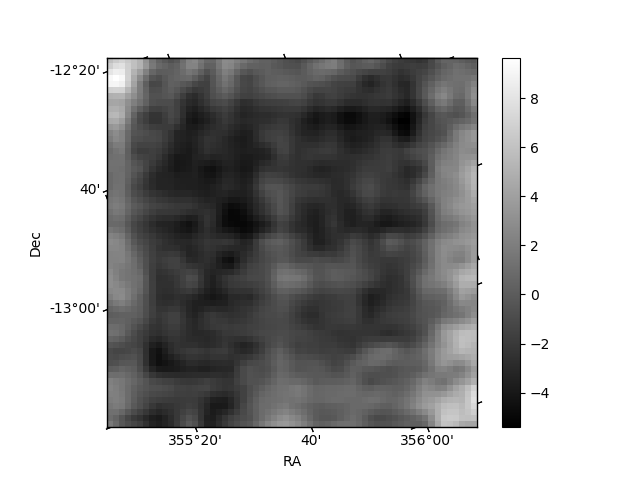
Histogram calculated using DETX and DETY for each event in the final _common_clean file
| Quadrant A | 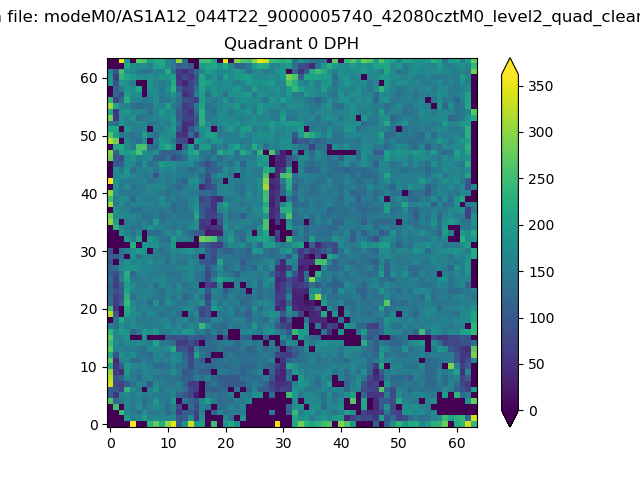 |
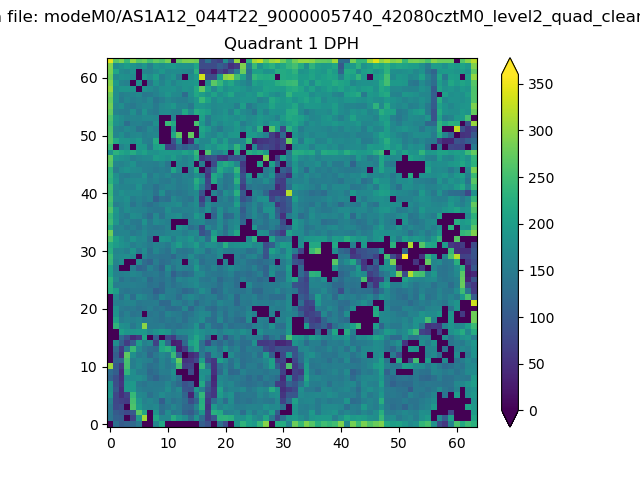 |
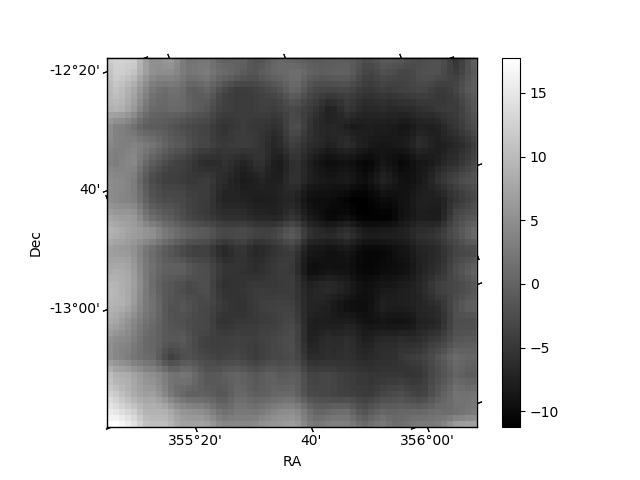
Quadrant B |
|---|---|---|---|
| Quadrant D | 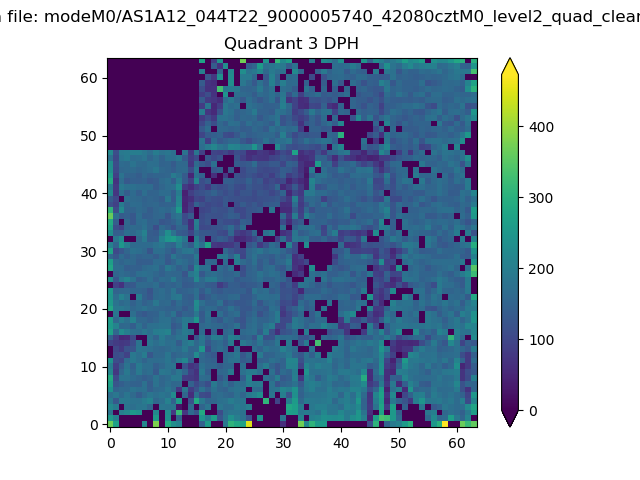 |
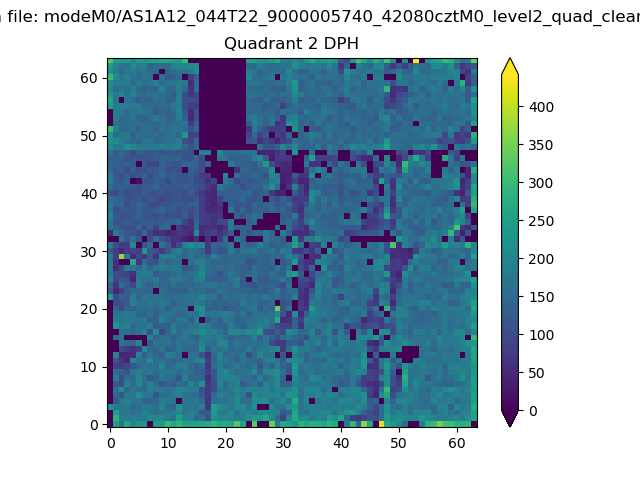 |
Quadrant C |
| Plot type | Count rate plots | Images |
|---|---|---|
| Comparison with Poisson distribution Blue bars denote a histogram of data divided into 1 sec bins. Red curve is a Poisson curve with rate = median count rate of data. |
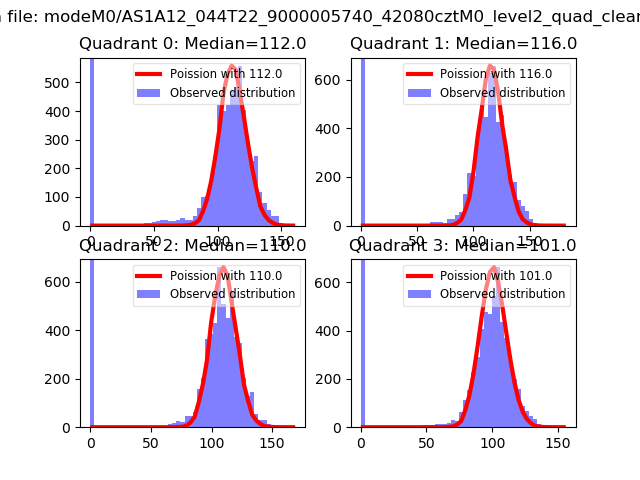 |
 |
| Quadrant-wise count rates Data is divided into 100 sec bins |
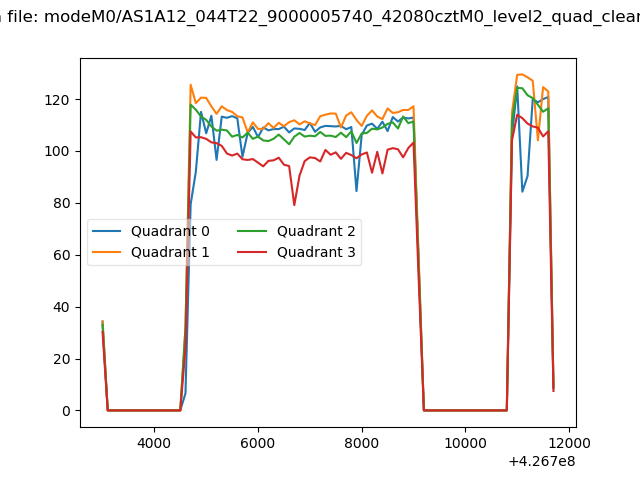 |
|
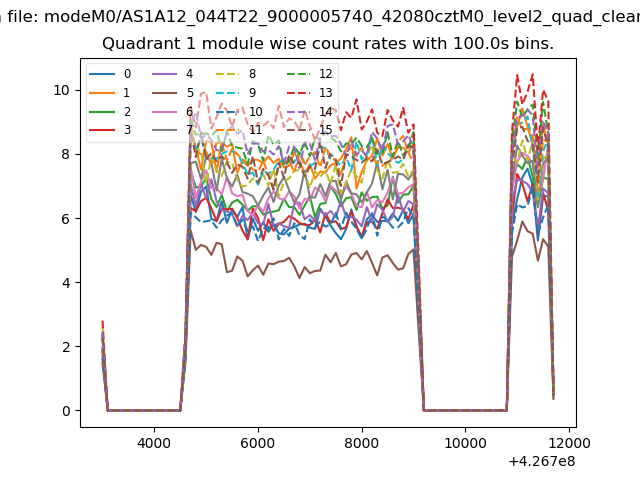
| Module-wise count rates for Quadrant A Data is divided into 100 sec bins |
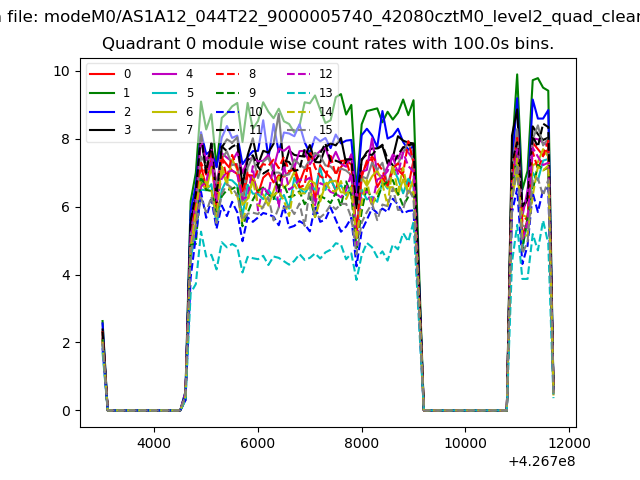 |
 |
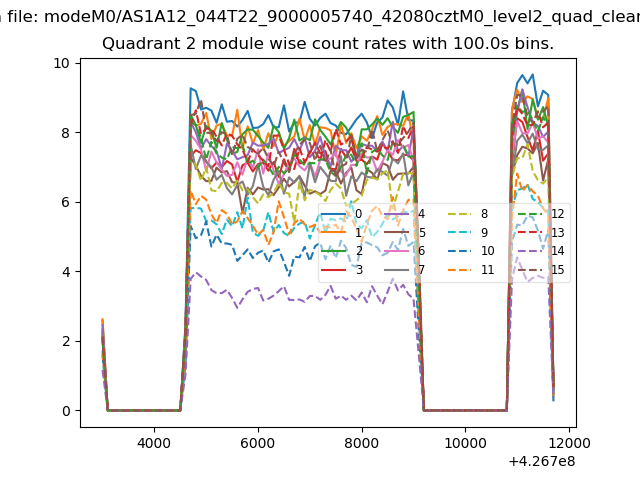
| Module-wise count rates for Quadrant B Data is divided into 100 sec bins |
 |
 |
| Module-wise count rates for Quadrant C Data is divided into 100 sec bins |
 |
 |
| Module-wise count rates for Quadrant D Data is divided into 100 sec bins |
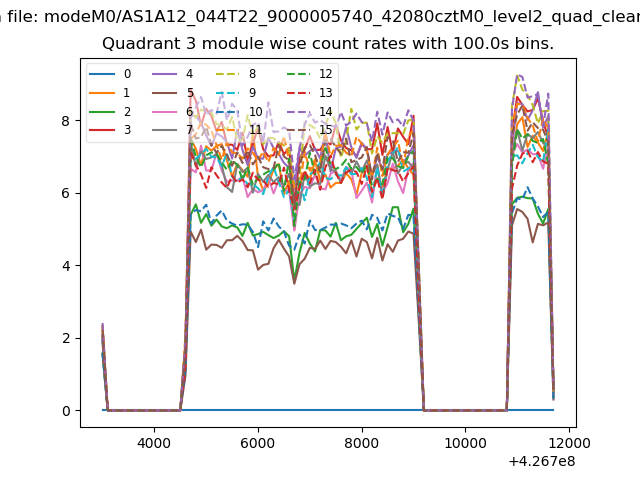 |
 |
| Parameter | Plot |
|---|---|
| CZT HV Monitor | 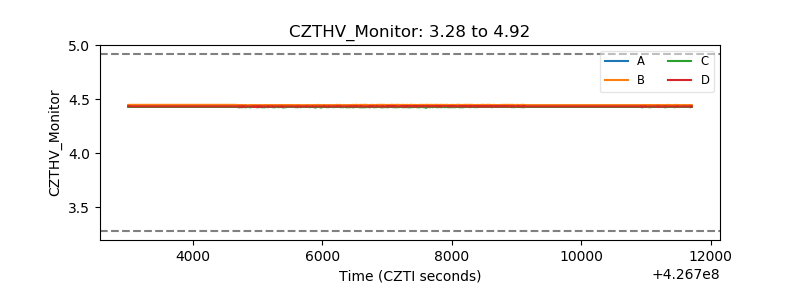 |
| D_VDD |  |
| Temperature 1 |  |
| Veto HV Monitor |  |
| Veto LLD | 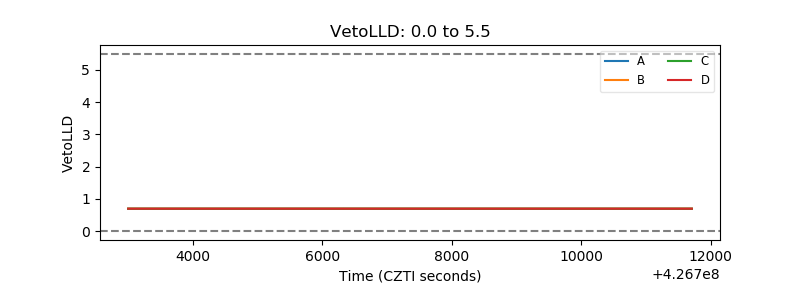 |
| Alpha Counter | 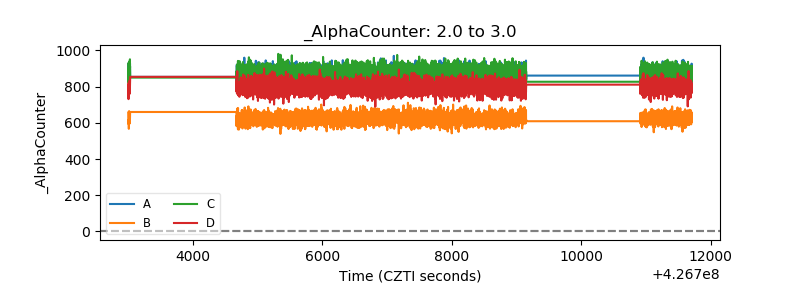 |
| _CPM_Rate | 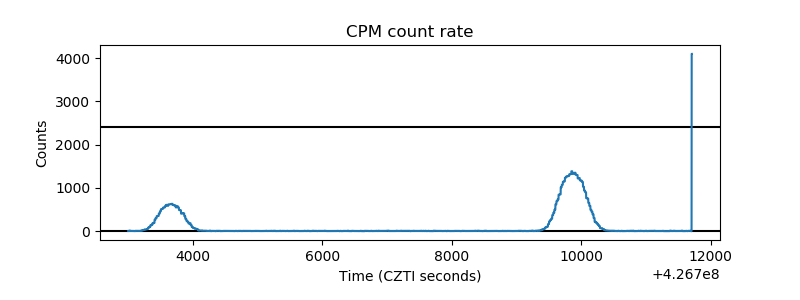 |
| CZT Counter | 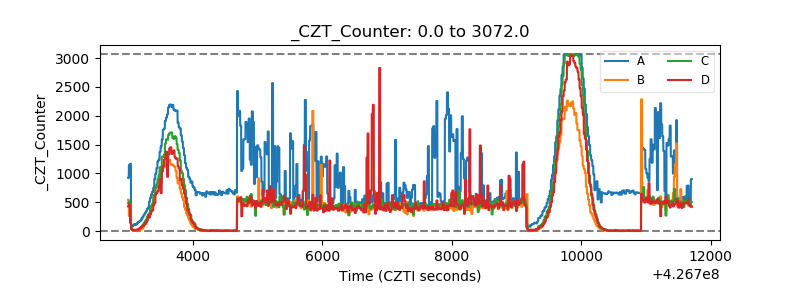 |
| +2.5 Volts monitor | 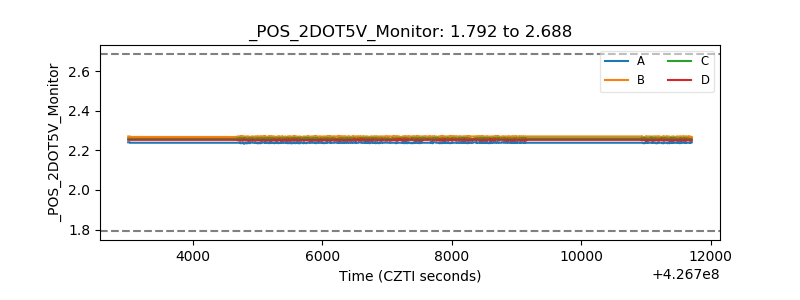 |
| +5 Volts monitor | 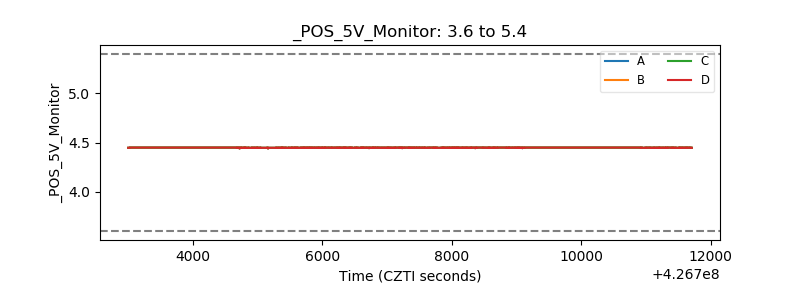 |
| _ROLL_ROT |  |
| _Roll_DEC | 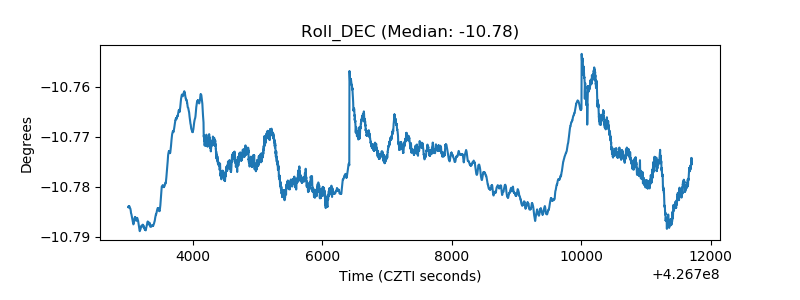 |
| _Roll_RA | 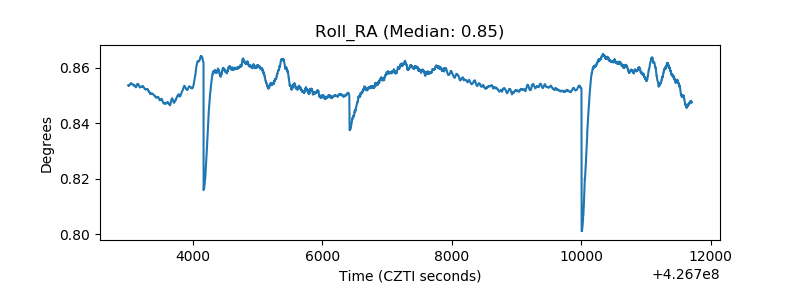 |
| Veto Counter | 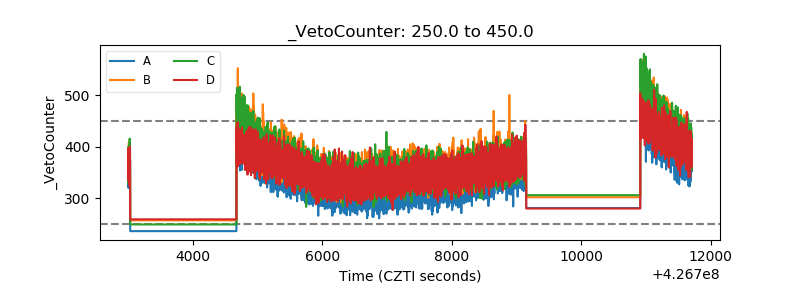 |