| Param | Original file | Final file |
|---|---|---|
| Filename | modeM0/AS1A12_044T22_9000005740_42081cztM0_level2.fits | modeM0/AS1A12_044T22_9000005740_42081cztM0_level2_quad_clean.evt |
| Size (bytes) | 312,396,480 | 89,179,200 |
| Size | 297.9 MB | 85.0 MB |
| Events in quadrant A | 3,613,564 | 591,566 |
| Events in quadrant B | 2,496,699 | 618,778 |
| Events in quadrant C | 2,480,581 | 591,110 |
| Events in quadrant D | 2,572,586 | 539,151 |
| Mode M0 | |||
|---|---|---|---|
| Quadrant | BADHDUFLAG | Total packets | Discarded packets |
| A | 0 | 13936 | 3 |
| B | 0 | 10866 | 2 |
| C | 0 | 10451 | 2 |
| D | 0 | 11224 | 2 |
| Mode SS | |||
|---|---|---|---|
| Quadrant | BADHDUFLAG | Total packets | Discarded packets |
| A | 0 | 104 | 0 |
| B | 0 | 104 | 0 |
| C | 0 | 104 | 0 |
| D | 0 | 104 | 0 |
| Mode M9 | |||
|---|---|---|---|
| Quadrant | BADHDUFLAG | Total packets | Discarded packets |
| A | 0 | 31 | 0 |
| B | 0 | 31 | 0 |
| C | 0 | 31 | 0 |
| D | 0 | 32 | 0 |
| Quadrant | Total seconds | Saturated seconds | Saturation percentage |
|---|---|---|---|
| A | 5137 | 140 | 2.725326% |
| B | 5137 | 45 | 0.875998% |
| C | 5137 | 4 | 0.077866% |
| D | 5137 | 33 | 0.642398% |
Noise dominated data is calculated using 1-second bins in cleaned event files. If a bin has >2000 counts, and if more than 50% of those come from <1% of pixels, then it is considered to be noise-dominated and hence unusable.
| Quadrant | # 1 sec bins | Bins with >0 counts | Bins with >2000 counts | High rate bins dominated by noise | Noise dominated (total time) | Noise dominated (detector-on time) | Marked lightcurve |
|---|---|---|---|---|---|---|---|
| A | 7019 | 5138 | 90 | 90 | 1.28% | 1.75% | 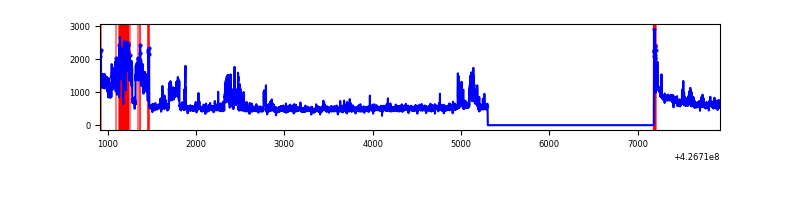 |
| B | 7019 | 5138 | 18 | 18 | 0.26% | 0.35% | 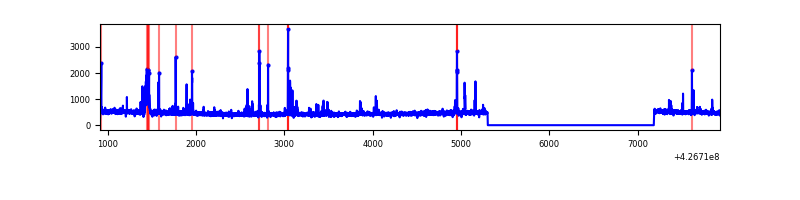 |
| C | 7019 | 5138 | 0 | 0 | 0.00% | 0.00% | 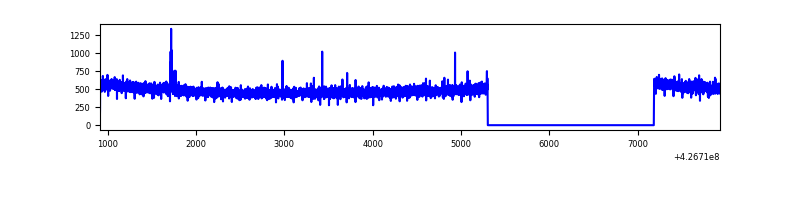 |
| D | 7019 | 5138 | 28 | 28 | 0.40% | 0.54% | 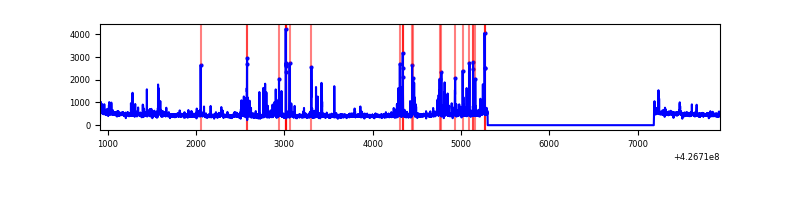 |
Top three noisy pixels from each quadrant. If the there are fewer than three noisy pixels in the level2.evt file, extra rows are filled as -1
| Pixel properties | Quadrant properties | ||||||
|---|---|---|---|---|---|---|---|
| Quadrant | DetID | PixID | Counts | Sigma | Mean | Median | Sigma |
| A | 15 | 222 | 821882 | 6850.68 | 579 | 567 | 119.9 |
| A | 10 | 83 | 511474 | 4261.53 | 579 | 567 | 119.9 |
| A | 15 | 223 | 27279 | 222.81 | 579 | 567 | 119.9 |
| B | 5 | 255 | 78698 | 688.6 | 584 | 568 | 113.5 |
| B | 3 | 112 | 71369 | 624.0 | 584 | 568 | 113.5 |
| B | 5 | 168 | 16060 | 136.54 | 584 | 568 | 113.5 |
| C | 15 | 214 | 212376 | 1568.37 | 578 | 583 | 135.0 |
| C | 15 | 111 | 8505 | 58.66 | 578 | 583 | 135.0 |
| C | 12 | 249 | 4503 | 29.03 | 578 | 583 | 135.0 |
| D | 13 | 249 | 118296 | 830.01 | 573 | 556 | 141.9 |
| D | 12 | 6 | 90623 | 634.93 | 573 | 556 | 141.9 |
| D | 1 | 52 | 67792 | 473.98 | 573 | 556 | 141.9 |
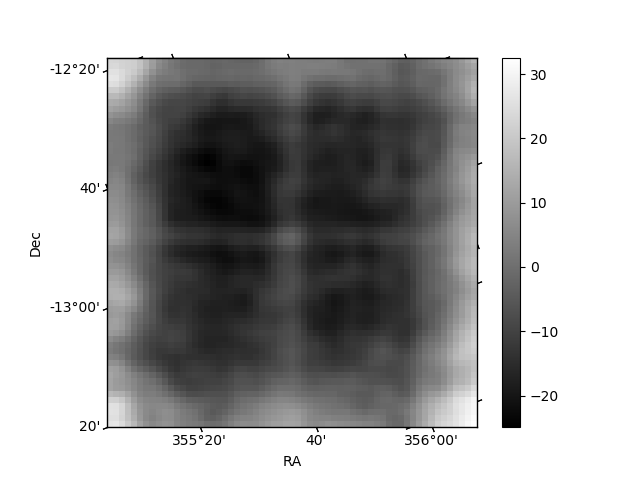
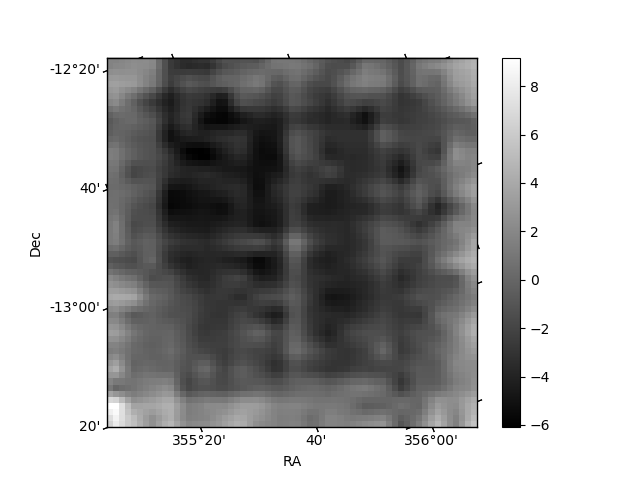
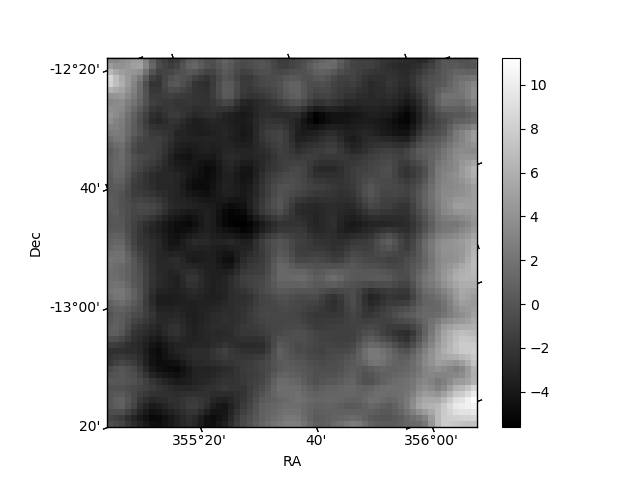
Histogram calculated using DETX and DETY for each event in the final _common_clean file
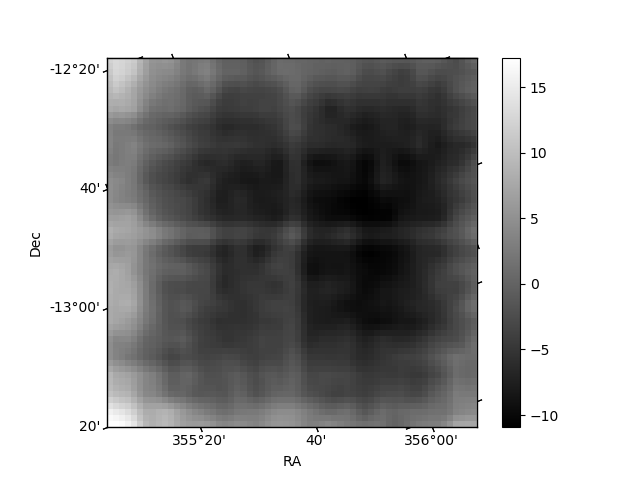
| Quadrant A | 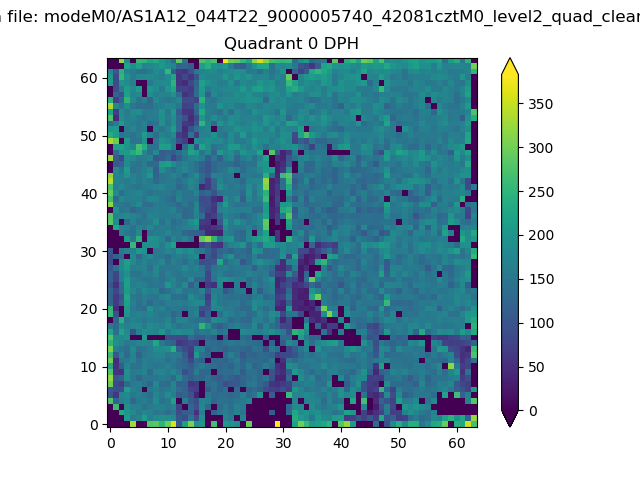 |
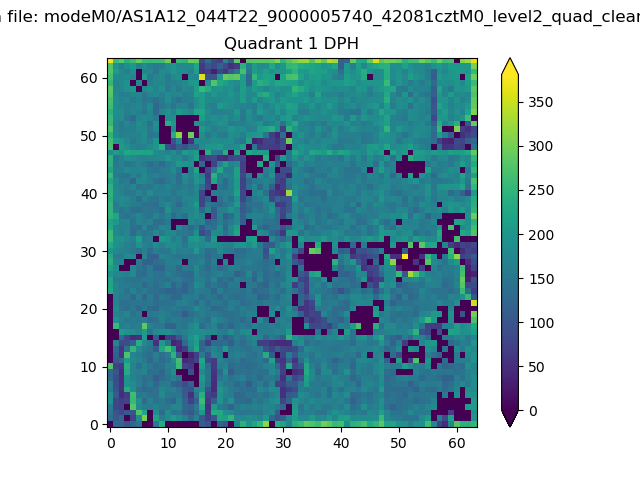 |
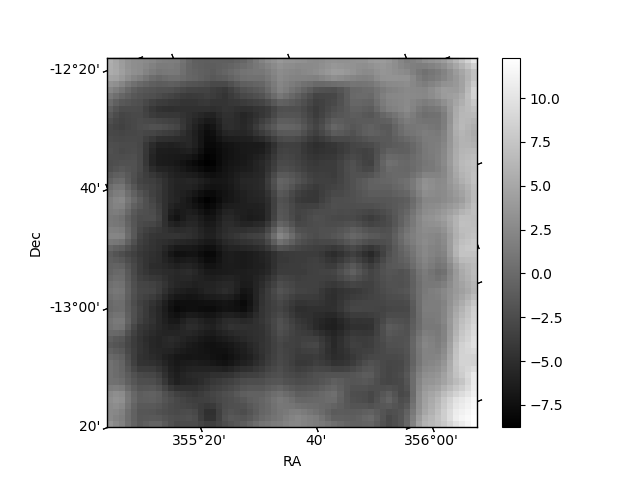
Quadrant B |
|---|---|---|---|
| Quadrant D |  |
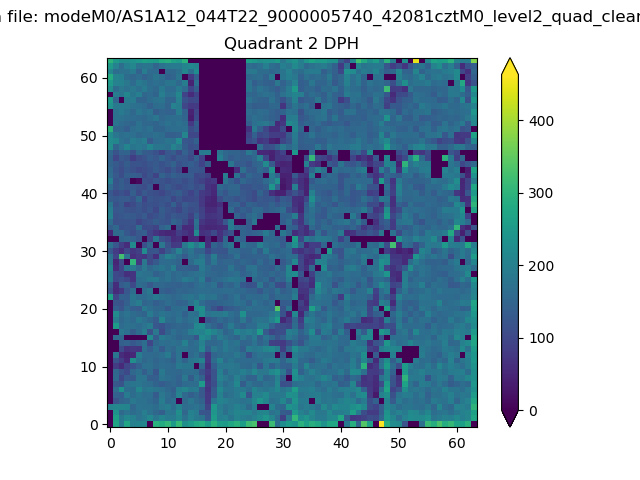 |
Quadrant C |
| Plot type | Count rate plots | Images |
|---|---|---|
| Comparison with Poisson distribution Blue bars denote a histogram of data divided into 1 sec bins. Red curve is a Poisson curve with rate = median count rate of data. |
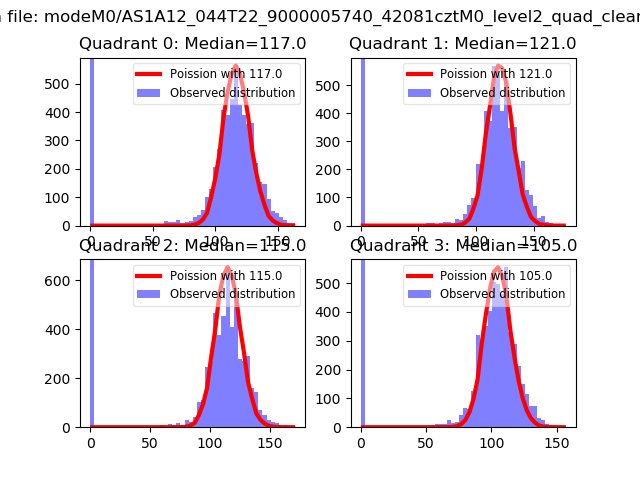 |
 |
| Quadrant-wise count rates Data is divided into 100 sec bins |
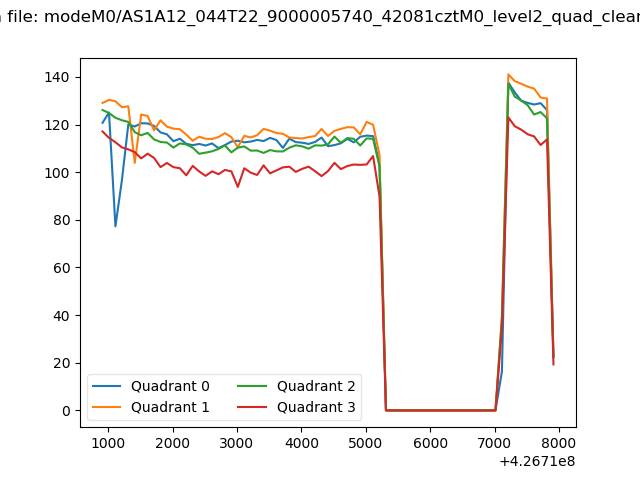 |
|
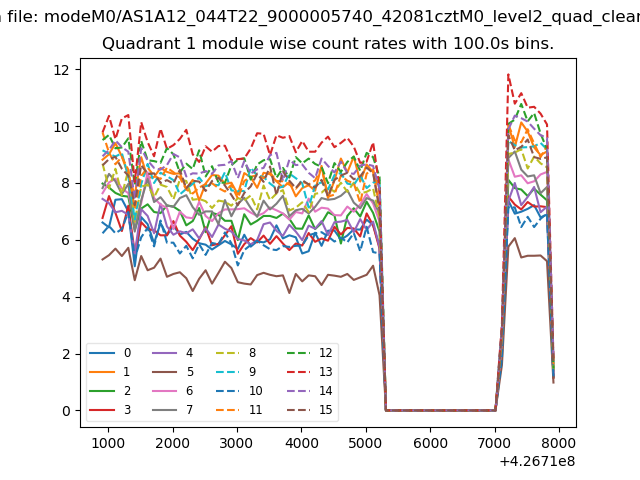
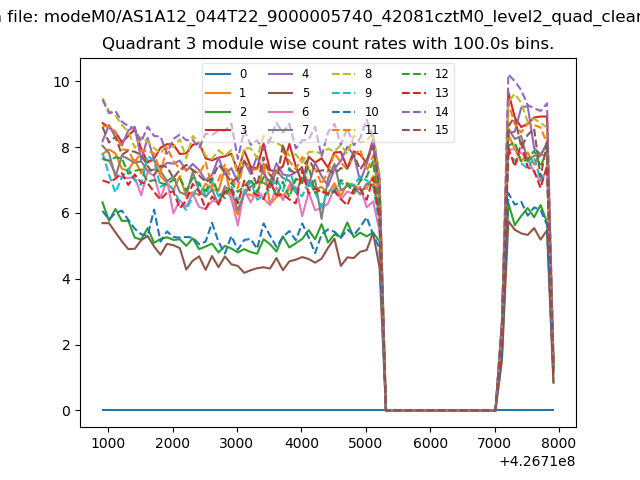
| Module-wise count rates for Quadrant A Data is divided into 100 sec bins |
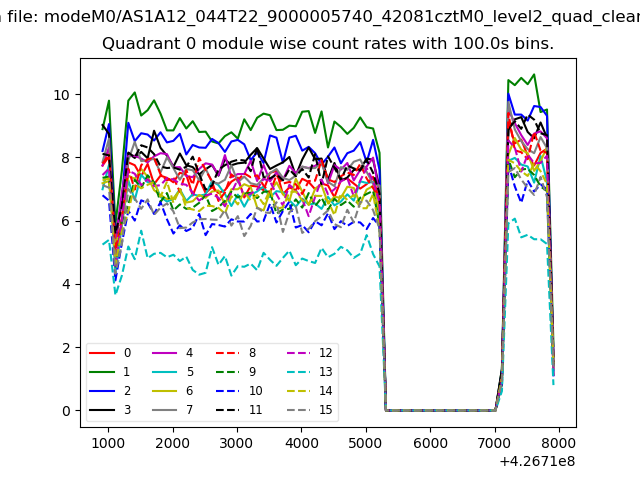 |
 |
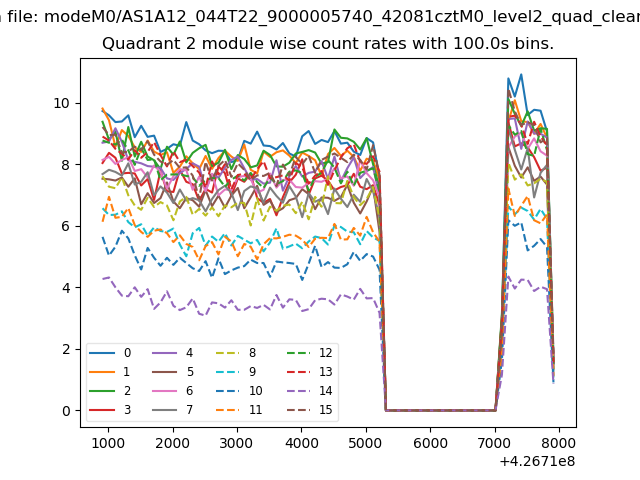
| Module-wise count rates for Quadrant B Data is divided into 100 sec bins |
 |
 |
| Module-wise count rates for Quadrant C Data is divided into 100 sec bins |
 |
 |
| Module-wise count rates for Quadrant D Data is divided into 100 sec bins |
 |
 |
| Parameter | Plot |
|---|---|
| CZT HV Monitor | 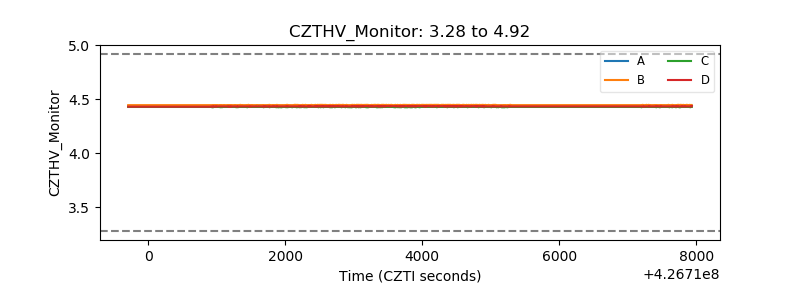 |
| D_VDD | 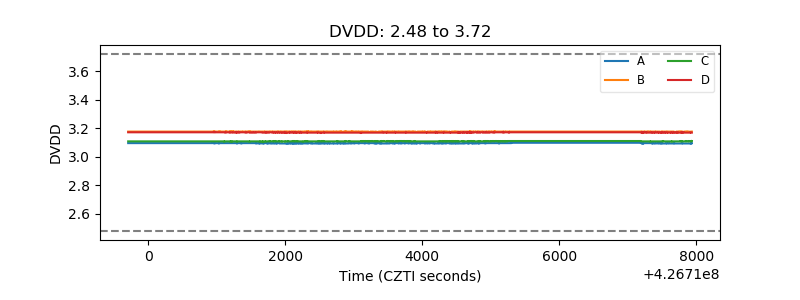 |
| Temperature 1 | 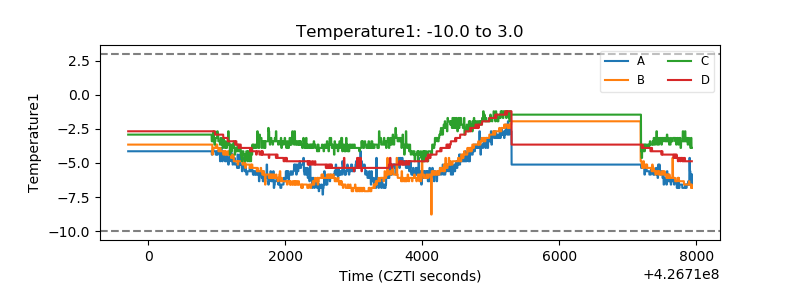 |
| Veto HV Monitor | 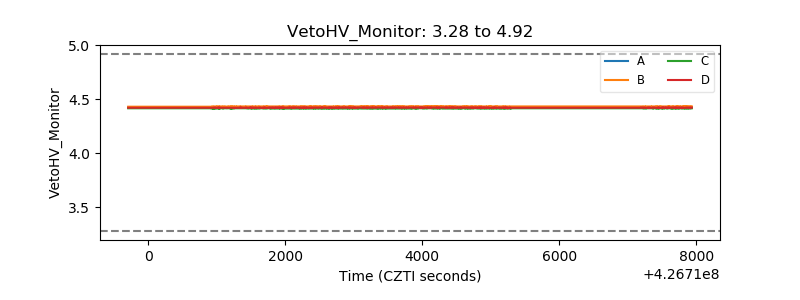 |
| Veto LLD | 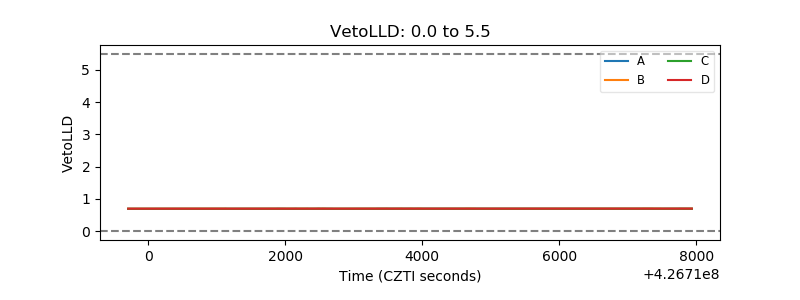 |
| Alpha Counter | 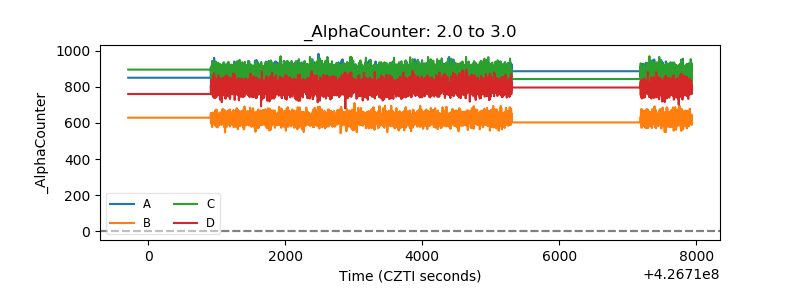 |
| _CPM_Rate | 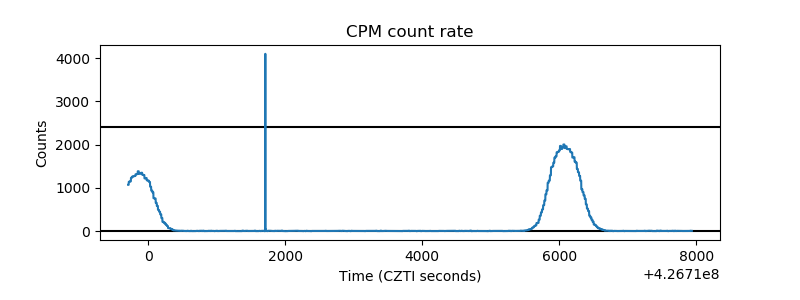 |
| CZT Counter | 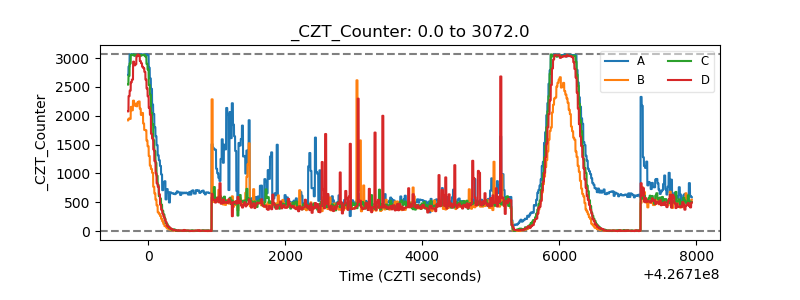 |
| +2.5 Volts monitor | 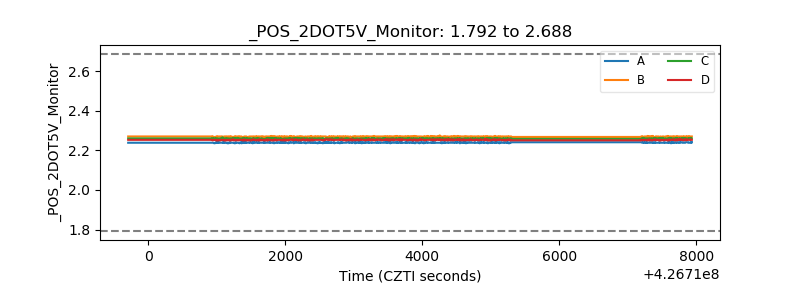 |
| +5 Volts monitor | 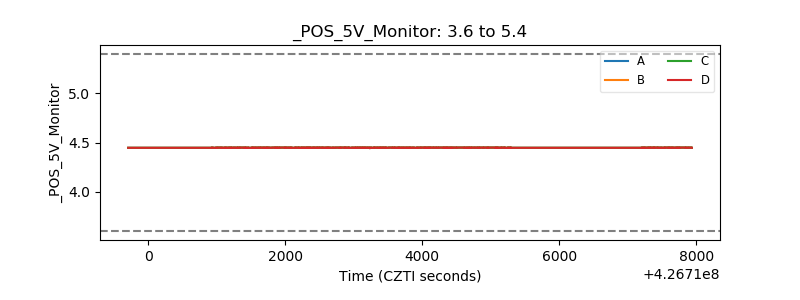 |
| _ROLL_ROT | 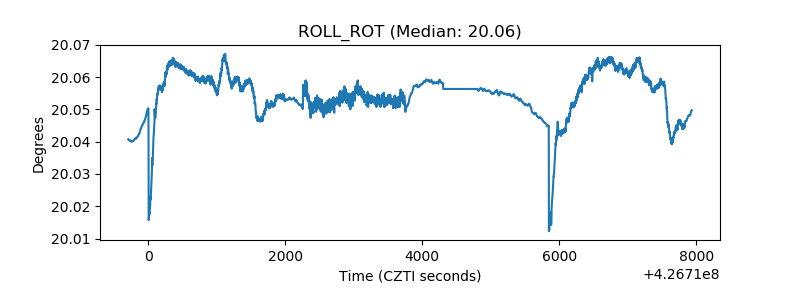 |
| _Roll_DEC | 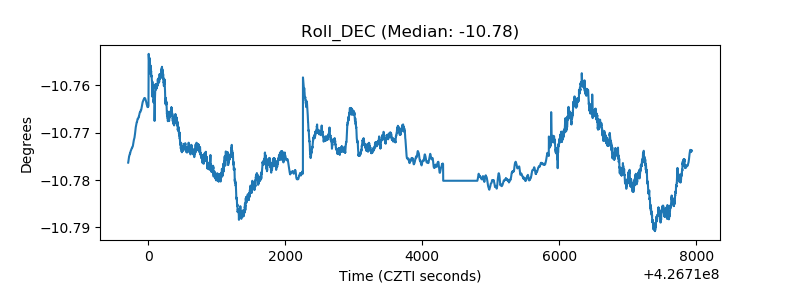 |
| _Roll_RA | 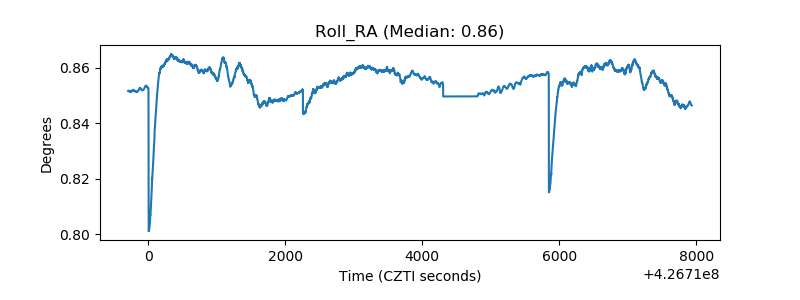 |
| Veto Counter | 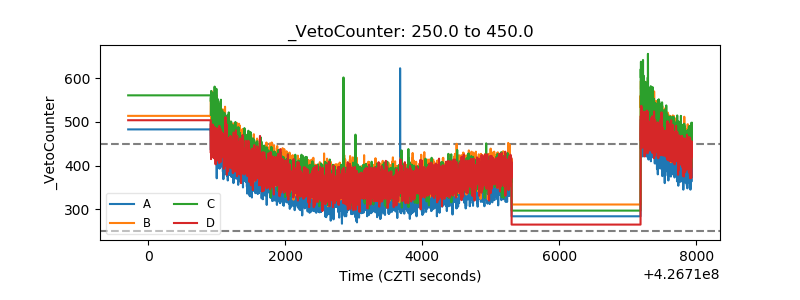 |