| Param | Original file | Final file |
|---|---|---|
| Filename | modeM0/AS1A12_044T22_9000005740_42082cztM0_level2.fits | modeM0/AS1A12_044T22_9000005740_42082cztM0_level2_quad_clean.evt |
| Size (bytes) | 352,241,280 | 97,695,360 |
| Size | 335.9 MB | 93.2 MB |
| Events in quadrant A | 4,276,303 | 649,002 |
| Events in quadrant B | 2,572,485 | 683,601 |
| Events in quadrant C | 2,693,899 | 651,929 |
| Events in quadrant D | 3,067,623 | 588,692 |
| Mode M0 | |||
|---|---|---|---|
| Quadrant | BADHDUFLAG | Total packets | Discarded packets |
| A | 0 | 16415 | 3 |
| B | 0 | 11265 | 2 |
| C | 0 | 11198 | 2 |
| D | 0 | 12904 | 2 |
| Mode SS | |||
|---|---|---|---|
| Quadrant | BADHDUFLAG | Total packets | Discarded packets |
| A | 0 | 114 | 0 |
| B | 0 | 114 | 0 |
| C | 0 | 114 | 0 |
| D | 0 | 114 | 0 |
| Mode M9 | |||
|---|---|---|---|
| Quadrant | BADHDUFLAG | Total packets | Discarded packets |
| A | 0 | 39 | 0 |
| B | 0 | 39 | 0 |
| C | 0 | 39 | 0 |
| D | 0 | 39 | 0 |
| Quadrant | Total seconds | Saturated seconds | Saturation percentage |
|---|---|---|---|
| A | 5505 | 133 | 2.415985% |
| B | 5505 | 10 | 0.181653% |
| C | 5505 | 7 | 0.127157% |
| D | 5505 | 120 | 2.179837% |
Noise dominated data is calculated using 1-second bins in cleaned event files. If a bin has >2000 counts, and if more than 50% of those come from <1% of pixels, then it is considered to be noise-dominated and hence unusable.
| Quadrant | # 1 sec bins | Bins with >0 counts | Bins with >2000 counts | High rate bins dominated by noise | Noise dominated (total time) | Noise dominated (detector-on time) | Marked lightcurve |
|---|---|---|---|---|---|---|---|
| A | 9390 | 5507 | 82 | 82 | 0.87% | 1.49% | 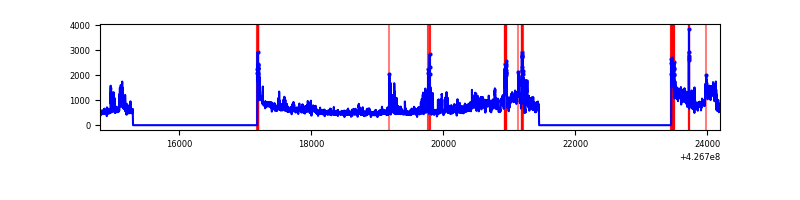 |
| B | 9390 | 5507 | 5 | 5 | 0.05% | 0.09% | 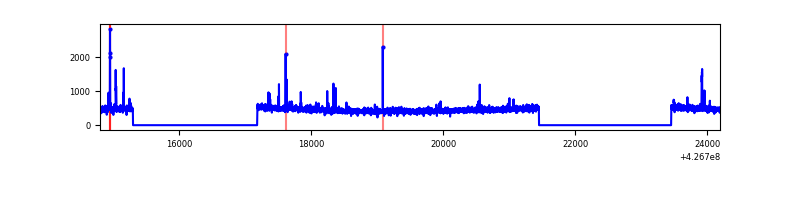 |
| C | 9390 | 5507 | 0 | 0 | 0.00% | 0.00% | 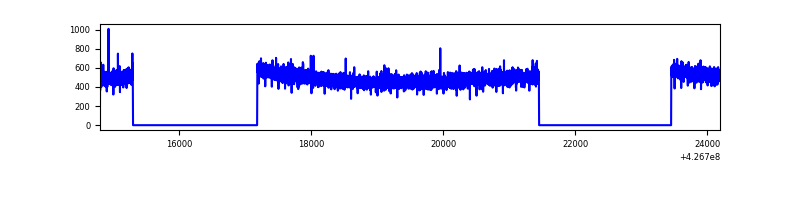 |
| D | 9390 | 5507 | 102 | 102 | 1.09% | 1.85% | 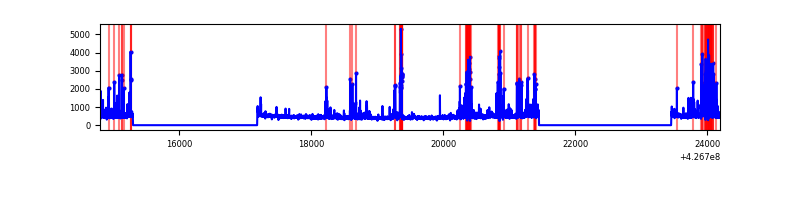 |
Top three noisy pixels from each quadrant. If the there are fewer than three noisy pixels in the level2.evt file, extra rows are filled as -1
| Pixel properties | Quadrant properties | ||||||
|---|---|---|---|---|---|---|---|
| Quadrant | DetID | PixID | Counts | Sigma | Mean | Median | Sigma |
| A | 15 | 222 | 1200634 | 9247.8 | 630 | 618 | 129.8 |
| A | 10 | 83 | 516849 | 3978.28 | 630 | 618 | 129.8 |
| A | 15 | 223 | 100496 | 769.7 | 630 | 618 | 129.8 |
| B | 3 | 112 | 50314 | 400.15 | 637 | 619 | 124.2 |
| B | 14 | 16 | 15832 | 122.5 | 637 | 619 | 124.2 |
| B | 12 | 111 | 15271 | 117.98 | 637 | 619 | 124.2 |
| C | 15 | 214 | 228346 | 1544.82 | 631 | 636 | 147.4 |
| C | 15 | 159 | 4303 | 24.88 | 631 | 636 | 147.4 |
| C | 13 | 61 | 4233 | 24.4 | 631 | 636 | 147.4 |
| D | 12 | 6 | 259267 | 1682.46 | 622 | 604 | 153.7 |
| D | 13 | 249 | 214879 | 1393.74 | 622 | 604 | 153.7 |
| D | 1 | 52 | 88230 | 569.96 | 622 | 604 | 153.7 |
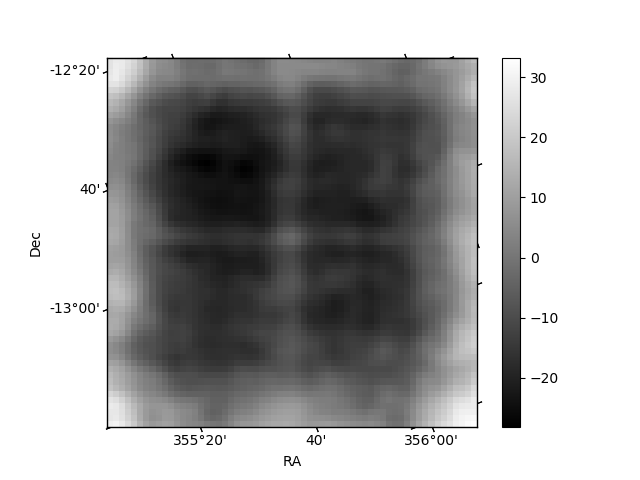
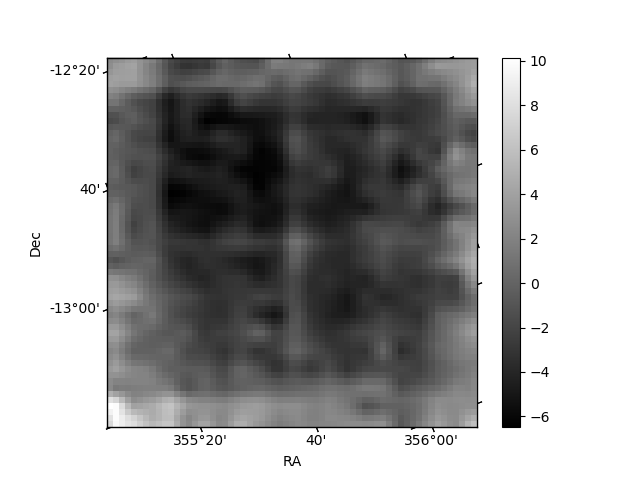
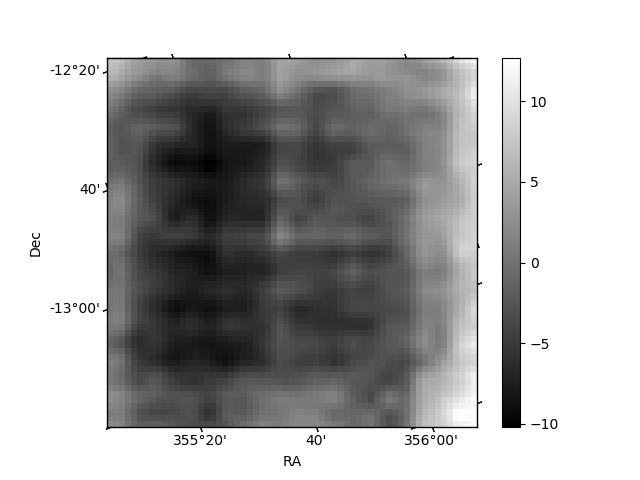
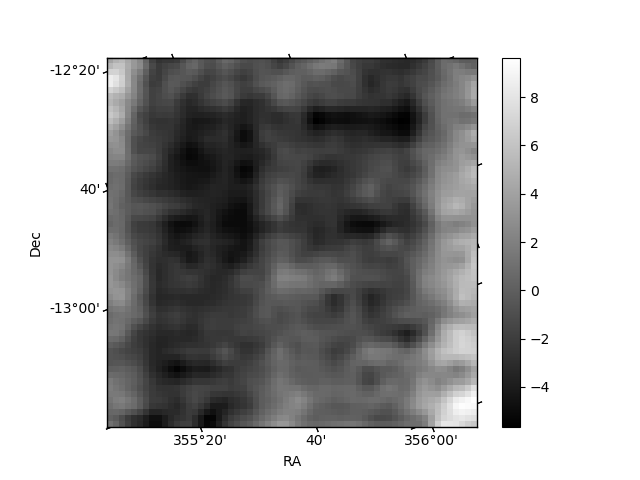
Histogram calculated using DETX and DETY for each event in the final _common_clean file
| Quadrant A | 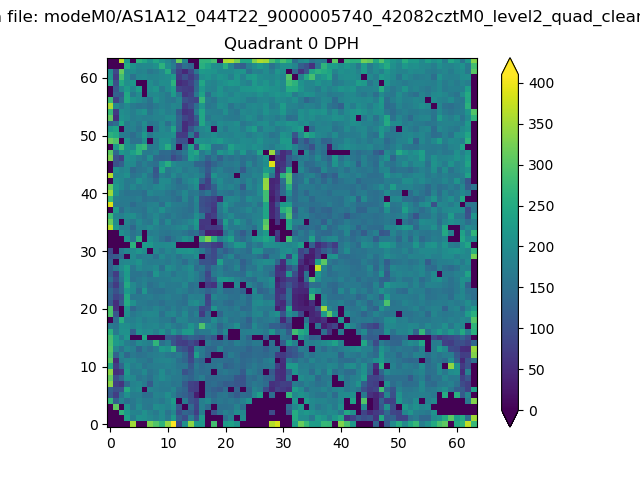 |
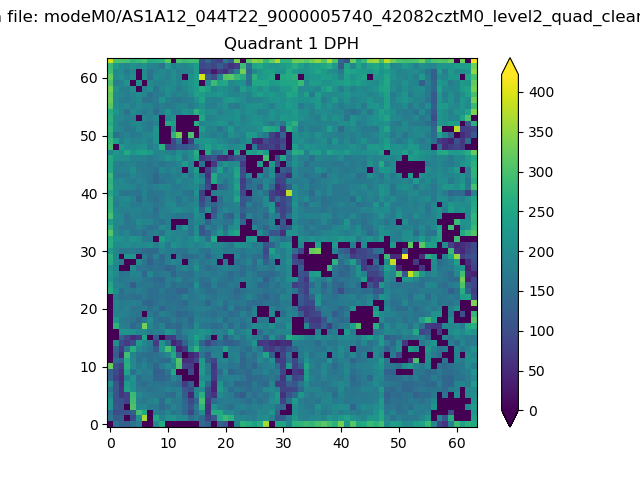 |
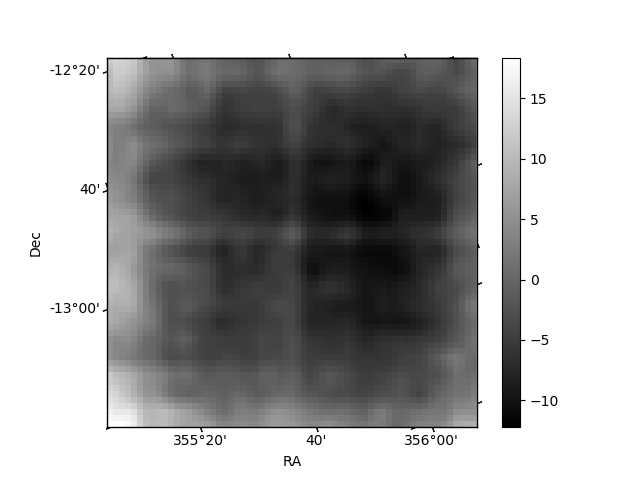
Quadrant B |
|---|---|---|---|
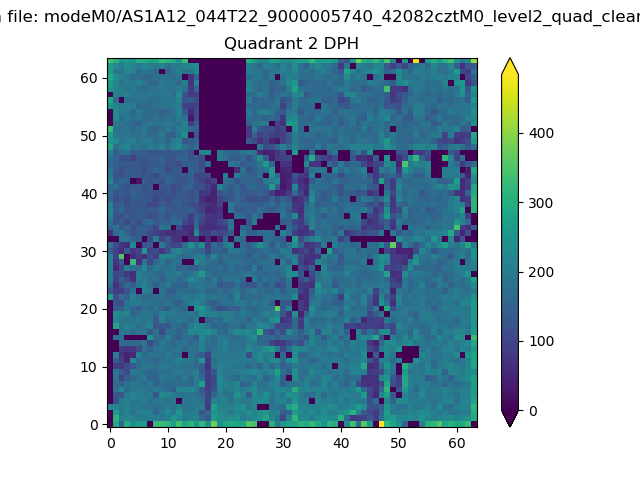
| Quadrant D | 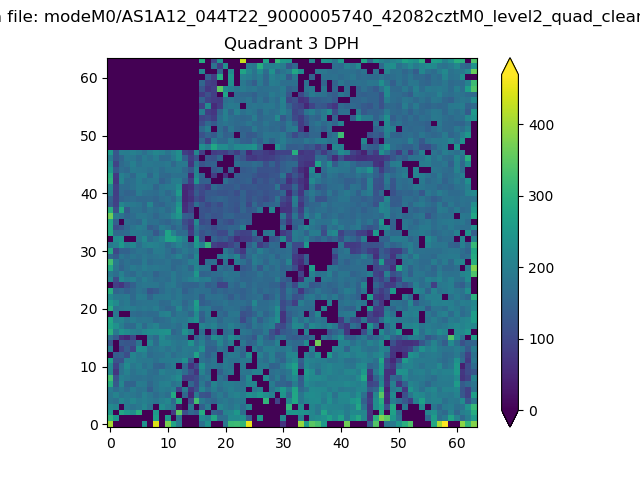 |
 |
Quadrant C |
| Plot type | Count rate plots | Images |
|---|---|---|
| Comparison with Poisson distribution Blue bars denote a histogram of data divided into 1 sec bins. Red curve is a Poisson curve with rate = median count rate of data. |
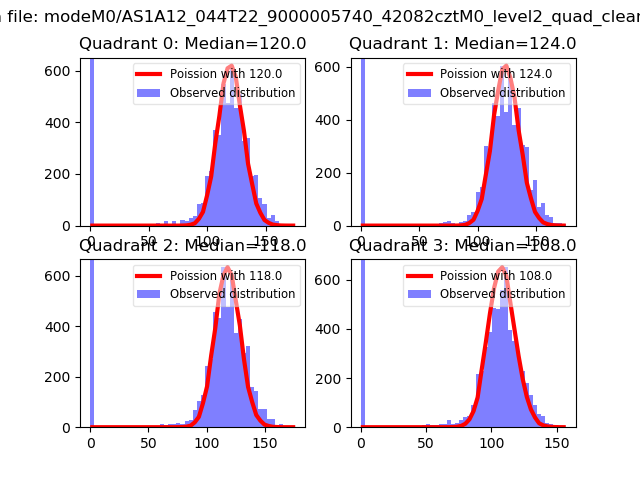 |
 |
| Quadrant-wise count rates Data is divided into 100 sec bins |
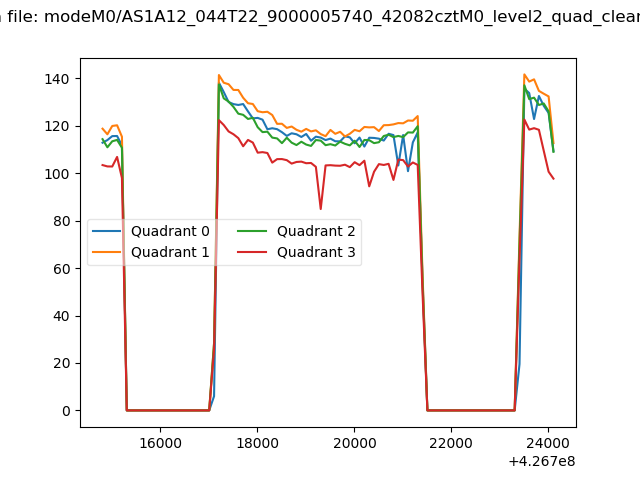 |
|
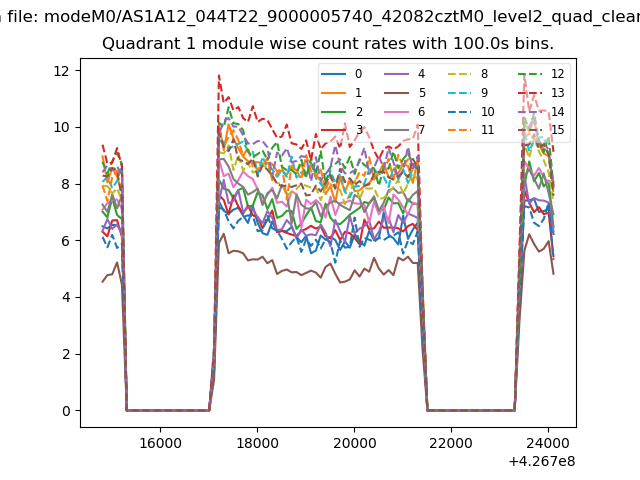
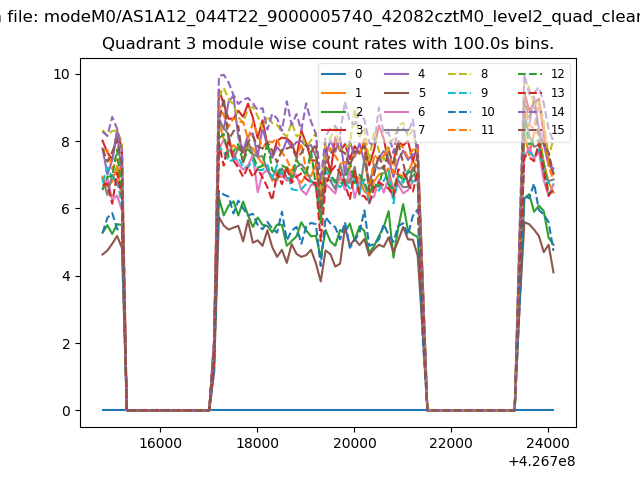
| Module-wise count rates for Quadrant A Data is divided into 100 sec bins |
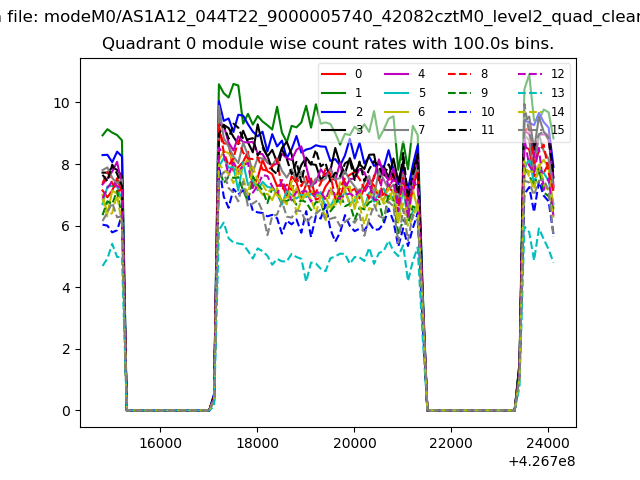 |
 |
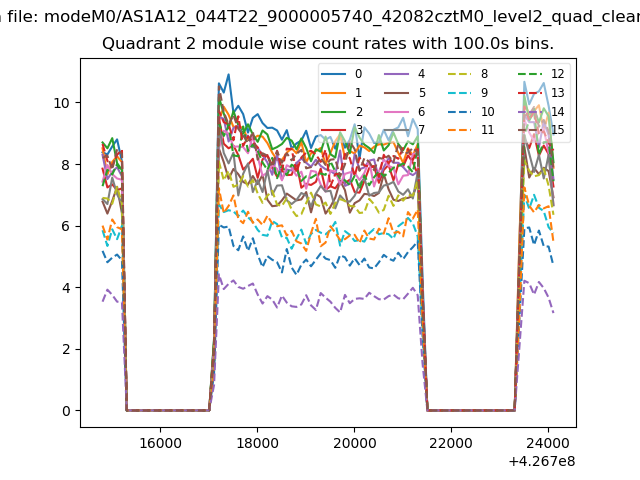
| Module-wise count rates for Quadrant B Data is divided into 100 sec bins |
 |
 |
| Module-wise count rates for Quadrant C Data is divided into 100 sec bins |
 |
 |
| Module-wise count rates for Quadrant D Data is divided into 100 sec bins |
 |
 |
| Parameter | Plot |
|---|---|
| CZT HV Monitor | 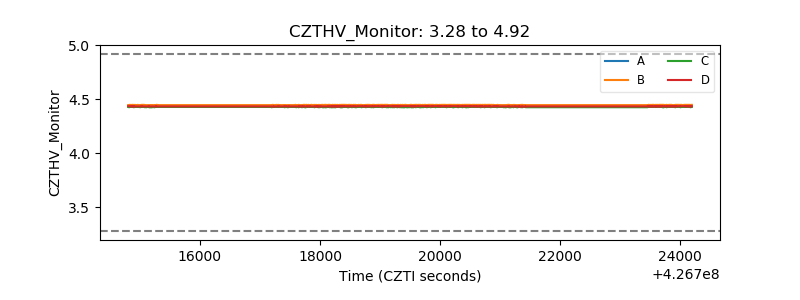 |
| D_VDD | 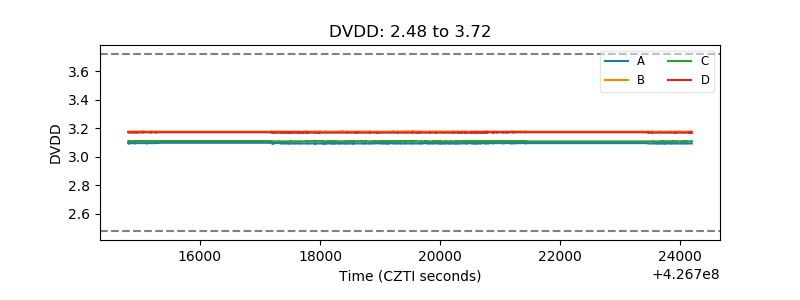 |
| Temperature 1 |  |
| Veto HV Monitor | 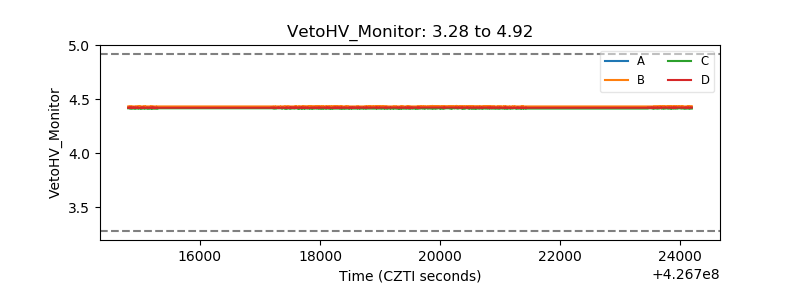 |
| Veto LLD | 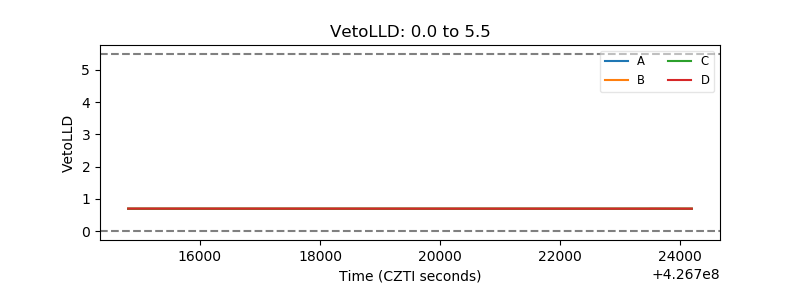 |
| Alpha Counter | 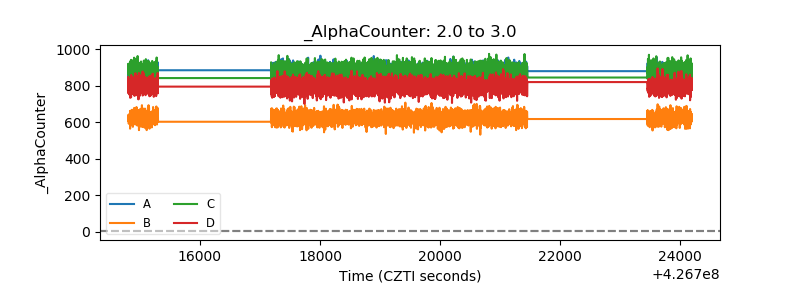 |
| _CPM_Rate | 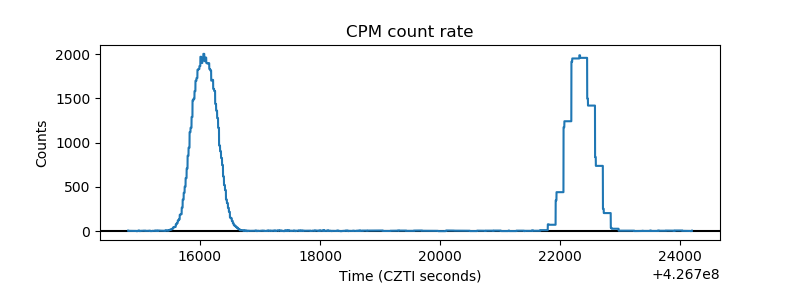 |
| CZT Counter | 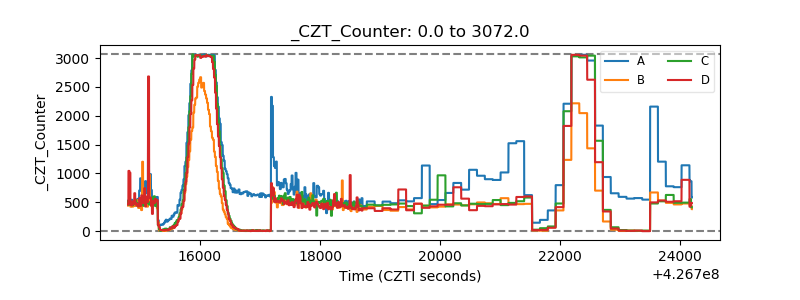 |
| +2.5 Volts monitor | 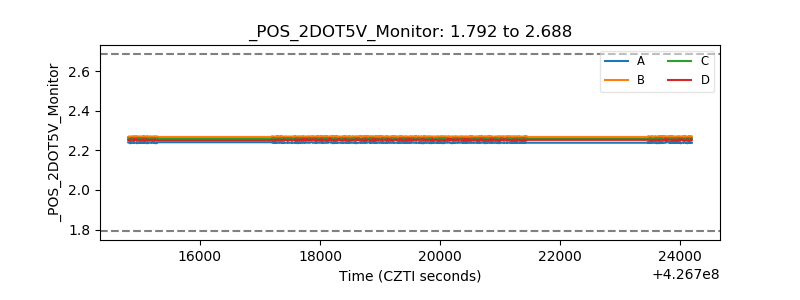 |
| +5 Volts monitor |  |
| _ROLL_ROT | 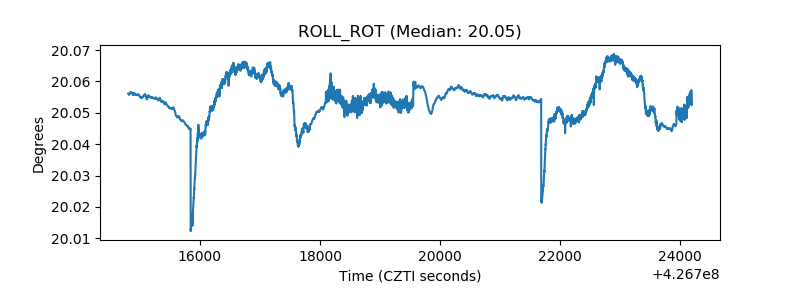 |
| _Roll_DEC | 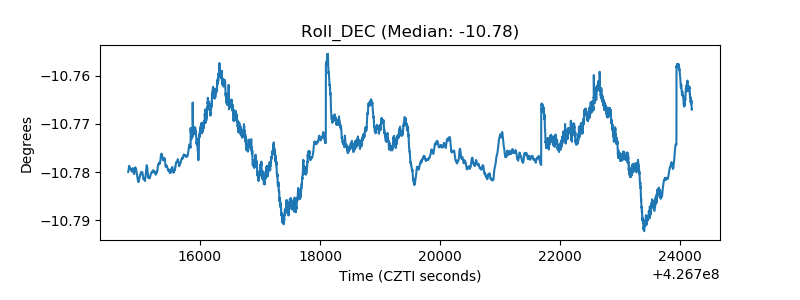 |
| _Roll_RA | 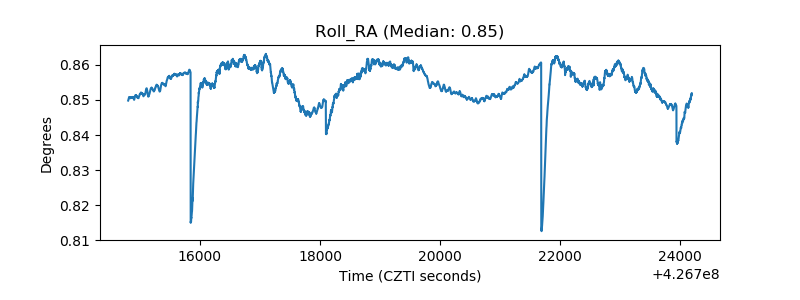 |
| Veto Counter | 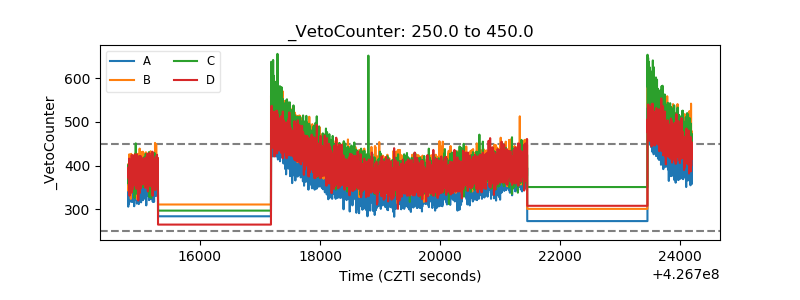 |