| Param | Original file | Final file |
|---|---|---|
| Filename | modeM0/AS1A12_044T22_9000005740_42083cztM0_level2.fits | modeM0/AS1A12_044T22_9000005740_42083cztM0_level2_quad_clean.evt |
| Size (bytes) | 76,135,680 | 13,386,240 |
| Size | 72.6 MB | 12.8 MB |
| Events in quadrant A | 1,569,735 | 53,755 |
| Events in quadrant B | 377,613 | 103,177 |
| Events in quadrant C | 424,204 | 97,389 |
| Events in quadrant D | 382,368 | 89,160 |
| Mode M0 | |||
|---|---|---|---|
| Quadrant | BADHDUFLAG | Total packets | Discarded packets |
| A | 0 | 5209 | 4 |
| B | 0 | 1609 | 1 |
| C | 0 | 1693 | 1 |
| D | 0 | 1656 | 1 |
| Mode SS | |||
|---|---|---|---|
| Quadrant | BADHDUFLAG | Total packets | Discarded packets |
| A | 0 | 16 | 0 |
| B | 0 | 16 | 0 |
| C | 0 | 16 | 0 |
| D | 0 | 16 | 0 |
| Mode M9 | |||
|---|---|---|---|
| Quadrant | BADHDUFLAG | Total packets | Discarded packets |
| A | 0 | 2 | 0 |
| B | 0 | 2 | 0 |
| C | 0 | 2 | 0 |
| D | 0 | 2 | 0 |
| Quadrant | Total seconds | Saturated seconds | Saturation percentage |
|---|---|---|---|
| A | 785 | 425 | 54.140127% |
| B | 785 | 3 | 0.382166% |
| C | 785 | 1 | 0.127389% |
| D | 785 | 6 | 0.764331% |
Noise dominated data is calculated using 1-second bins in cleaned event files. If a bin has >2000 counts, and if more than 50% of those come from <1% of pixels, then it is considered to be noise-dominated and hence unusable.
| Quadrant | # 1 sec bins | Bins with >0 counts | Bins with >2000 counts | High rate bins dominated by noise | Noise dominated (total time) | Noise dominated (detector-on time) | Marked lightcurve |
|---|---|---|---|---|---|---|---|
| A | 785 | 785 | 455 | 455 | 57.96% | 57.96% | 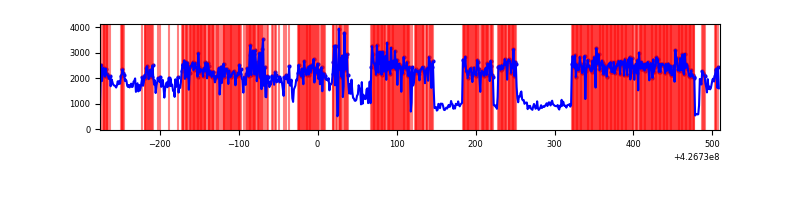 |
| B | 785 | 785 | 1 | 1 | 0.13% | 0.13% | 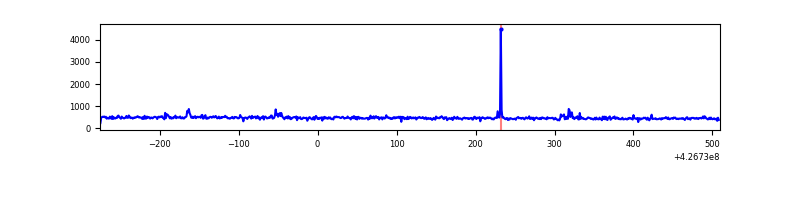 |
| C | 785 | 785 | 0 | 0 | 0.00% | 0.00% |  |
| D | 785 | 785 | 5 | 5 | 0.64% | 0.64% | 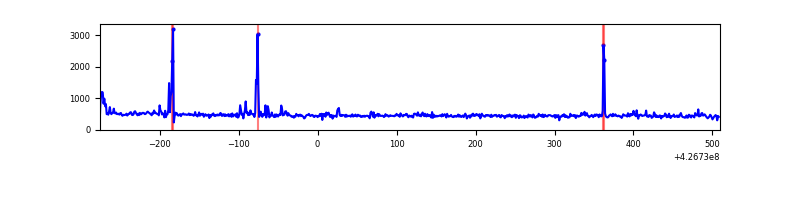 |
Top three noisy pixels from each quadrant. If the there are fewer than three noisy pixels in the level2.evt file, extra rows are filled as -1
| Pixel properties | Quadrant properties | ||||||
|---|---|---|---|---|---|---|---|
| Quadrant | DetID | PixID | Counts | Sigma | Mean | Median | Sigma |
| A | 15 | 222 | 1127639 | 62301.62 | 79 | 77 | 18.1 |
| A | 10 | 83 | 132093 | 7294.33 | 79 | 77 | 18.1 |
| A | 13 | 6 | 2283 | 121.89 | 79 | 77 | 18.1 |
| B | 5 | 255 | 13575 | 678.99 | 92 | 90 | 19.9 |
| B | 12 | 111 | 2212 | 106.85 | 92 | 90 | 19.9 |
| B | 11 | 111 | 2060 | 99.19 | 92 | 90 | 19.9 |
| C | 15 | 214 | 37486 | 1561.41 | 93 | 94 | 23.9 |
| C | 9 | 54 | 22080 | 918.09 | 93 | 94 | 23.9 |
| C | 12 | 249 | 825 | 30.52 | 93 | 94 | 23.9 |
| D | 12 | 6 | 22020 | 947.34 | 89 | 87 | 23.2 |
| D | 1 | 47 | 4252 | 179.9 | 89 | 87 | 23.2 |
| D | 12 | 218 | 3480 | 146.55 | 89 | 87 | 23.2 |
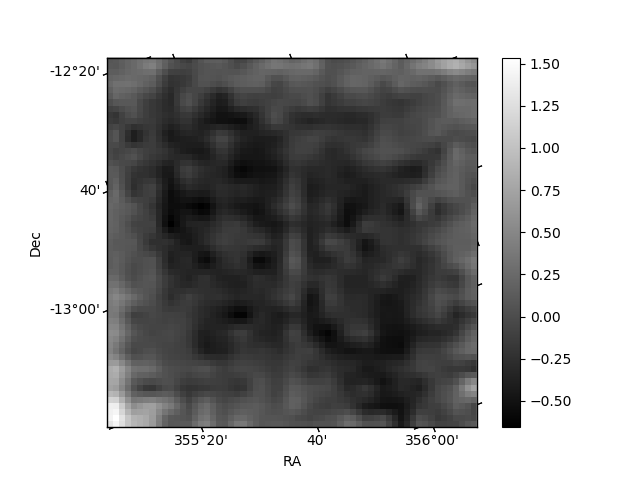
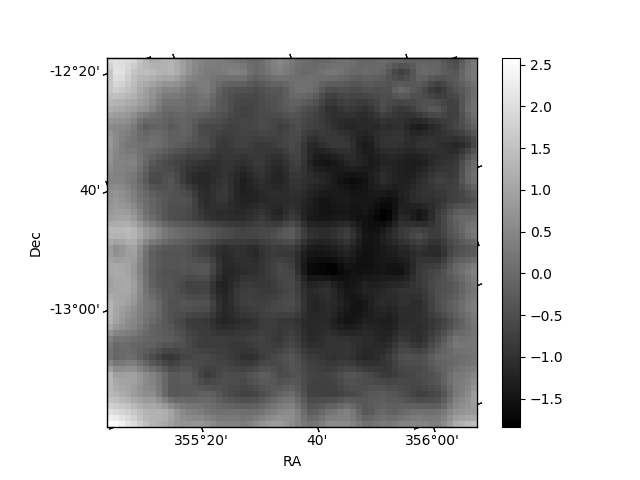
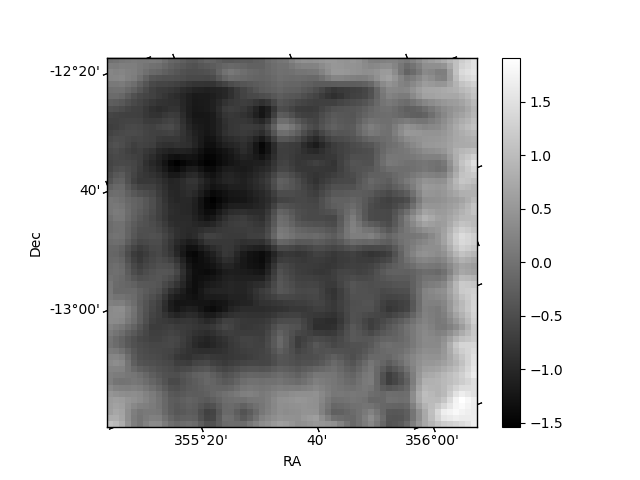
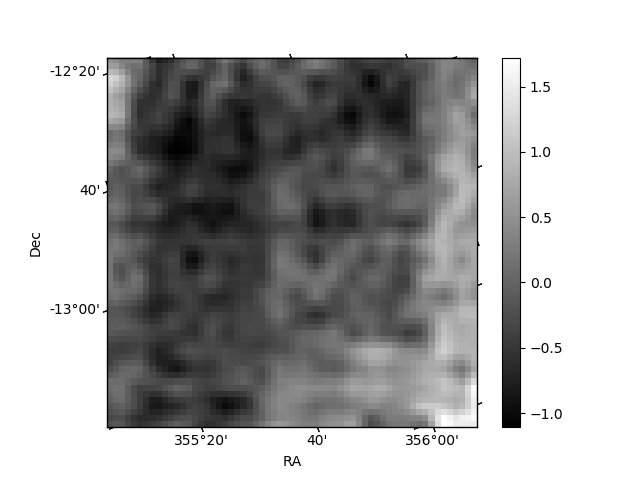
Histogram calculated using DETX and DETY for each event in the final _common_clean file
| Quadrant A | 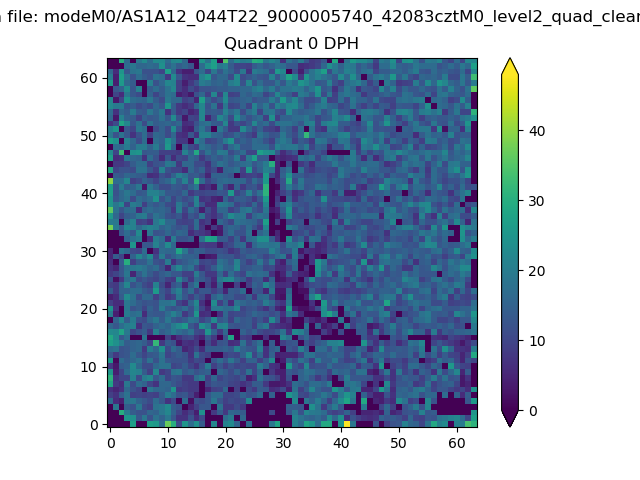 |
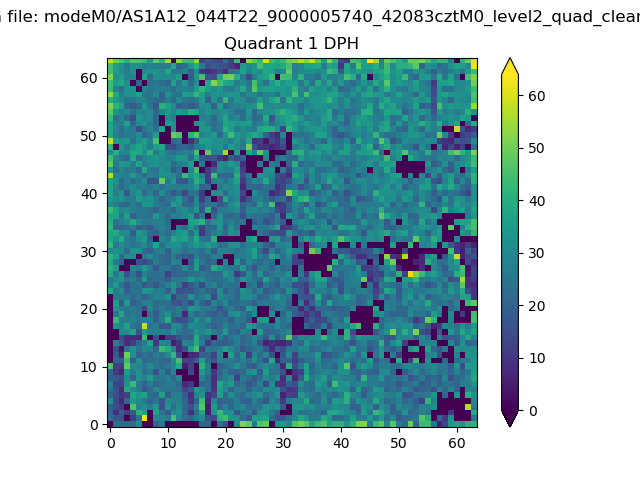 |
Quadrant B |
|---|---|---|---|
| Quadrant D | 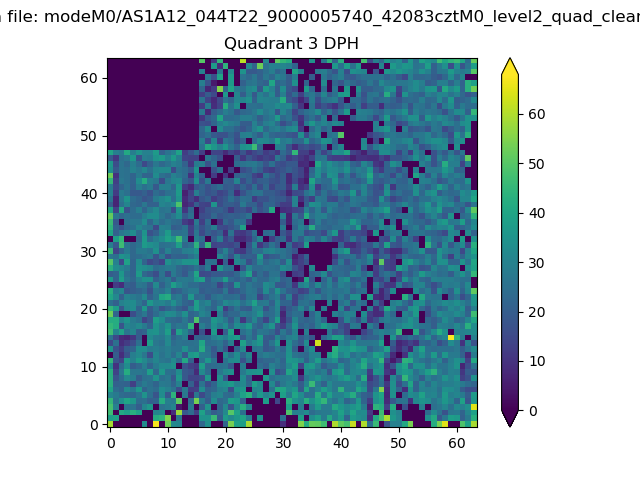 |
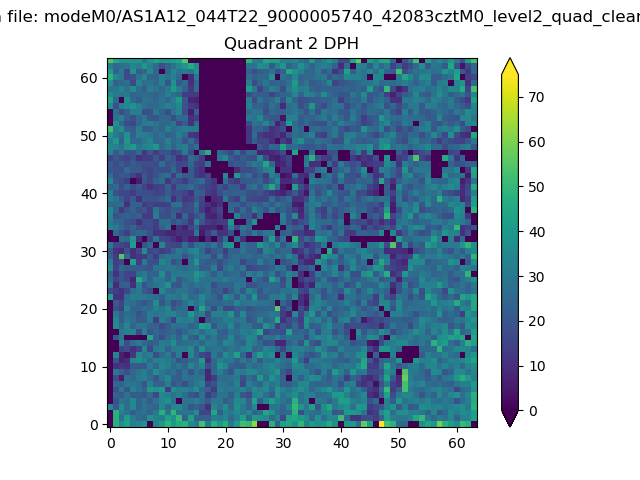 |
Quadrant C |
| Plot type | Count rate plots | Images |
|---|---|---|
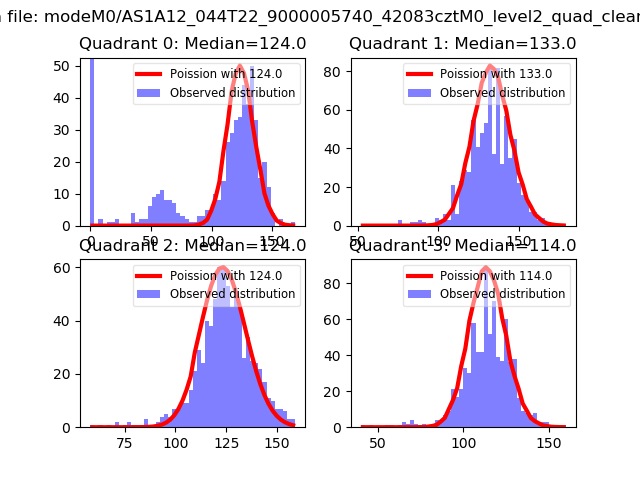
| Comparison with Poisson distribution Blue bars denote a histogram of data divided into 1 sec bins. Red curve is a Poisson curve with rate = median count rate of data. |
 |
 |
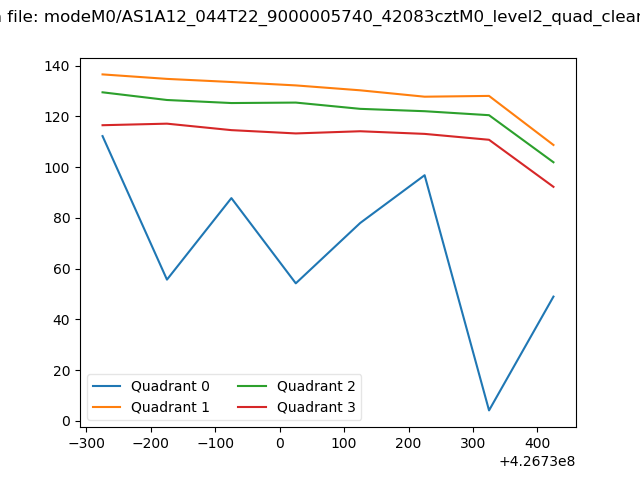
| Quadrant-wise count rates Data is divided into 100 sec bins |
 |
|
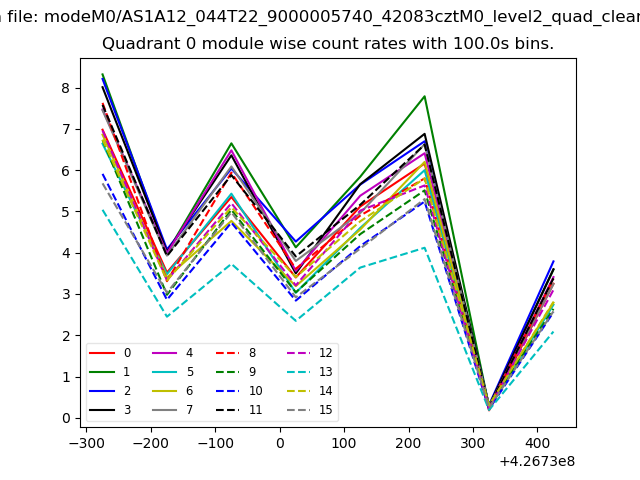
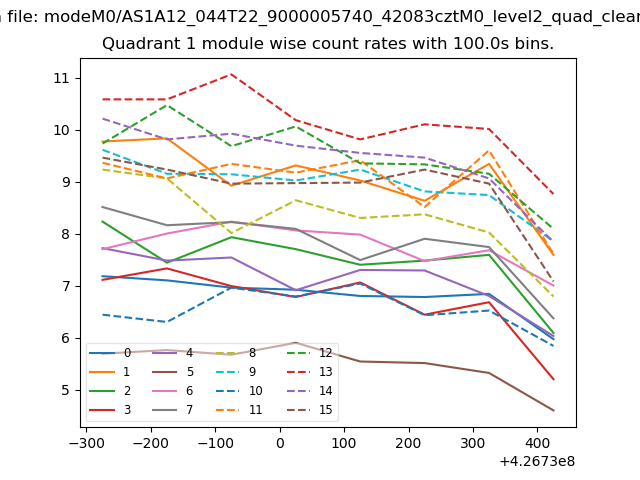
| Module-wise count rates for Quadrant A Data is divided into 100 sec bins |
 |
 |
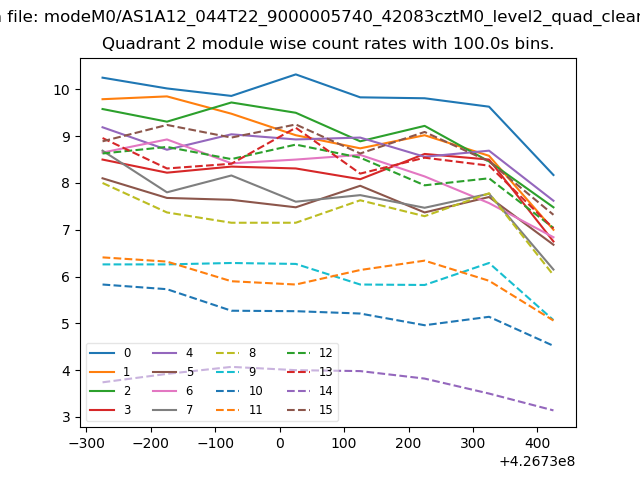
| Module-wise count rates for Quadrant B Data is divided into 100 sec bins |
 |
 |
| Module-wise count rates for Quadrant C Data is divided into 100 sec bins |
 |
 |
| Module-wise count rates for Quadrant D Data is divided into 100 sec bins |
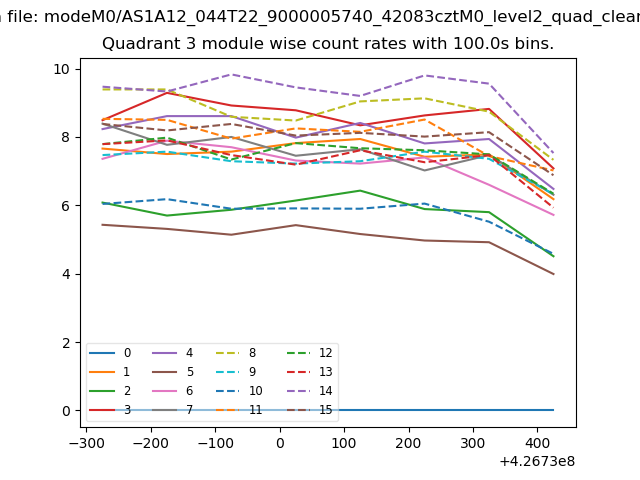 |
 |
| Parameter | Plot |
|---|---|
| CZT HV Monitor | 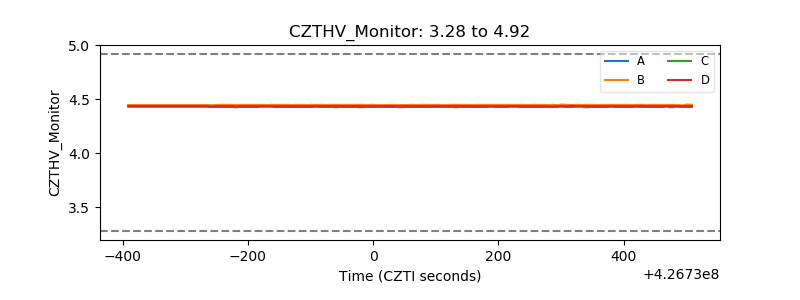 |
| D_VDD | 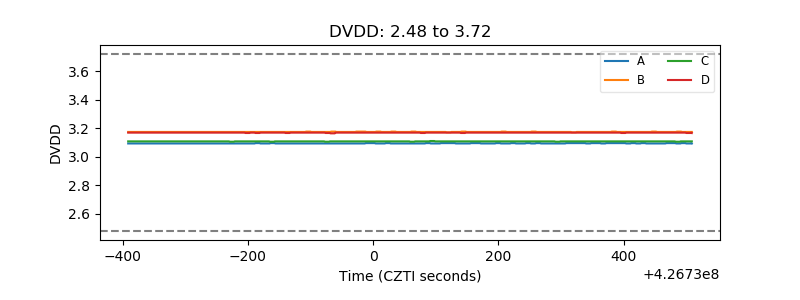 |
| Temperature 1 |  |
| Veto HV Monitor | 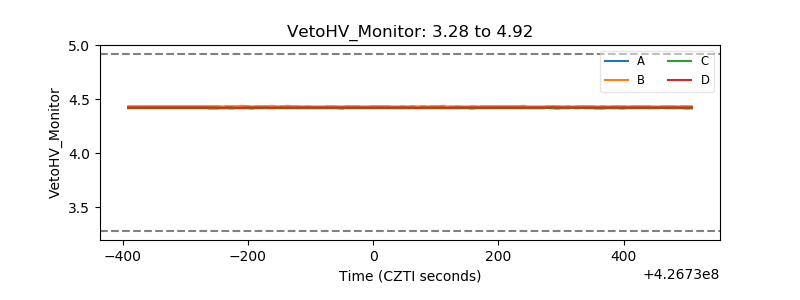 |
| Veto LLD | 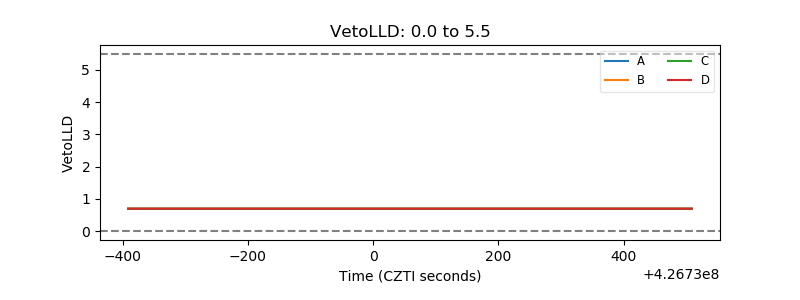 |
| Alpha Counter | 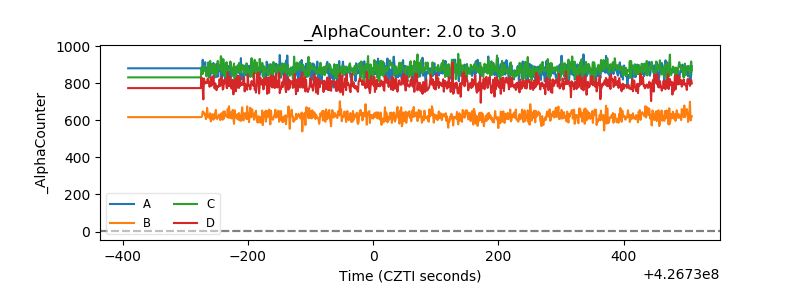 |
| _CPM_Rate | 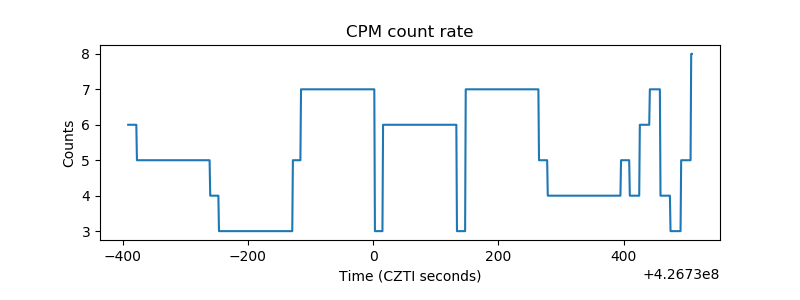 |
| CZT Counter | 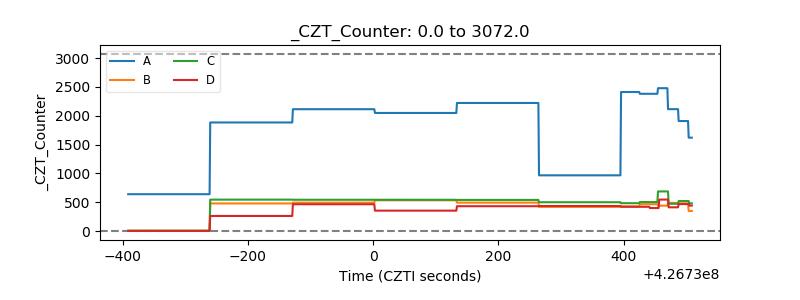 |
| +2.5 Volts monitor | 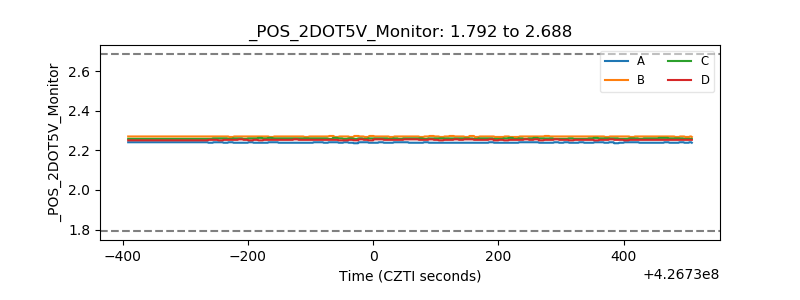 |
| +5 Volts monitor | 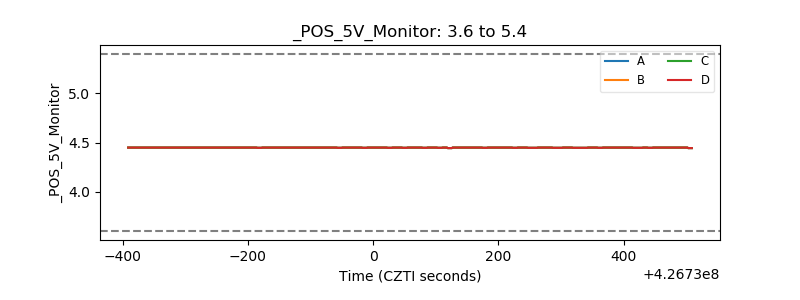 |
| _ROLL_ROT | 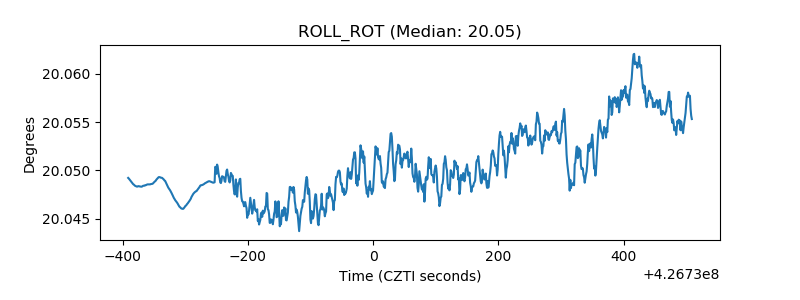 |
| _Roll_DEC | 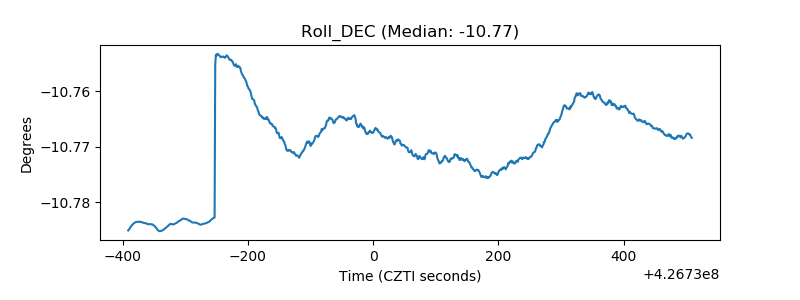 |
| _Roll_RA | 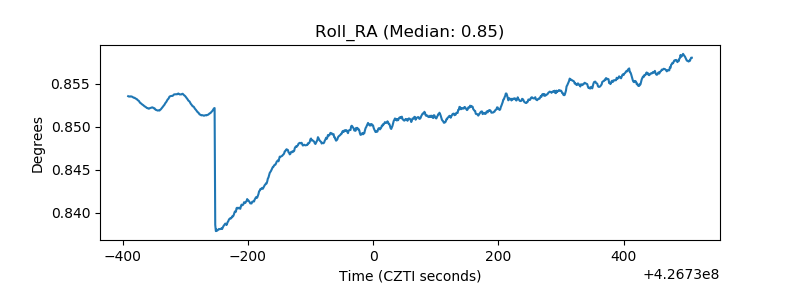 |
| Veto Counter | 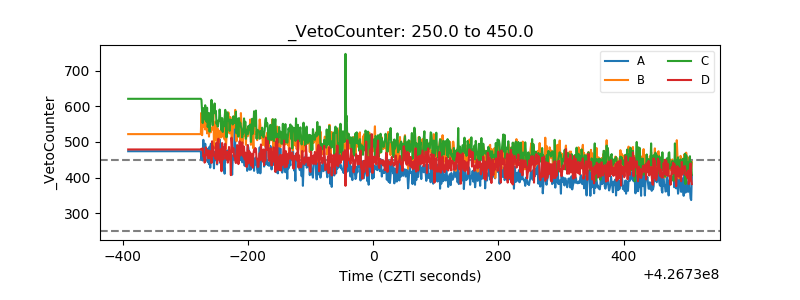 |