| Param | Original file | Final file |
|---|---|---|
| Filename | modeM0/AS1A12_044T22_9000005740_42084cztM0_level2.fits | modeM0/AS1A12_044T22_9000005740_42084cztM0_level2_quad_clean.evt |
| Size (bytes) | 336,320,640 | 81,650,880 |
| Size | 320.7 MB | 77.9 MB |
| Events in quadrant A | 5,114,598 | 503,693 |
| Events in quadrant B | 2,167,410 | 578,702 |
| Events in quadrant C | 2,360,861 | 554,051 |
| Events in quadrant D | 2,434,926 | 501,192 |
| Mode M0 | |||
|---|---|---|---|
| Quadrant | BADHDUFLAG | Total packets | Discarded packets |
| A | 0 | 18548 | 2 |
| B | 0 | 9698 | 2 |
| C | 0 | 9744 | 2 |
| D | 0 | 10654 | 2 |
| Mode SS | |||
|---|---|---|---|
| Quadrant | BADHDUFLAG | Total packets | Discarded packets |
| A | 0 | 98 | 0 |
| B | 0 | 98 | 0 |
| C | 0 | 98 | 0 |
| D | 0 | 98 | 0 |
| Mode M9 | |||
|---|---|---|---|
| Quadrant | BADHDUFLAG | Total packets | Discarded packets |
| A | 0 | 23 | 0 |
| B | 0 | 23 | 0 |
| C | 0 | 23 | 0 |
| D | 0 | 23 | 0 |
| Quadrant | Total seconds | Saturated seconds | Saturation percentage |
|---|---|---|---|
| A | 4770 | 530 | 11.111111% |
| B | 4770 | 10 | 0.209644% |
| C | 4770 | 3 | 0.062893% |
| D | 4770 | 75 | 1.572327% |
Noise dominated data is calculated using 1-second bins in cleaned event files. If a bin has >2000 counts, and if more than 50% of those come from <1% of pixels, then it is considered to be noise-dominated and hence unusable.
| Quadrant | # 1 sec bins | Bins with >0 counts | Bins with >2000 counts | High rate bins dominated by noise | Noise dominated (total time) | Noise dominated (detector-on time) | Marked lightcurve |
|---|---|---|---|---|---|---|---|
| A | 6923 | 4771 | 545 | 545 | 7.87% | 11.42% | 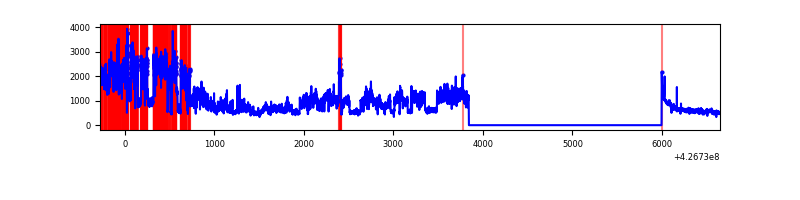 |
| B | 6923 | 4771 | 2 | 2 | 0.03% | 0.04% | 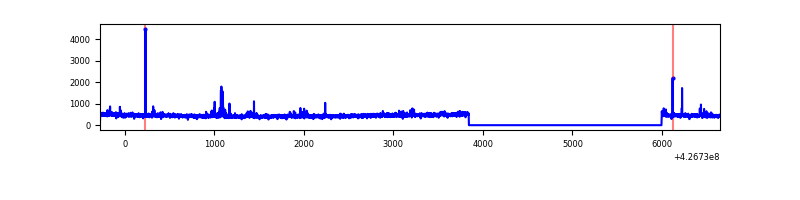 |
| C | 6923 | 4771 | 0 | 0 | 0.00% | 0.00% | 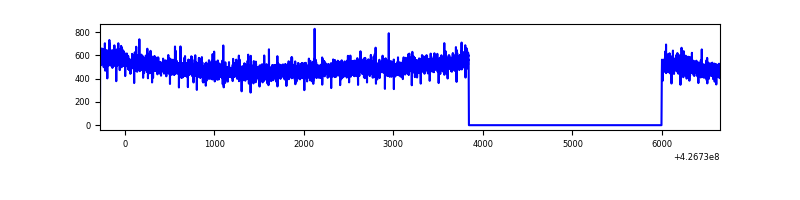 |
| D | 6923 | 4771 | 66 | 66 | 0.95% | 1.38% | 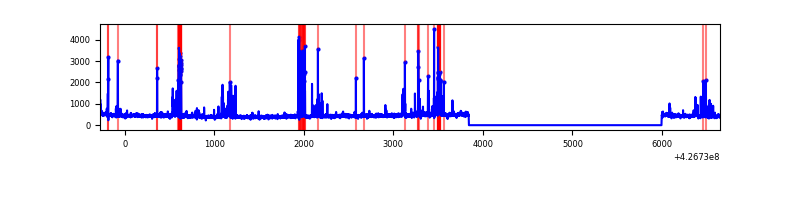 |
Top three noisy pixels from each quadrant. If the there are fewer than three noisy pixels in the level2.evt file, extra rows are filled as -1
| Pixel properties | Quadrant properties | ||||||
|---|---|---|---|---|---|---|---|
| Quadrant | DetID | PixID | Counts | Sigma | Mean | Median | Sigma |
| A | 15 | 222 | 2622530 | 24674.22 | 519 | 509 | 106.3 |
| A | 10 | 83 | 470449 | 4422.31 | 519 | 509 | 106.3 |
| A | 13 | 6 | 8421 | 74.45 | 519 | 509 | 106.3 |
| B | 5 | 255 | 65175 | 626.43 | 535 | 520 | 103.2 |
| B | 12 | 111 | 12663 | 117.65 | 535 | 520 | 103.2 |
| B | 11 | 111 | 11922 | 110.47 | 535 | 520 | 103.2 |
| C | 15 | 214 | 200083 | 1604.33 | 533 | 537 | 124.4 |
| C | 9 | 54 | 61499 | 490.13 | 533 | 537 | 124.4 |
| C | 8 | 79 | 20855 | 163.35 | 533 | 537 | 124.4 |
| D | 12 | 6 | 262523 | 2035.41 | 525 | 511 | 128.7 |
| D | 10 | 199 | 57731 | 444.51 | 525 | 511 | 128.7 |
| D | 13 | 249 | 54144 | 416.64 | 525 | 511 | 128.7 |
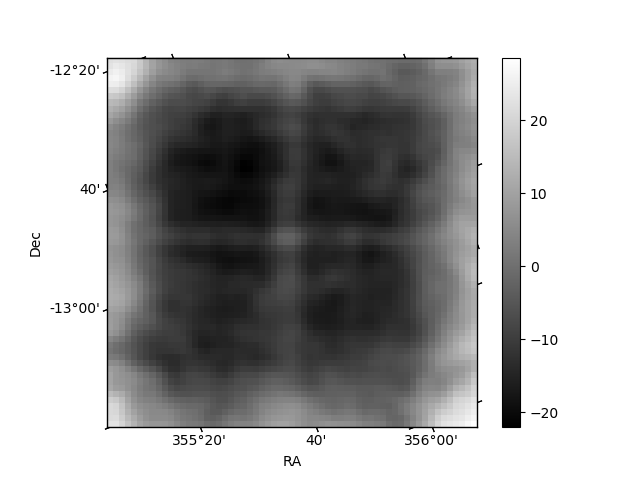
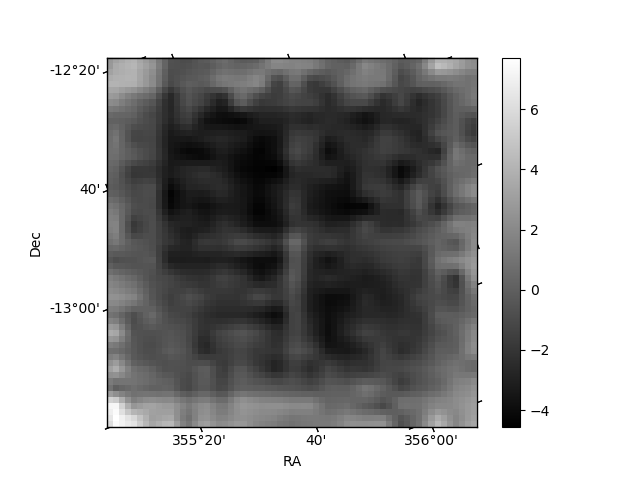
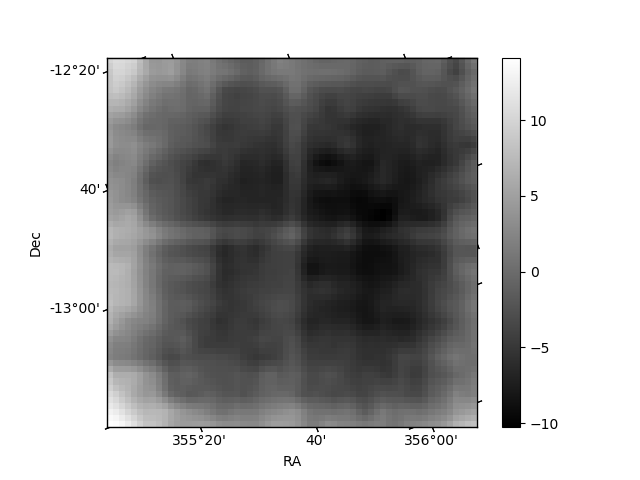
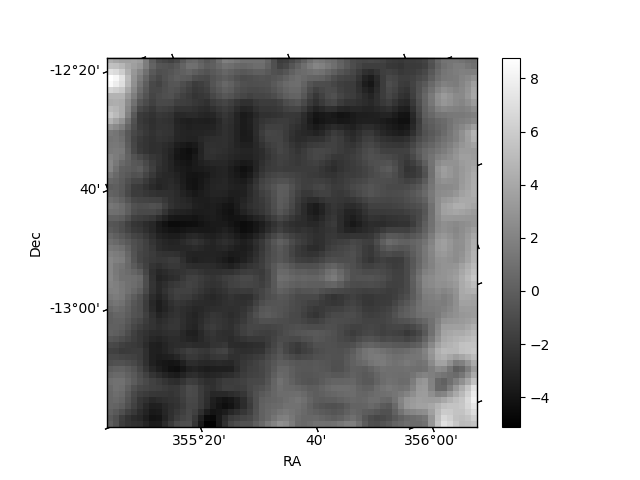
Histogram calculated using DETX and DETY for each event in the final _common_clean file
| Quadrant A | 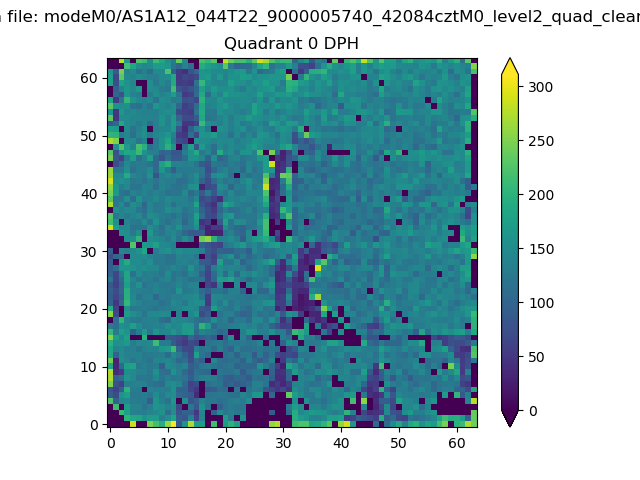 |
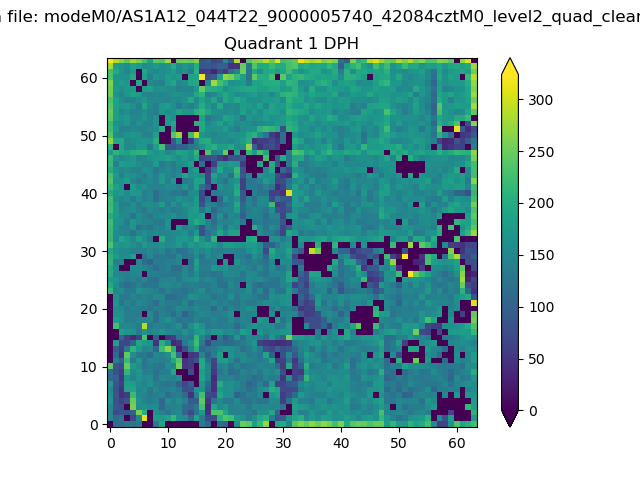 |
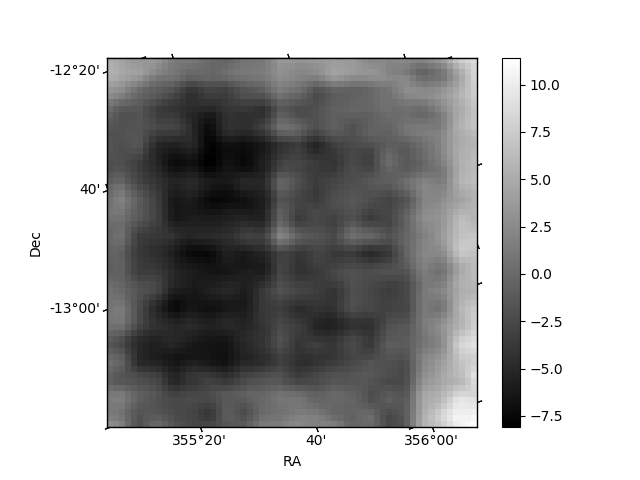
Quadrant B |
|---|---|---|---|
| Quadrant D | 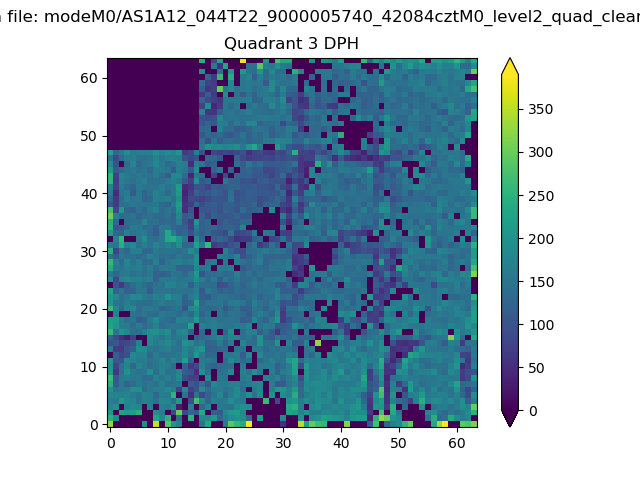 |
 |
Quadrant C |
| Plot type | Count rate plots | Images |
|---|---|---|
| Comparison with Poisson distribution Blue bars denote a histogram of data divided into 1 sec bins. Red curve is a Poisson curve with rate = median count rate of data. |
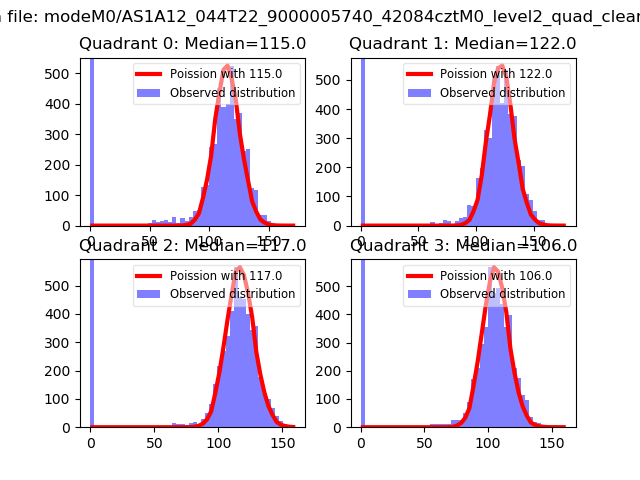 |
 |
| Quadrant-wise count rates Data is divided into 100 sec bins |
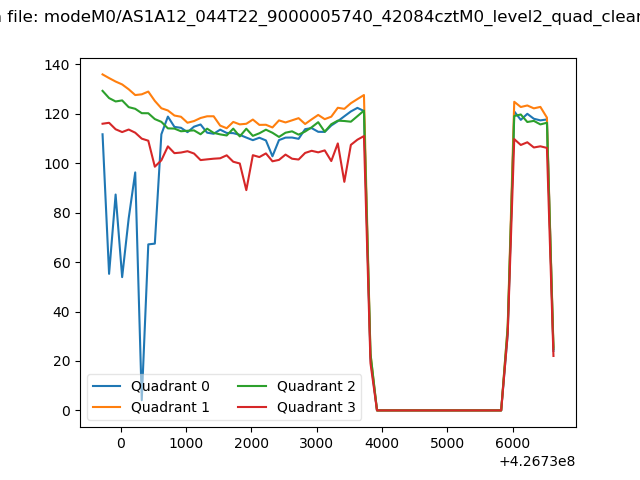 |
|
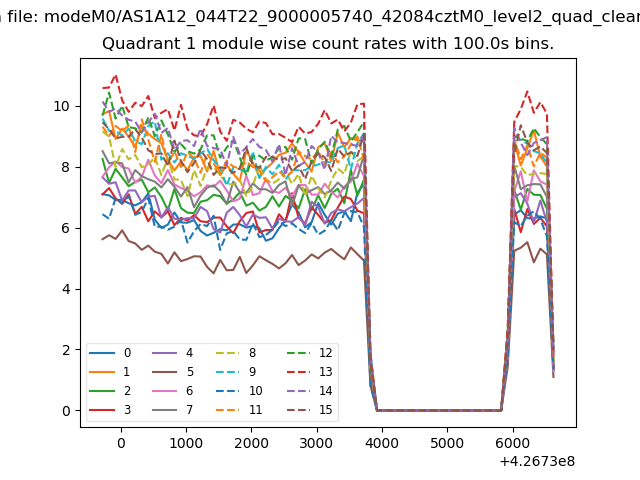
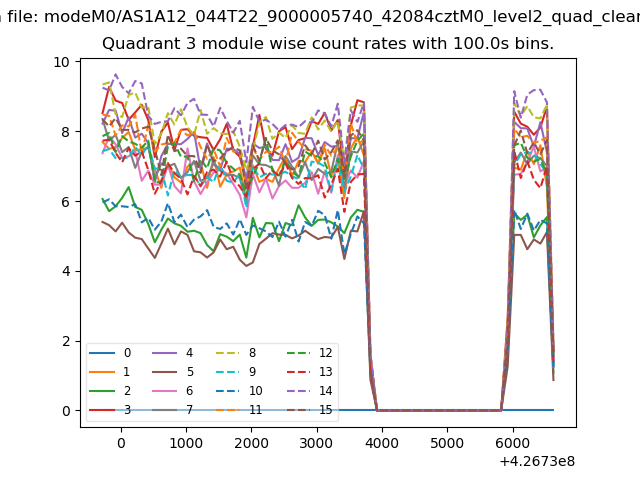
| Module-wise count rates for Quadrant A Data is divided into 100 sec bins |
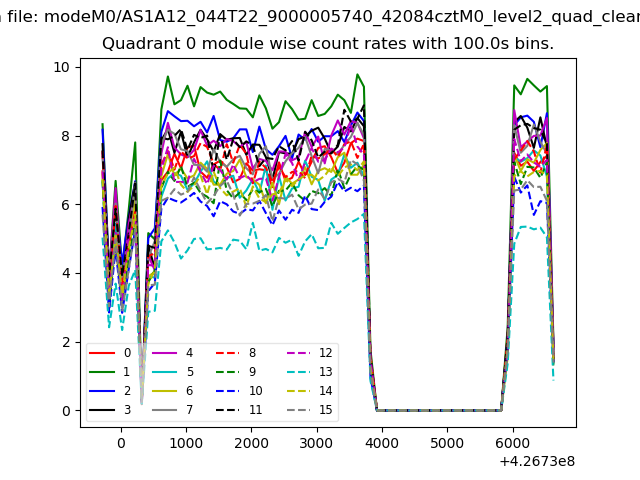 |
 |
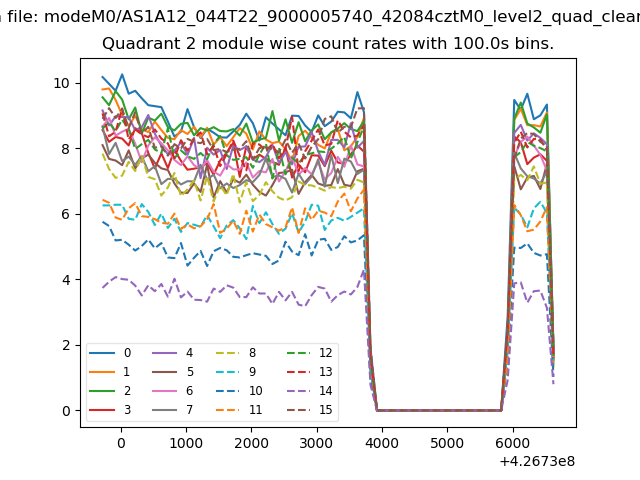
| Module-wise count rates for Quadrant B Data is divided into 100 sec bins |
 |
 |
| Module-wise count rates for Quadrant C Data is divided into 100 sec bins |
 |
 |
| Module-wise count rates for Quadrant D Data is divided into 100 sec bins |
 |
 |
| Parameter | Plot |
|---|---|
| CZT HV Monitor | 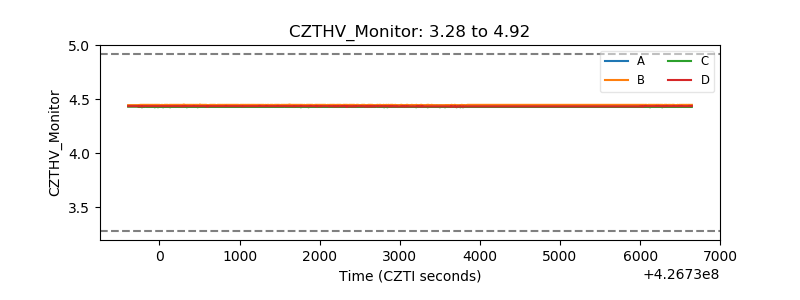 |
| D_VDD | 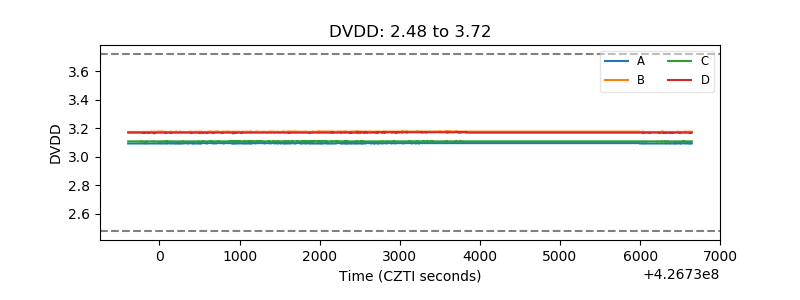 |
| Temperature 1 | 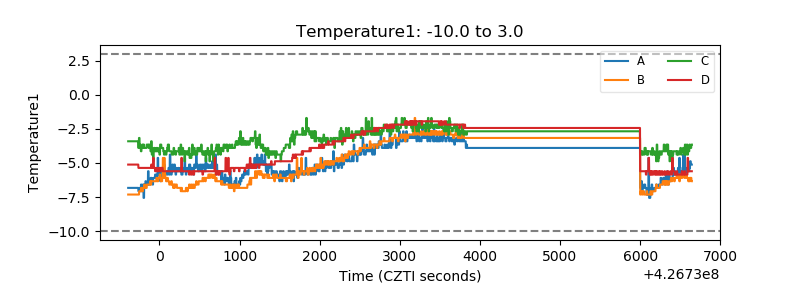 |
| Veto HV Monitor | 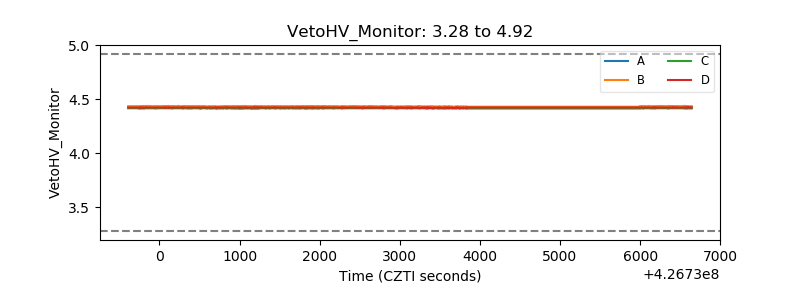 |
| Veto LLD | 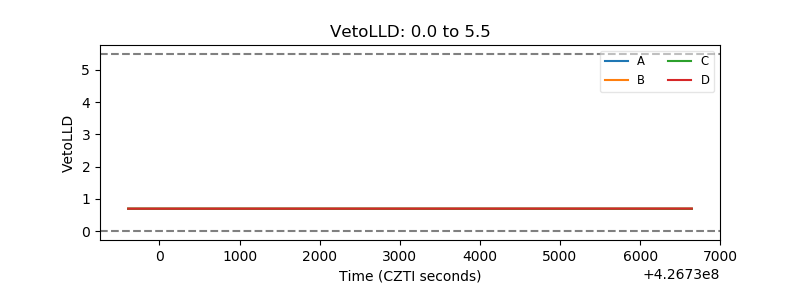 |
| Alpha Counter | 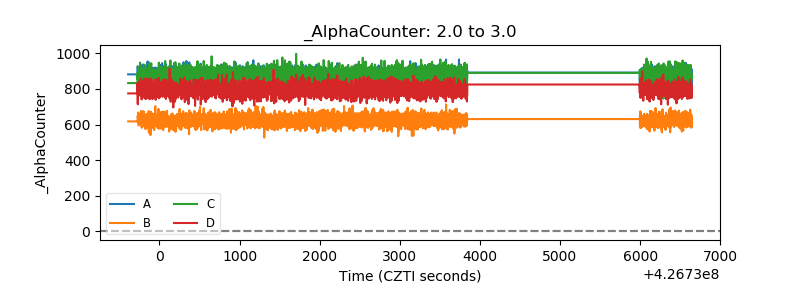 |
| _CPM_Rate | 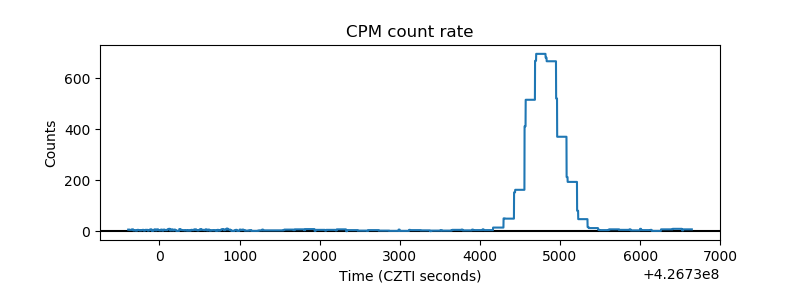 |
| CZT Counter | 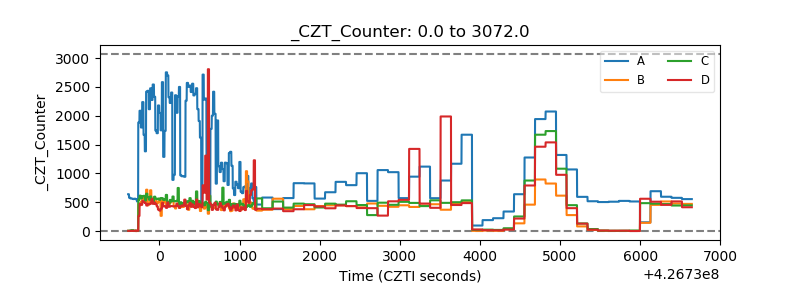 |
| +2.5 Volts monitor | 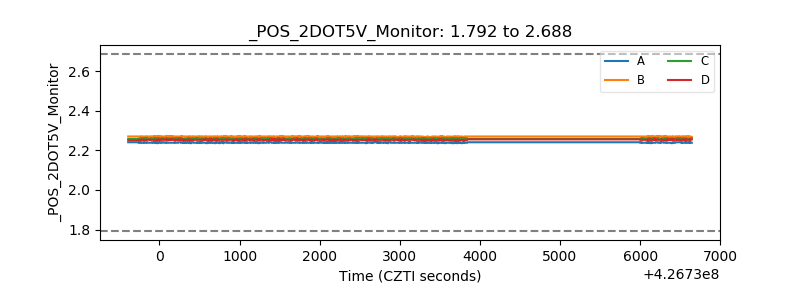 |
| +5 Volts monitor | 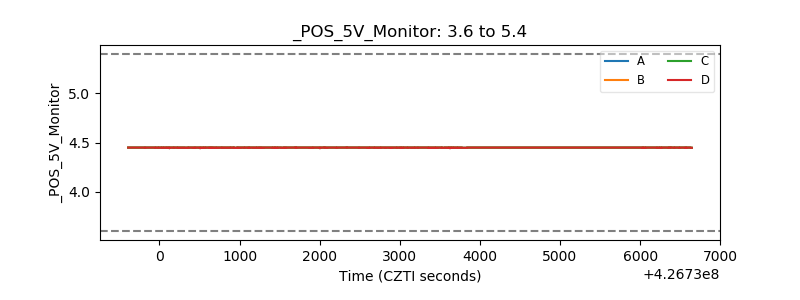 |
| _ROLL_ROT | 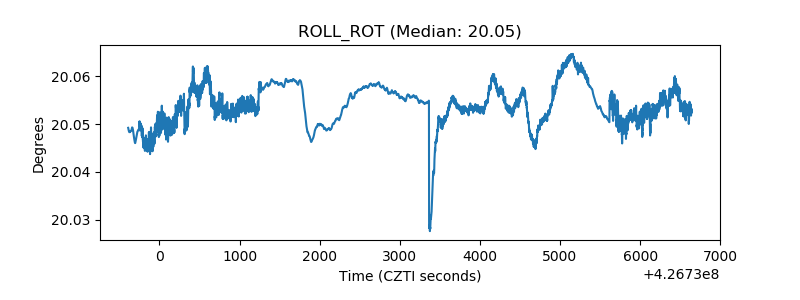 |
| _Roll_DEC | 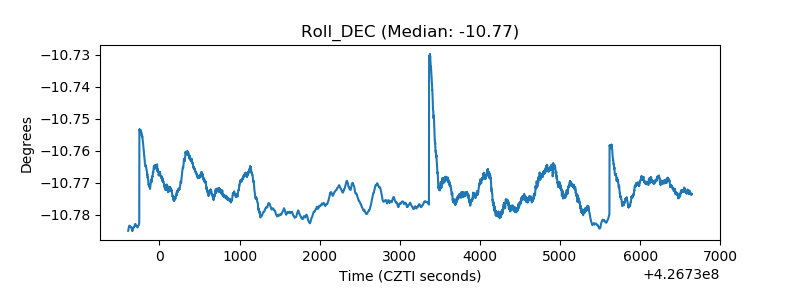 |
| _Roll_RA | 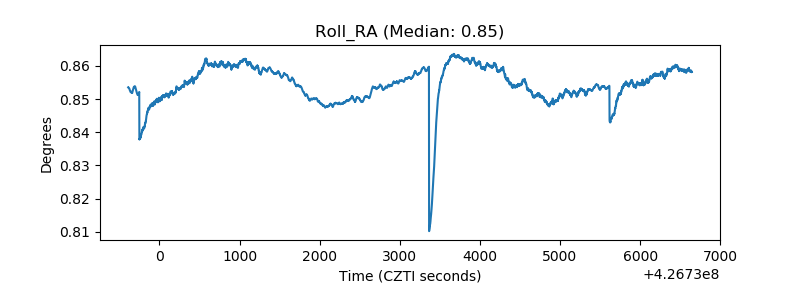 |
| Veto Counter | 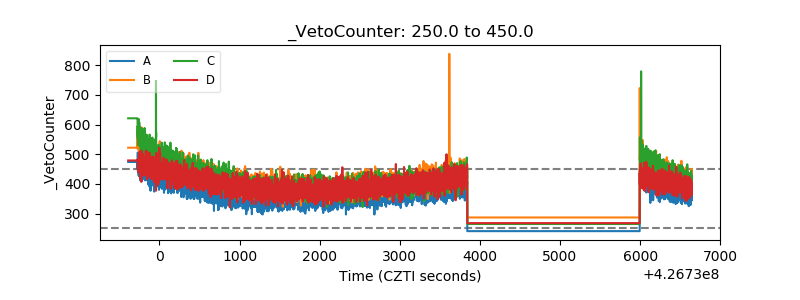 |