| Param | Original file | Final file |
|---|---|---|
| Filename | modeM0/AS1A12_044T22_9000005740_42085cztM0_level2.fits | modeM0/AS1A12_044T22_9000005740_42085cztM0_level2_quad_clean.evt |
| Size (bytes) | 310,129,920 | 84,274,560 |
| Size | 295.8 MB | 80.4 MB |
| Events in quadrant A | 3,567,200 | 557,687 |
| Events in quadrant B | 2,236,939 | 581,828 |
| Events in quadrant C | 2,348,988 | 556,151 |
| Events in quadrant D | 2,937,368 | 505,747 |
| Mode M0 | |||
|---|---|---|---|
| Quadrant | BADHDUFLAG | Total packets | Discarded packets |
| A | 0 | 14004 | 2 |
| B | 0 | 10205 | 3 |
| C | 0 | 10102 | 2 |
| D | 0 | 12297 | 8 |
| Mode SS | |||
|---|---|---|---|
| Quadrant | BADHDUFLAG | Total packets | Discarded packets |
| A | 0 | 102 | 0 |
| B | 0 | 102 | 0 |
| C | 0 | 102 | 0 |
| D | 0 | 102 | 0 |
| Mode M9 | |||
|---|---|---|---|
| Quadrant | BADHDUFLAG | Total packets | Discarded packets |
| A | 0 | 40 | 0 |
| B | 0 | 41 | 0 |
| C | 0 | 41 | 0 |
| D | 0 | 41 | 0 |
| Quadrant | Total seconds | Saturated seconds | Saturation percentage |
|---|---|---|---|
| A | 5000 | 80 | 1.600000% |
| B | 4998 | 18 | 0.360144% |
| C | 4999 | 2 | 0.040008% |
| D | 4995 | 101 | 2.022022% |
Noise dominated data is calculated using 1-second bins in cleaned event files. If a bin has >2000 counts, and if more than 50% of those come from <1% of pixels, then it is considered to be noise-dominated and hence unusable.
| Quadrant | # 1 sec bins | Bins with >0 counts | Bins with >2000 counts | High rate bins dominated by noise | Noise dominated (total time) | Noise dominated (detector-on time) | Marked lightcurve |
|---|---|---|---|---|---|---|---|
| A | 7062 | 5001 | 49 | 49 | 0.69% | 0.98% | 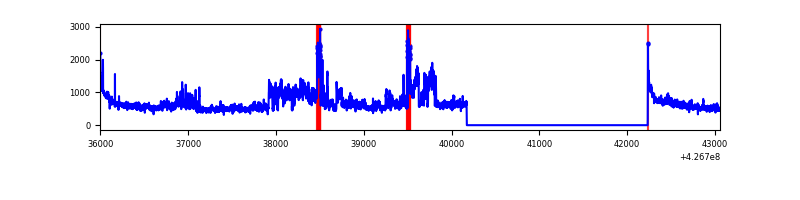 |
| B | 7061 | 5000 | 6 | 6 | 0.08% | 0.12% | 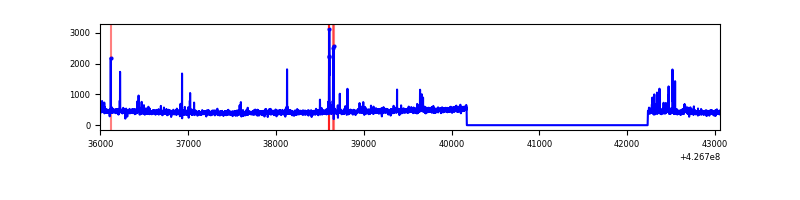 |
| C | 7061 | 5000 | 0 | 0 | 0.00% | 0.00% | 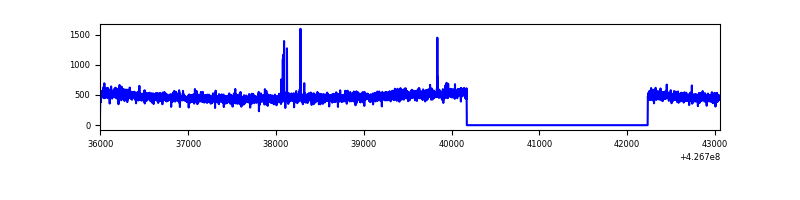 |
| D | 7061 | 4998 | 97 | 97 | 1.37% | 1.94% | 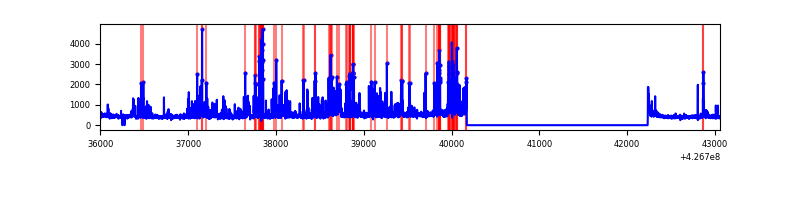 |
Top three noisy pixels from each quadrant. If the there are fewer than three noisy pixels in the level2.evt file, extra rows are filled as -1
| Pixel properties | Quadrant properties | ||||||
|---|---|---|---|---|---|---|---|
| Quadrant | DetID | PixID | Counts | Sigma | Mean | Median | Sigma |
| A | 15 | 222 | 908214 | 8073.9 | 548 | 537 | 112.4 |
| A | 10 | 83 | 511626 | 4546.2 | 548 | 537 | 112.4 |
| A | 2 | 79 | 13801 | 117.98 | 548 | 537 | 112.4 |
| B | 5 | 255 | 68007 | 635.46 | 548 | 533 | 106.2 |
| B | 3 | 112 | 15570 | 141.62 | 548 | 533 | 106.2 |
| B | 12 | 111 | 13358 | 120.78 | 548 | 533 | 106.2 |
| C | 15 | 214 | 209089 | 1653.6 | 543 | 548 | 126.1 |
| C | 15 | 159 | 16690 | 128.0 | 543 | 548 | 126.1 |
| C | 8 | 79 | 3795 | 25.75 | 543 | 548 | 126.1 |
| D | 1 | 52 | 421078 | 3203.14 | 538 | 524 | 131.3 |
| D | 12 | 6 | 164488 | 1248.83 | 538 | 524 | 131.3 |
| D | 5 | 223 | 83413 | 631.32 | 538 | 524 | 131.3 |
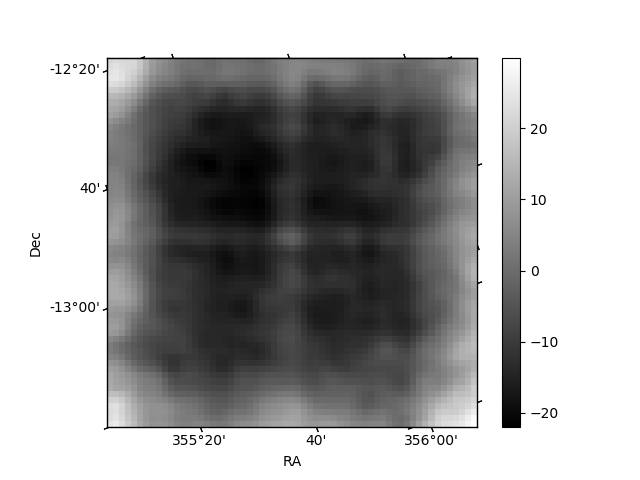
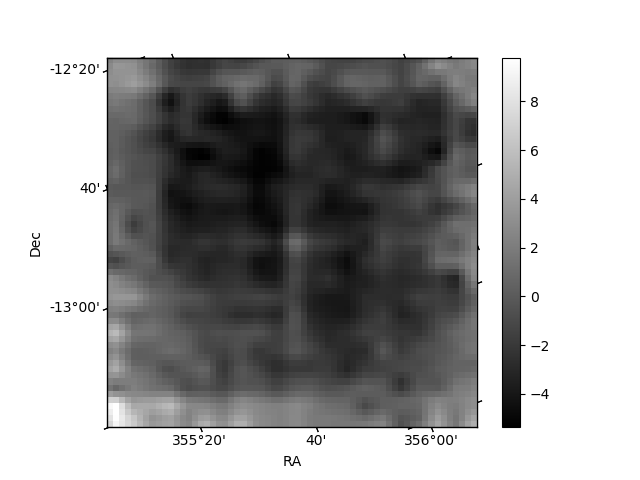
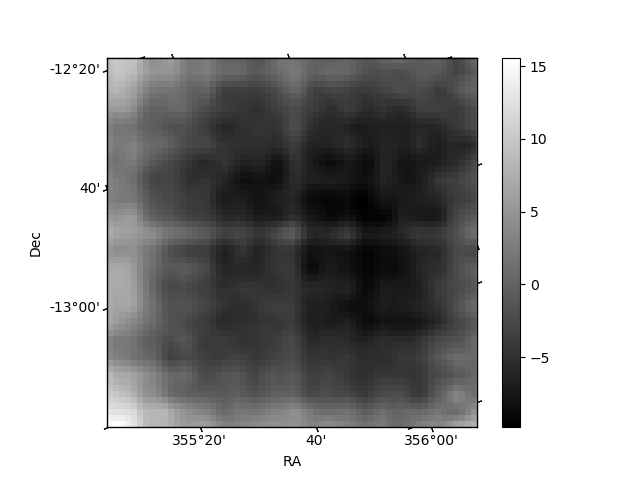
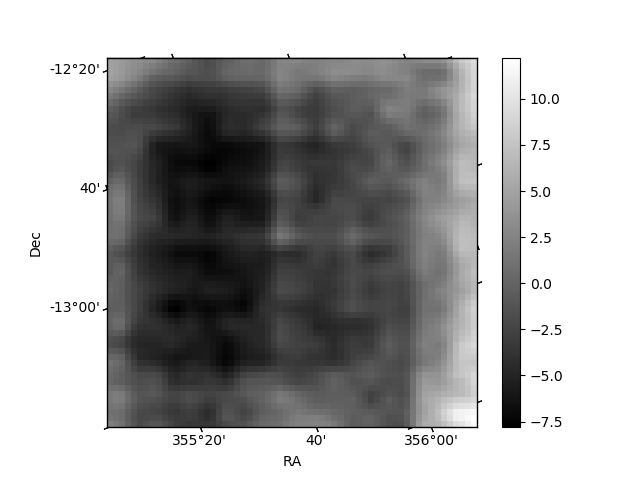
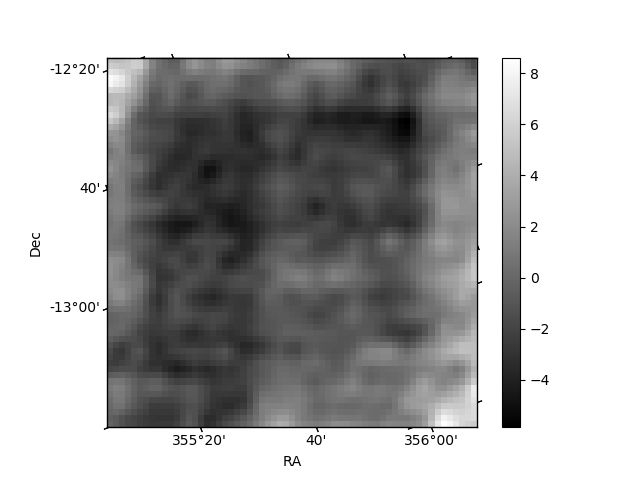
Histogram calculated using DETX and DETY for each event in the final _common_clean file
| Quadrant A | 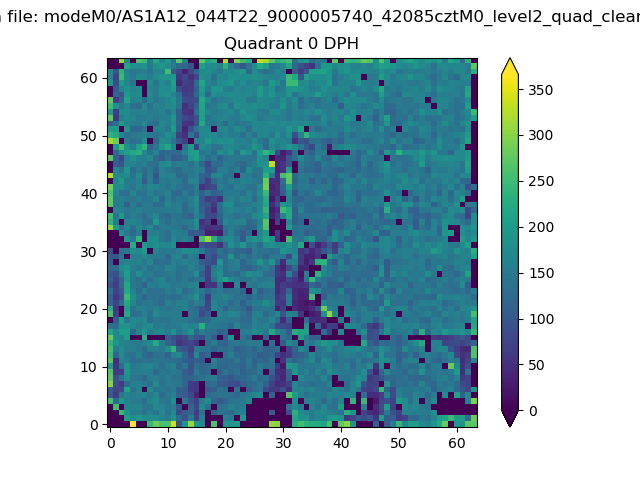 |
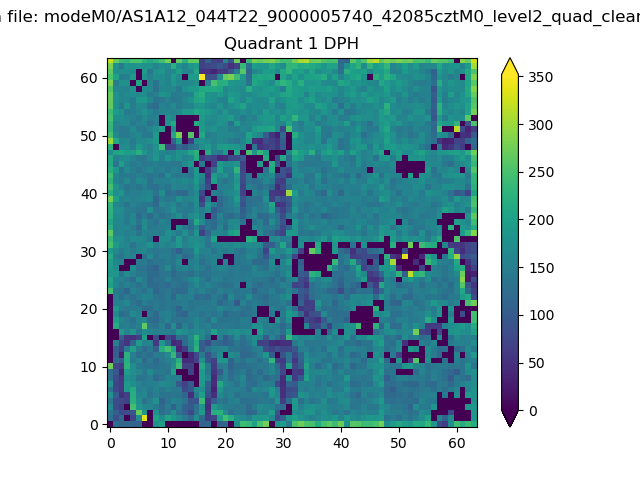 |
Quadrant B |
|---|---|---|---|
| Quadrant D | 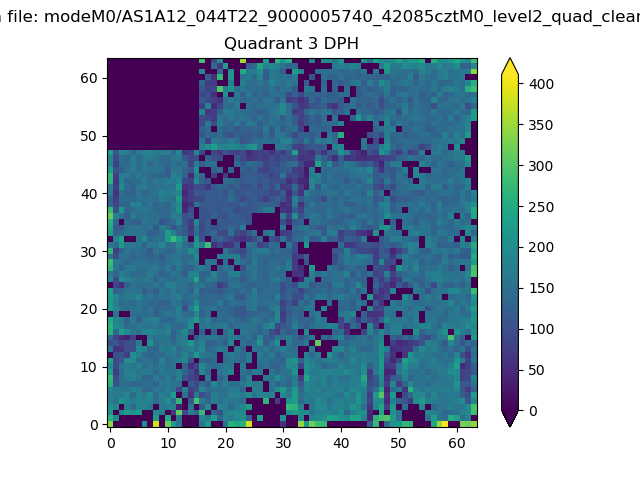 |
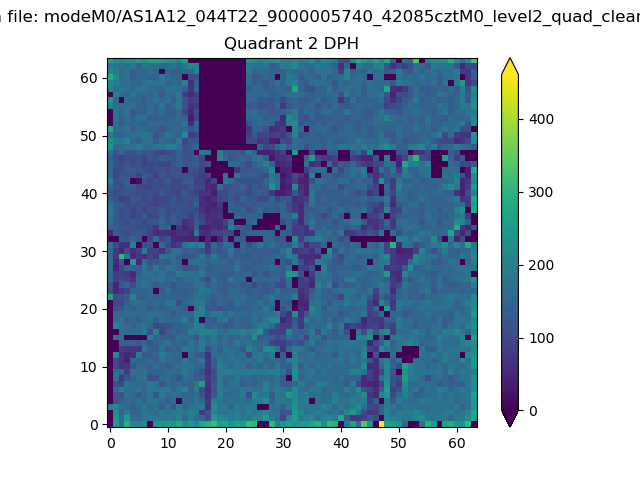 |
Quadrant C |
| Plot type | Count rate plots | Images |
|---|---|---|
| Comparison with Poisson distribution Blue bars denote a histogram of data divided into 1 sec bins. Red curve is a Poisson curve with rate = median count rate of data. |
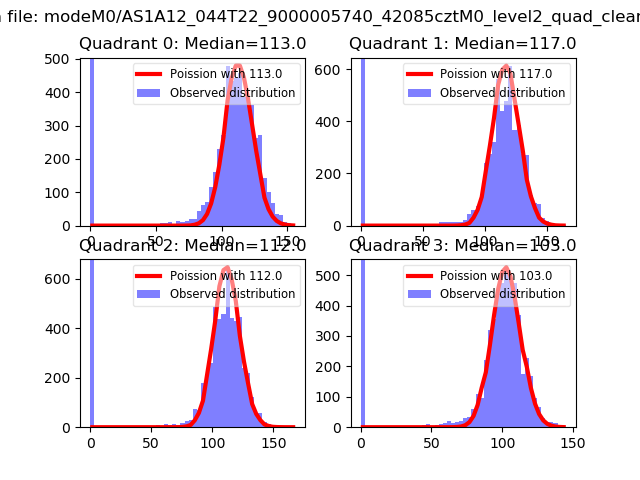 |
 |
| Quadrant-wise count rates Data is divided into 100 sec bins |
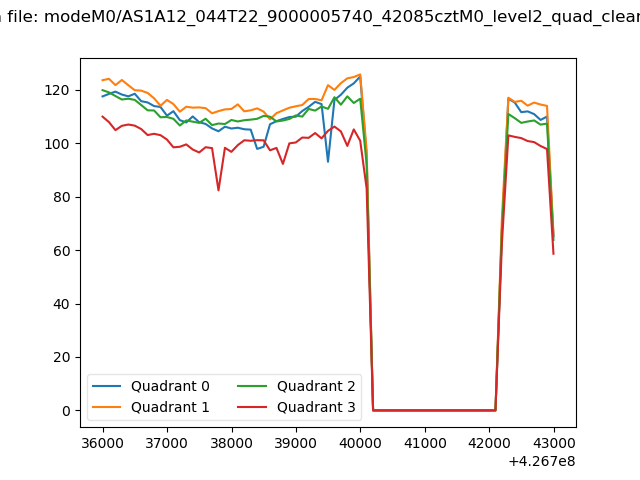 |
|
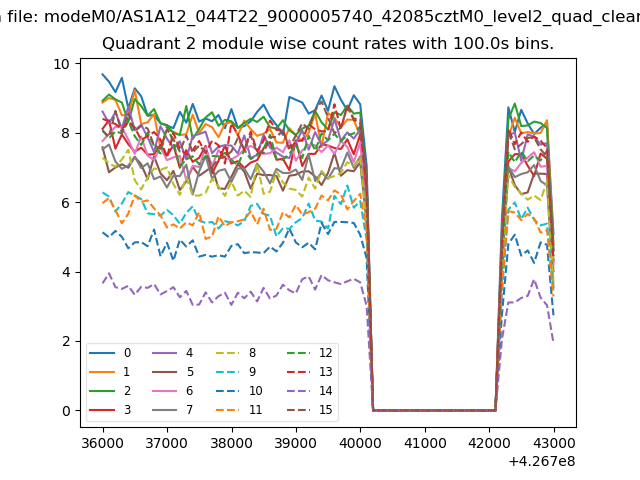
| Module-wise count rates for Quadrant A Data is divided into 100 sec bins |
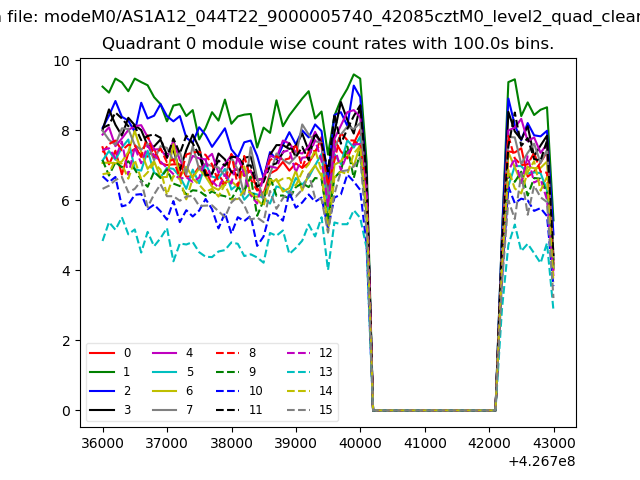 |
 |
| Module-wise count rates for Quadrant B Data is divided into 100 sec bins |
 |
 |
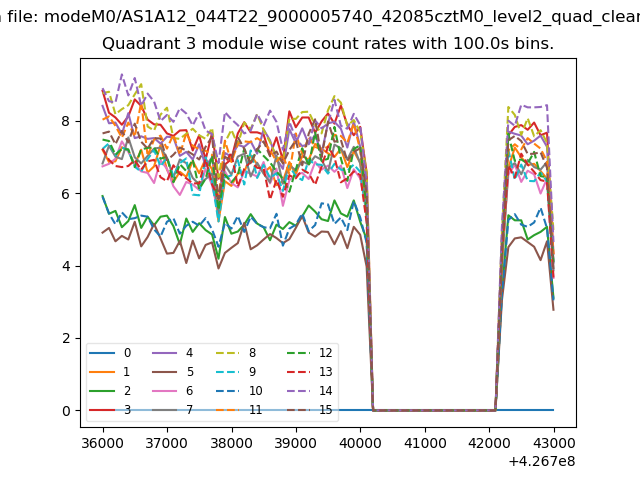
| Module-wise count rates for Quadrant C Data is divided into 100 sec bins |
 |
 |
| Module-wise count rates for Quadrant D Data is divided into 100 sec bins |
 |
 |
| Parameter | Plot |
|---|---|
| CZT HV Monitor | 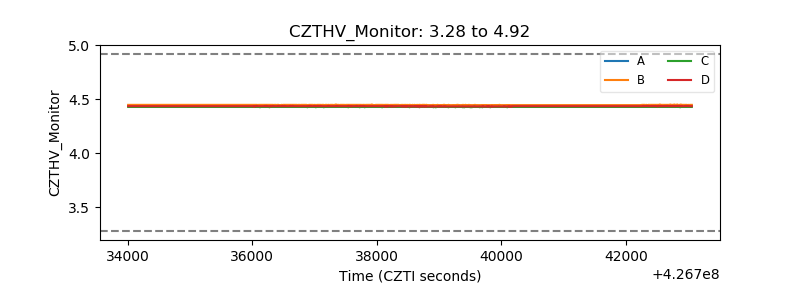 |
| D_VDD | 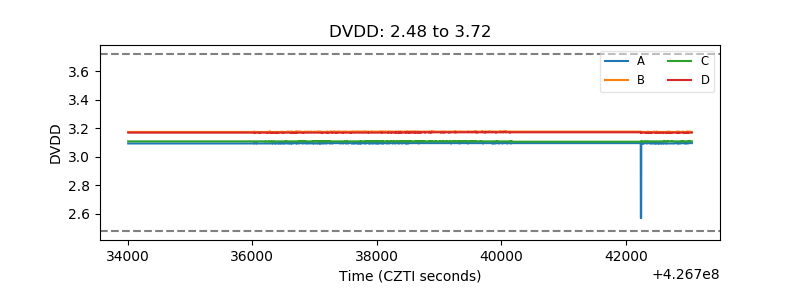 |
| Temperature 1 | 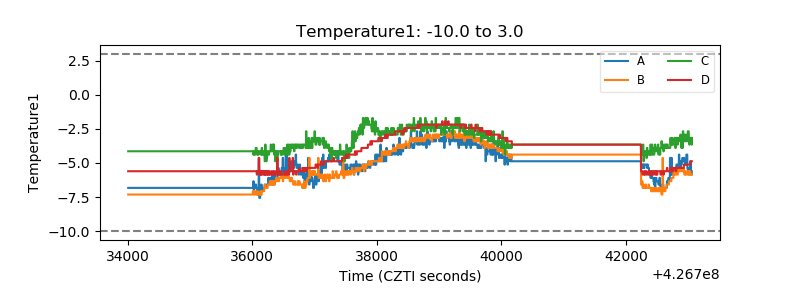 |
| Veto HV Monitor |  |
| Veto LLD | 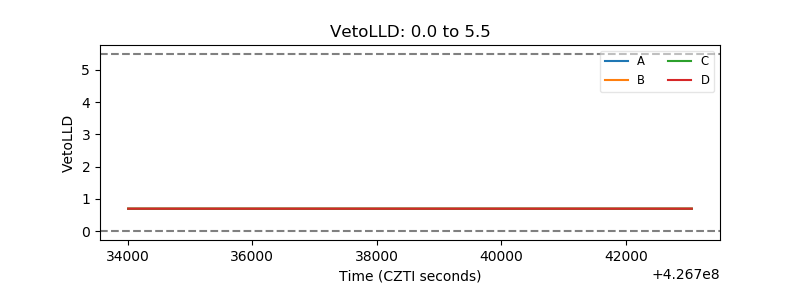 |
| Alpha Counter | 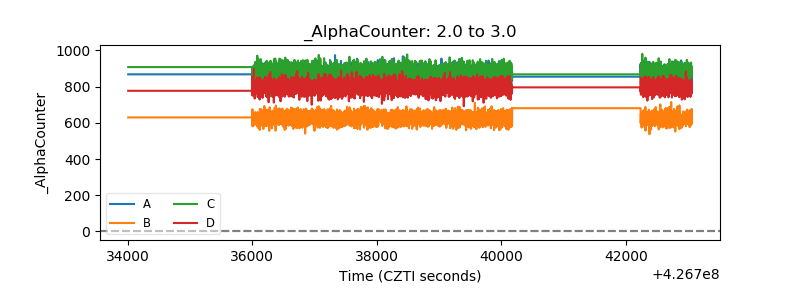 |
| _CPM_Rate | 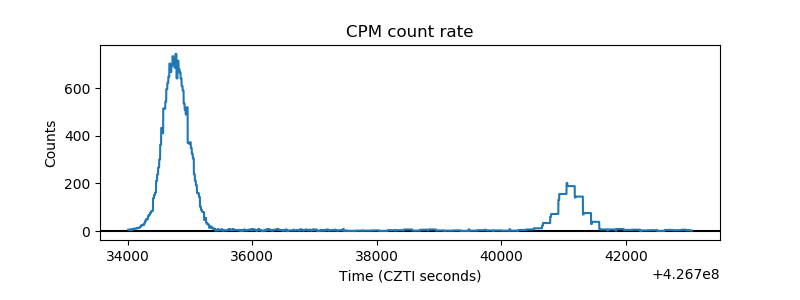 |
| CZT Counter |  |
| +2.5 Volts monitor | 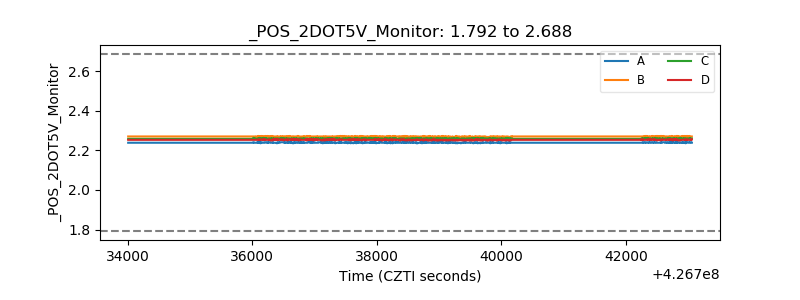 |
| +5 Volts monitor | 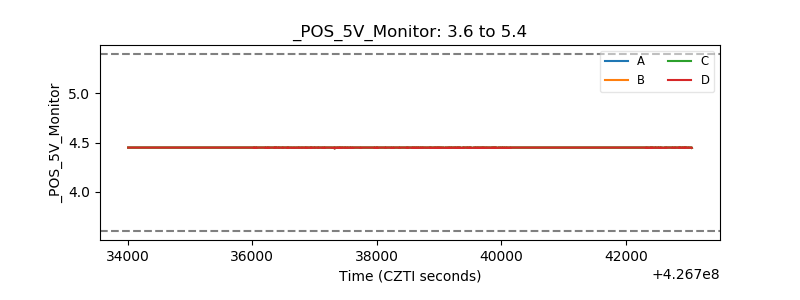 |
| _ROLL_ROT | 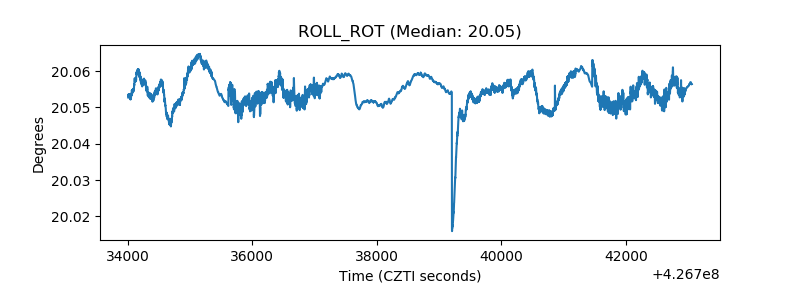 |
| _Roll_DEC | 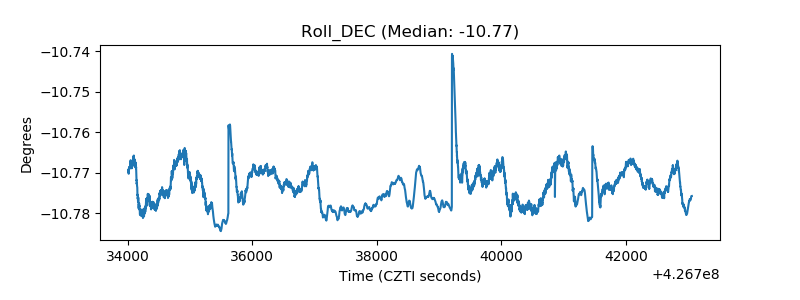 |
| _Roll_RA | 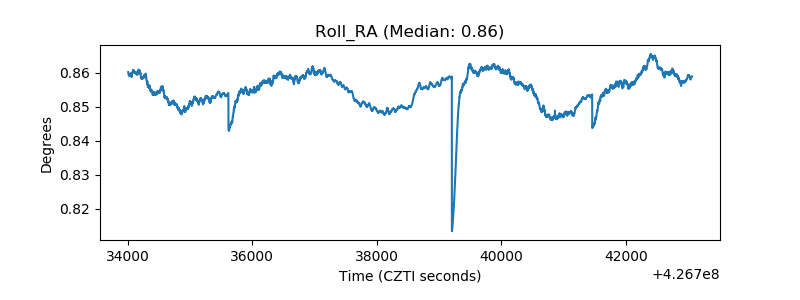 |
| Veto Counter | 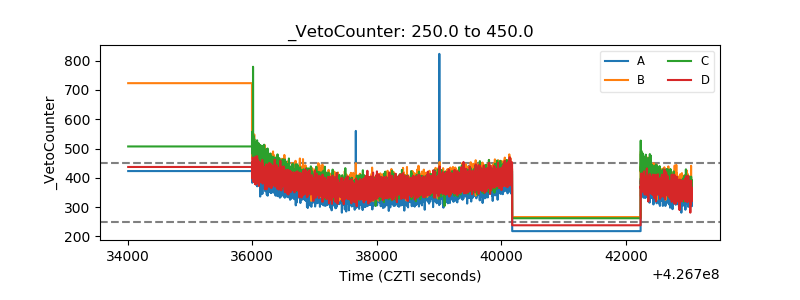 |