| Param | Original file | Final file |
|---|---|---|
| Filename | modeM0/AS1A12_044T22_9000005740_42087cztM0_level2.fits | modeM0/AS1A12_044T22_9000005740_42087cztM0_level2_quad_clean.evt |
| Size (bytes) | 359,795,520 | 93,096,000 |
| Size | 343.1 MB | 88.8 MB |
| Events in quadrant A | 3,755,405 | 621,241 |
| Events in quadrant B | 2,504,548 | 644,896 |
| Events in quadrant C | 2,689,662 | 614,943 |
| Events in quadrant D | 3,916,832 | 531,666 |
| Mode M0 | |||
|---|---|---|---|
| Quadrant | BADHDUFLAG | Total packets | Discarded packets |
| A | 0 | 14967 | 2 |
| B | 0 | 11646 | 2 |
| C | 0 | 11684 | 2 |
| D | 0 | 15839 | 2 |
| Mode SS | |||
|---|---|---|---|
| Quadrant | BADHDUFLAG | Total packets | Discarded packets |
| A | 0 | 120 | 0 |
| B | 0 | 120 | 0 |
| C | 0 | 120 | 0 |
| D | 0 | 120 | 0 |
| Mode M9 | |||
|---|---|---|---|
| Quadrant | BADHDUFLAG | Total packets | Discarded packets |
| A | 0 | 21 | 0 |
| B | 0 | 22 | 0 |
| C | 0 | 22 | 0 |
| D | 0 | 22 | 0 |
| Quadrant | Total seconds | Saturated seconds | Saturation percentage |
|---|---|---|---|
| A | 5804 | 24 | 0.413508% |
| B | 5804 | 7 | 0.120606% |
| C | 5804 | 3 | 0.051688% |
| D | 5804 | 414 | 7.133012% |
Noise dominated data is calculated using 1-second bins in cleaned event files. If a bin has >2000 counts, and if more than 50% of those come from <1% of pixels, then it is considered to be noise-dominated and hence unusable.
| Quadrant | # 1 sec bins | Bins with >0 counts | Bins with >2000 counts | High rate bins dominated by noise | Noise dominated (total time) | Noise dominated (detector-on time) | Marked lightcurve |
|---|---|---|---|---|---|---|---|
| A | 7327 | 5805 | 13 | 13 | 0.18% | 0.22% | 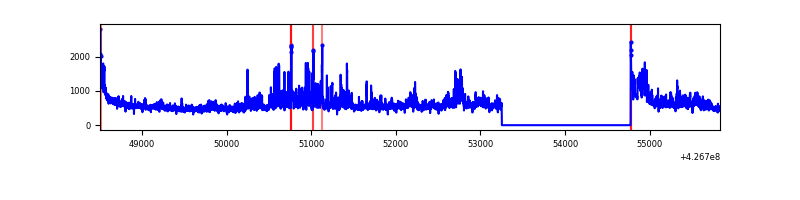 |
| B | 7327 | 5805 | 1 | 1 | 0.01% | 0.02% | 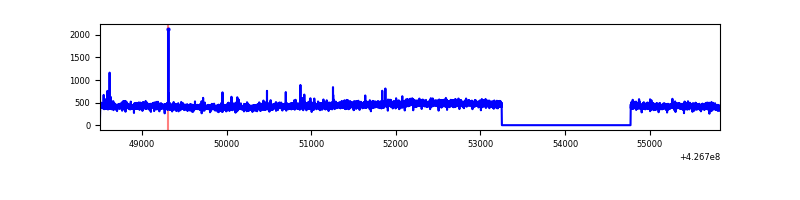 |
| C | 7327 | 5805 | 0 | 0 | 0.00% | 0.00% | 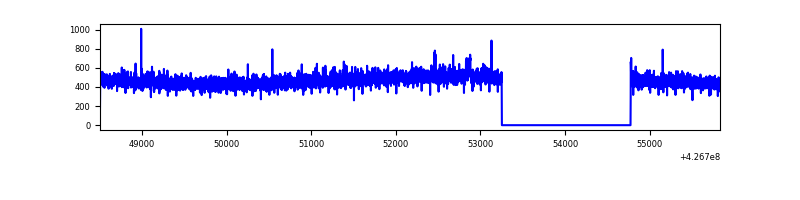 |
| D | 7327 | 5805 | 353 | 353 | 4.82% | 6.08% | 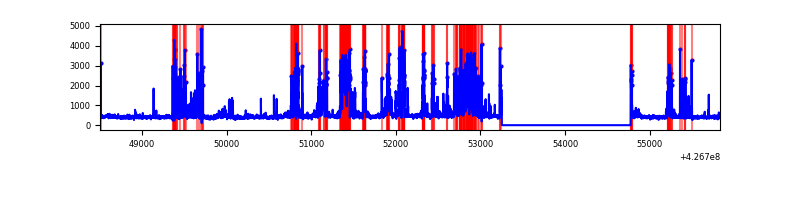 |
Top three noisy pixels from each quadrant. If the there are fewer than three noisy pixels in the level2.evt file, extra rows are filled as -1
| Pixel properties | Quadrant properties | ||||||
|---|---|---|---|---|---|---|---|
| Quadrant | DetID | PixID | Counts | Sigma | Mean | Median | Sigma |
| A | 15 | 222 | 717506 | 5449.36 | 637 | 623 | 131.6 |
| A | 10 | 83 | 556205 | 4223.24 | 637 | 623 | 131.6 |
| A | 13 | 6 | 13899 | 100.92 | 637 | 623 | 131.6 |
| B | 12 | 111 | 16069 | 124.39 | 634 | 617 | 124.2 |
| B | 11 | 111 | 14933 | 115.25 | 634 | 617 | 124.2 |
| B | 14 | 111 | 14523 | 111.95 | 634 | 617 | 124.2 |
| C | 15 | 214 | 242023 | 1641.25 | 624 | 629 | 147.1 |
| C | 1 | 16 | 6142 | 37.48 | 624 | 629 | 147.1 |
| C | 8 | 79 | 6003 | 36.54 | 624 | 629 | 147.1 |
| D | 13 | 249 | 958953 | 6481.6 | 603 | 586 | 147.9 |
| D | 12 | 6 | 424371 | 2866.13 | 603 | 586 | 147.9 |
| D | 5 | 223 | 65986 | 442.31 | 603 | 586 | 147.9 |
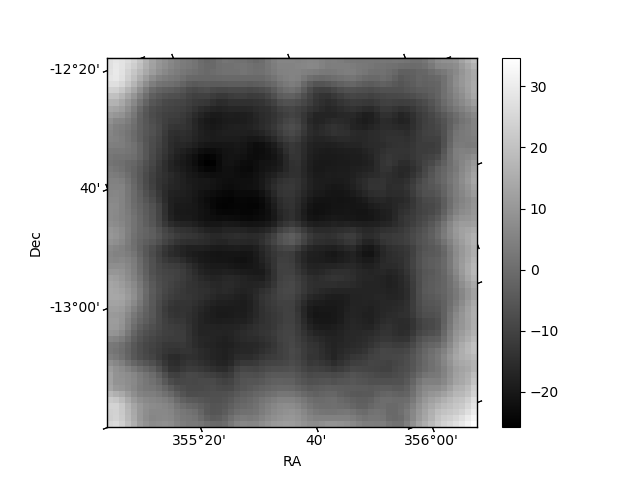
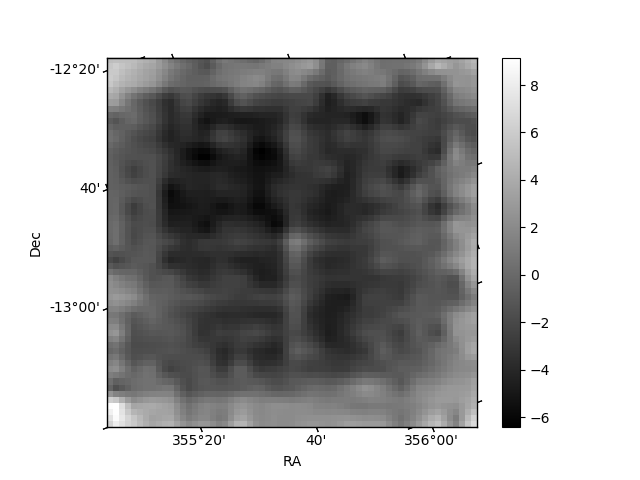
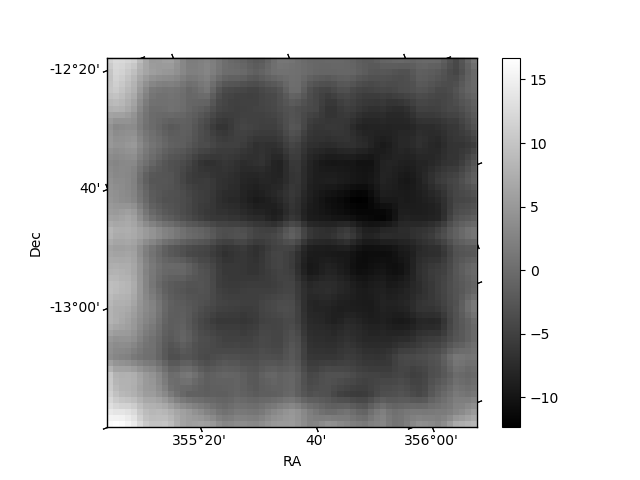
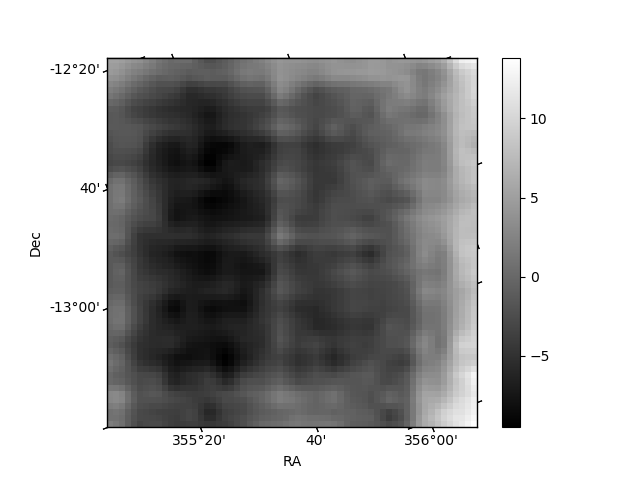
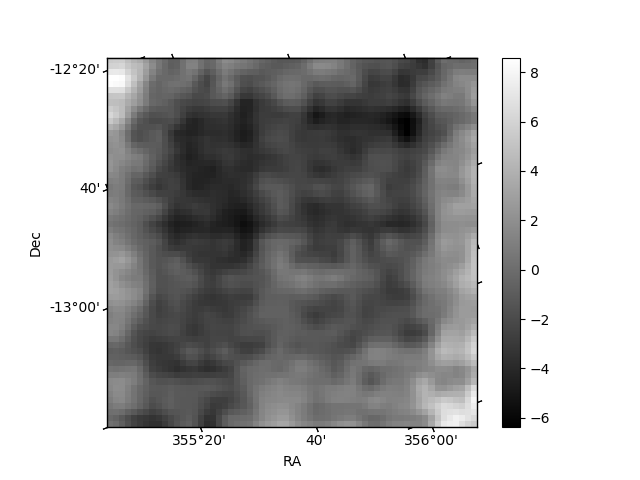
Histogram calculated using DETX and DETY for each event in the final _common_clean file
| Quadrant A | 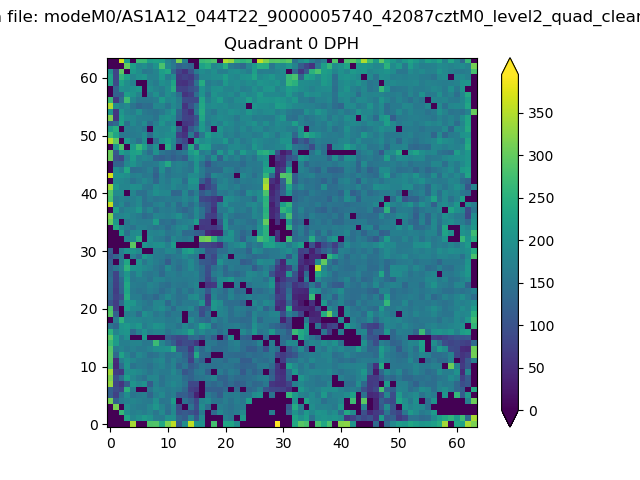 |
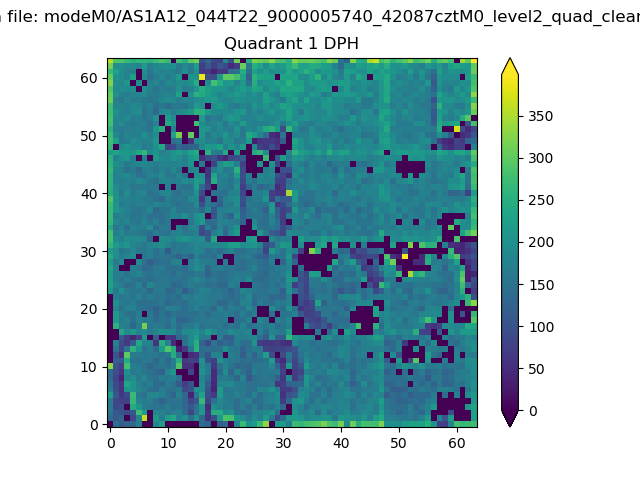 |
Quadrant B |
|---|---|---|---|
| Quadrant D |  |
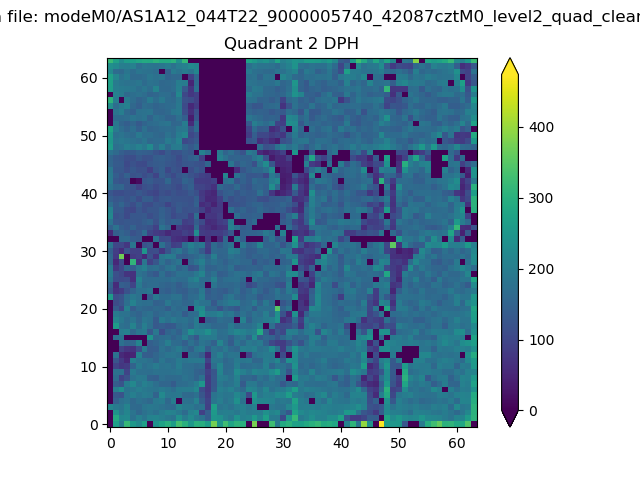 |
Quadrant C |
| Plot type | Count rate plots | Images |
|---|---|---|
| Comparison with Poisson distribution Blue bars denote a histogram of data divided into 1 sec bins. Red curve is a Poisson curve with rate = median count rate of data. |
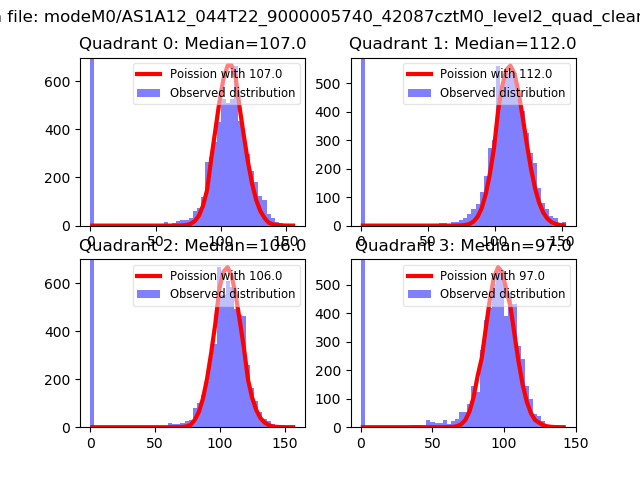 |
 |
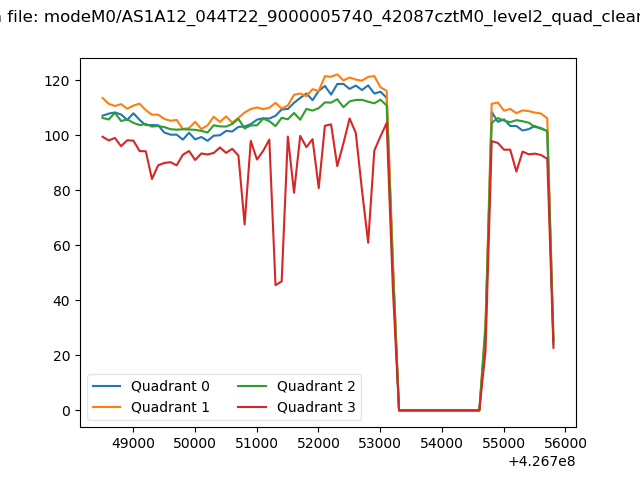
| Quadrant-wise count rates Data is divided into 100 sec bins |
 |
|
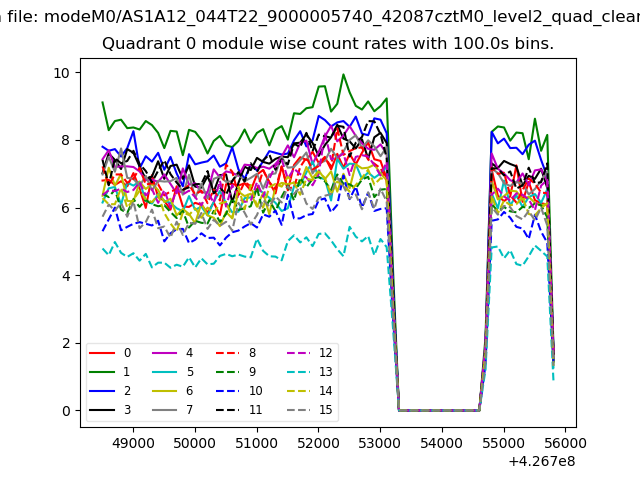
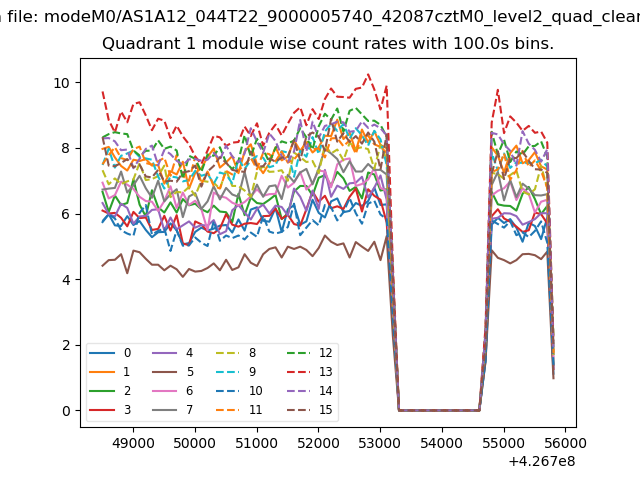
| Module-wise count rates for Quadrant A Data is divided into 100 sec bins |
 |
 |
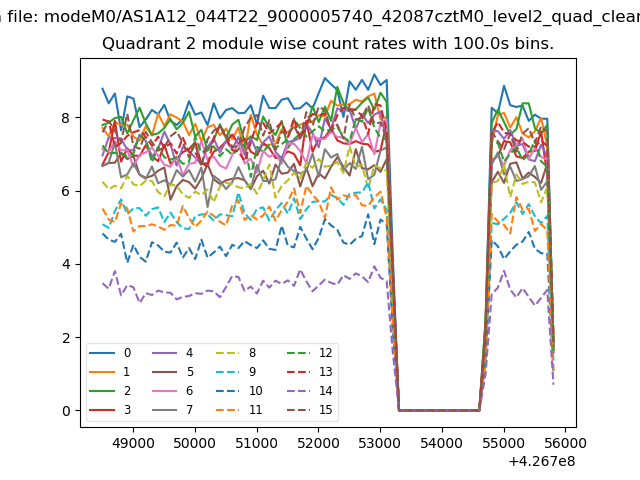
| Module-wise count rates for Quadrant B Data is divided into 100 sec bins |
 |
 |
| Module-wise count rates for Quadrant C Data is divided into 100 sec bins |
 |
 |
| Module-wise count rates for Quadrant D Data is divided into 100 sec bins |
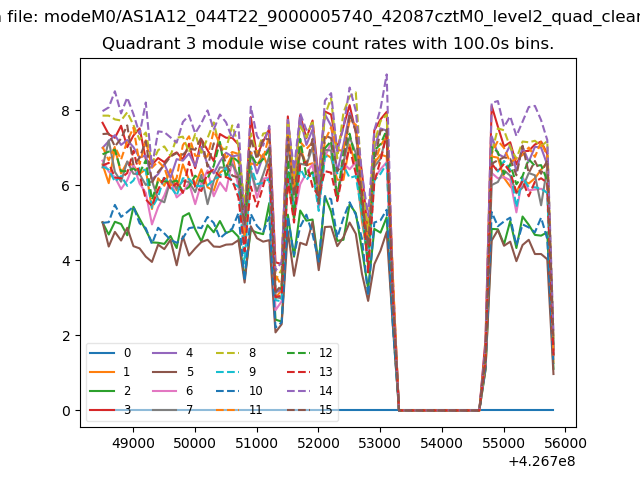 |
 |
| Parameter | Plot |
|---|---|
| CZT HV Monitor | 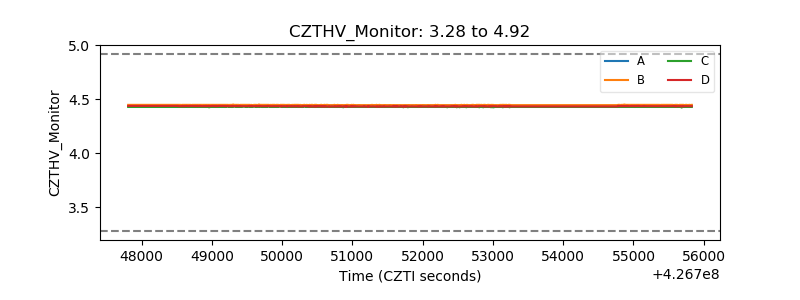 |
| D_VDD | 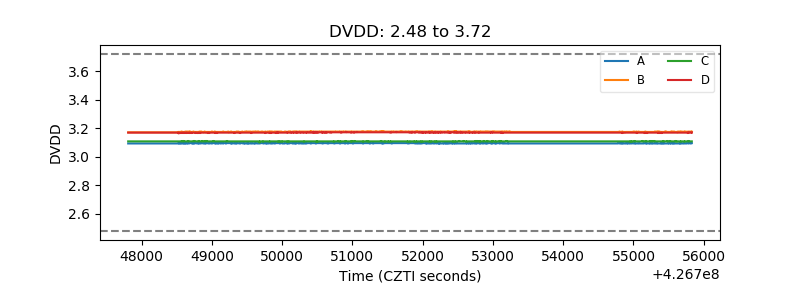 |
| Temperature 1 | 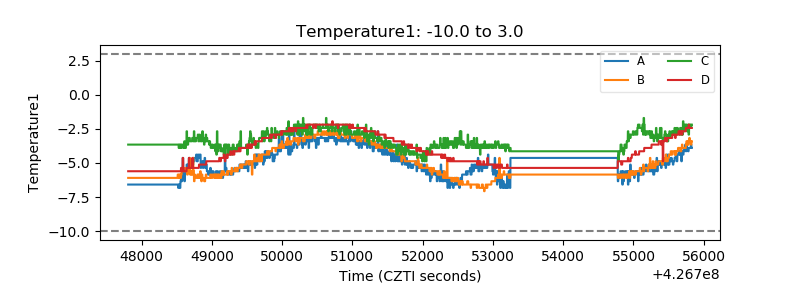 |
| Veto HV Monitor |  |
| Veto LLD | 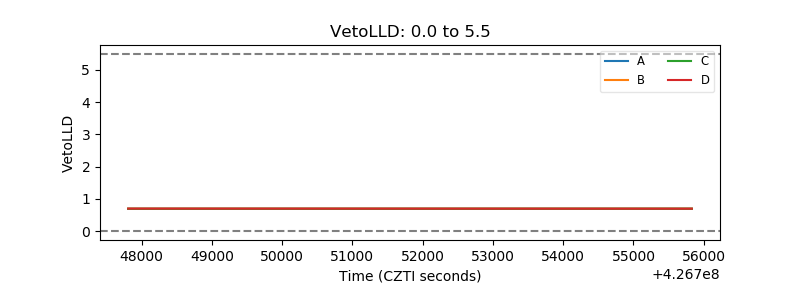 |
| Alpha Counter | 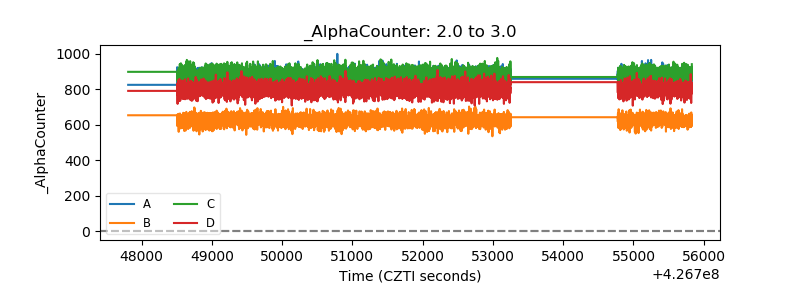 |
| _CPM_Rate |  |
| CZT Counter | 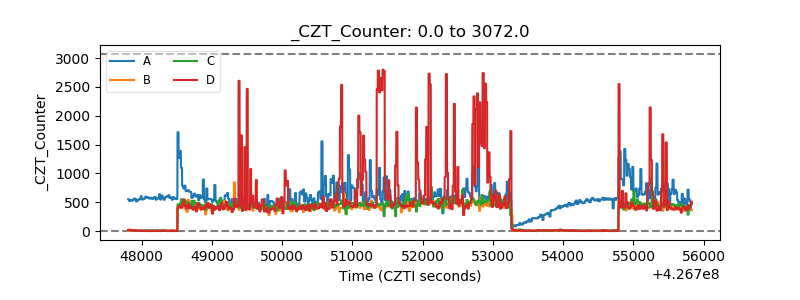 |
| +2.5 Volts monitor | 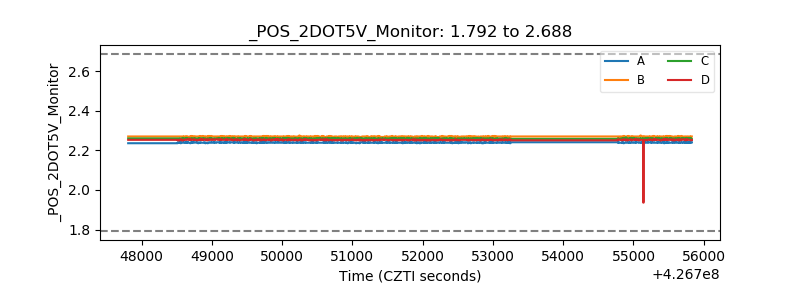 |
| +5 Volts monitor |  |
| _ROLL_ROT | 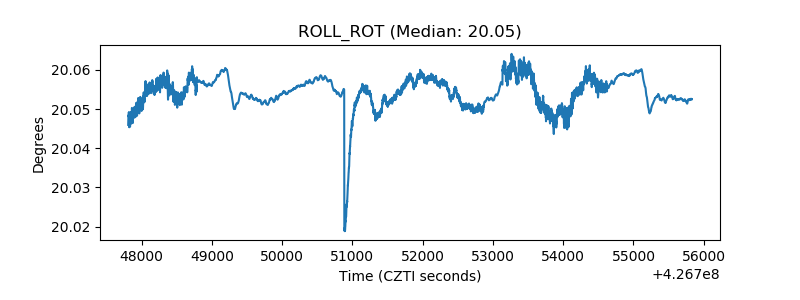 |
| _Roll_DEC | 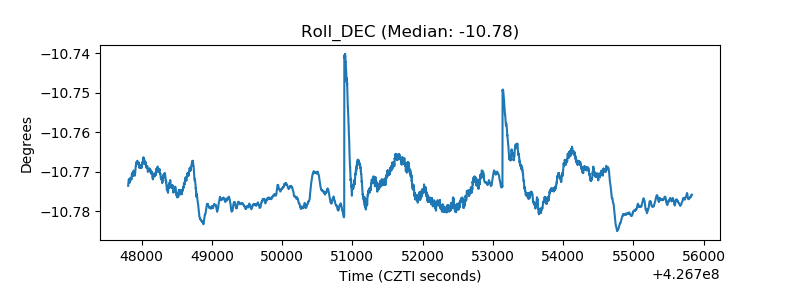 |
| _Roll_RA | 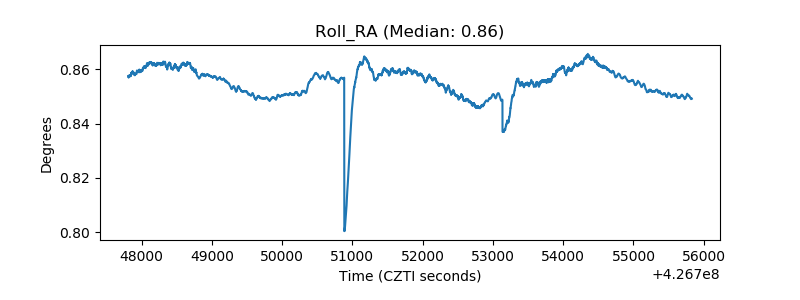 |
| Veto Counter | 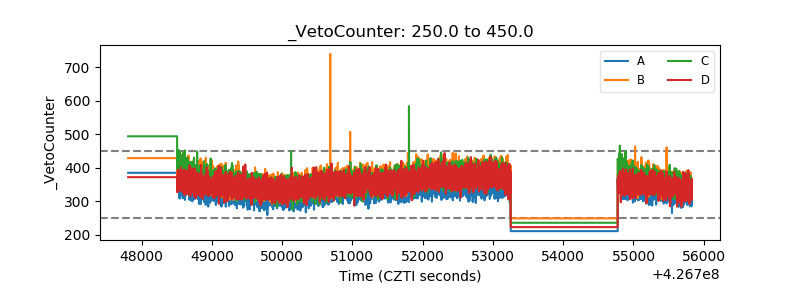 |