| Param | Original file | Final file |
|---|---|---|
| Filename | modeM0/AS1A12_044T22_9000005740_42088cztM0_level2.fits | modeM0/AS1A12_044T22_9000005740_42088cztM0_level2_quad_clean.evt |
| Size (bytes) | 413,136,000 | 94,740,480 |
| Size | 394.0 MB | 90.4 MB |
| Events in quadrant A | 5,741,112 | 613,131 |
| Events in quadrant B | 2,624,347 | 657,580 |
| Events in quadrant C | 2,768,910 | 627,873 |
| Events in quadrant D | 3,692,389 | 551,168 |
| Mode M0 | |||
|---|---|---|---|
| Quadrant | BADHDUFLAG | Total packets | Discarded packets |
| A | 0 | 21164 | 2 |
| B | 0 | 12103 | 2 |
| C | 0 | 12032 | 2 |
| D | 0 | 15329 | 2 |
| Mode SS | |||
|---|---|---|---|
| Quadrant | BADHDUFLAG | Total packets | Discarded packets |
| A | 0 | 122 | 0 |
| B | 0 | 122 | 0 |
| C | 0 | 122 | 0 |
| D | 0 | 122 | 0 |
| Mode M9 | |||
|---|---|---|---|
| Quadrant | BADHDUFLAG | Total packets | Discarded packets |
| A | 0 | 14 | 0 |
| B | 0 | 15 | 0 |
| C | 0 | 15 | 0 |
| D | 0 | 15 | 0 |
| Quadrant | Total seconds | Saturated seconds | Saturation percentage |
|---|---|---|---|
| A | 5996 | 268 | 4.469646% |
| B | 5996 | 13 | 0.216811% |
| C | 5996 | 4 | 0.066711% |
| D | 5996 | 344 | 5.737158% |
Noise dominated data is calculated using 1-second bins in cleaned event files. If a bin has >2000 counts, and if more than 50% of those come from <1% of pixels, then it is considered to be noise-dominated and hence unusable.
| Quadrant | # 1 sec bins | Bins with >0 counts | Bins with >2000 counts | High rate bins dominated by noise | Noise dominated (total time) | Noise dominated (detector-on time) | Marked lightcurve |
|---|---|---|---|---|---|---|---|
| A | 7339 | 5997 | 182 | 182 | 2.48% | 3.03% | 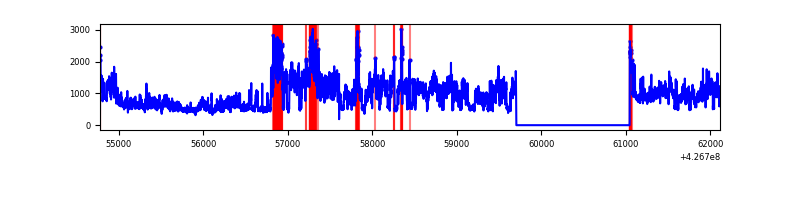 |
| B | 7339 | 5997 | 1 | 1 | 0.01% | 0.02% | 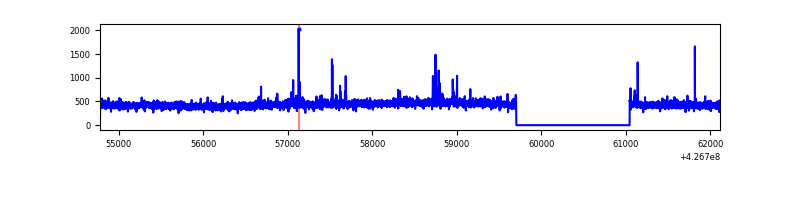 |
| C | 7339 | 5997 | 0 | 0 | 0.00% | 0.00% | 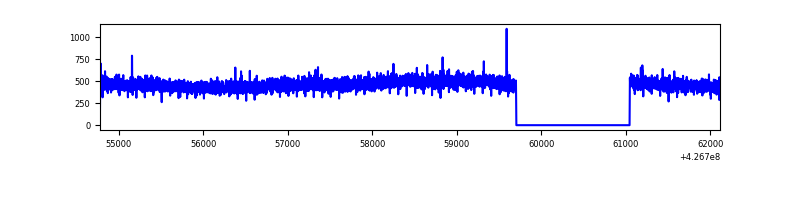 |
| D | 7339 | 5997 | 276 | 276 | 3.76% | 4.60% | 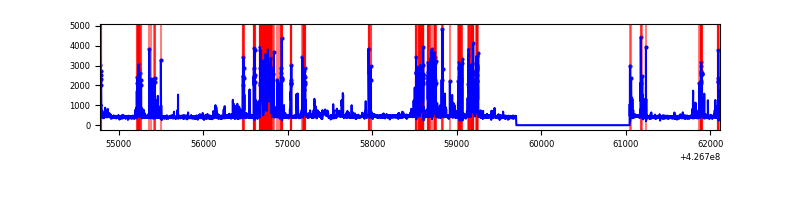 |
Top three noisy pixels from each quadrant. If the there are fewer than three noisy pixels in the level2.evt file, extra rows are filled as -1
| Pixel properties | Quadrant properties | ||||||
|---|---|---|---|---|---|---|---|
| Quadrant | DetID | PixID | Counts | Sigma | Mean | Median | Sigma |
| A | 15 | 222 | 2617407 | 19520.25 | 650 | 636 | 134.1 |
| A | 10 | 83 | 567396 | 4227.84 | 650 | 636 | 134.1 |
| A | 15 | 223 | 26823 | 195.35 | 650 | 636 | 134.1 |
| B | 3 | 112 | 29668 | 225.24 | 655 | 636 | 128.9 |
| B | 5 | 255 | 25060 | 189.49 | 655 | 636 | 128.9 |
| B | 12 | 111 | 16572 | 123.63 | 655 | 636 | 128.9 |
| C | 15 | 214 | 248402 | 1615.8 | 645 | 648 | 153.3 |
| C | 12 | 249 | 4460 | 24.86 | 645 | 648 | 153.3 |
| C | 13 | 61 | 4294 | 23.78 | 645 | 648 | 153.3 |
| D | 13 | 249 | 744459 | 4805.02 | 629 | 612 | 154.8 |
| D | 12 | 6 | 362155 | 2335.45 | 629 | 612 | 154.8 |
| D | 1 | 52 | 38406 | 244.14 | 629 | 612 | 154.8 |
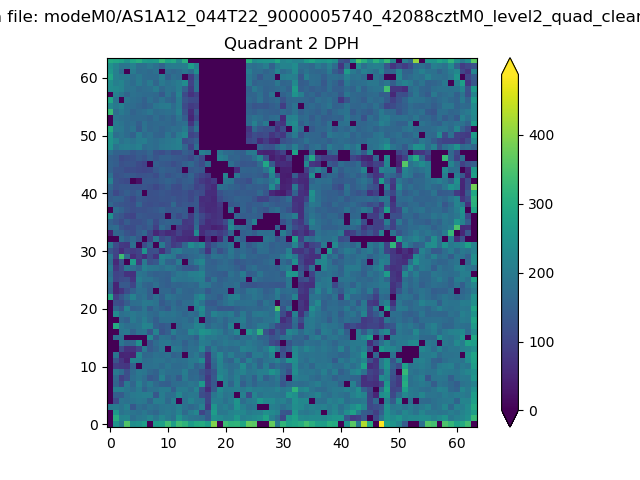
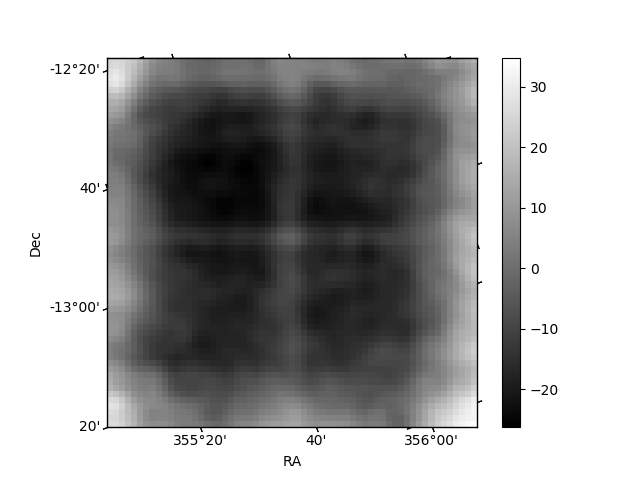
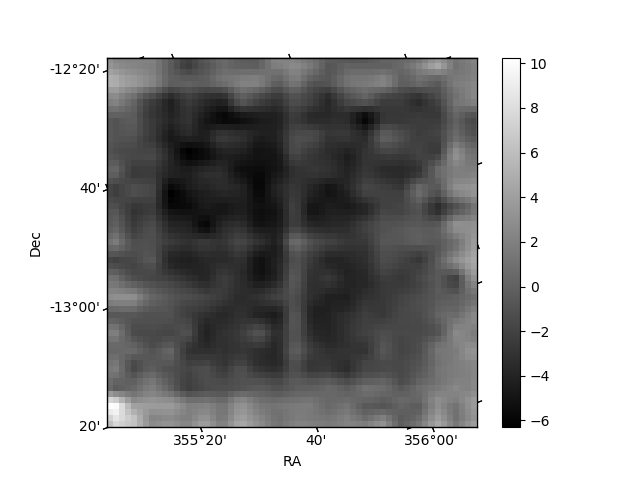
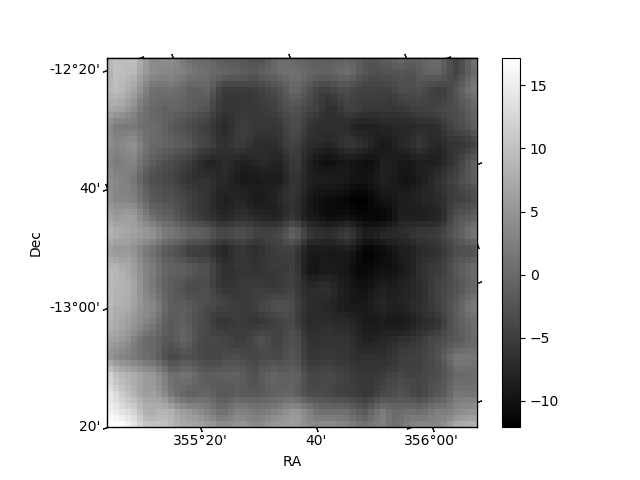
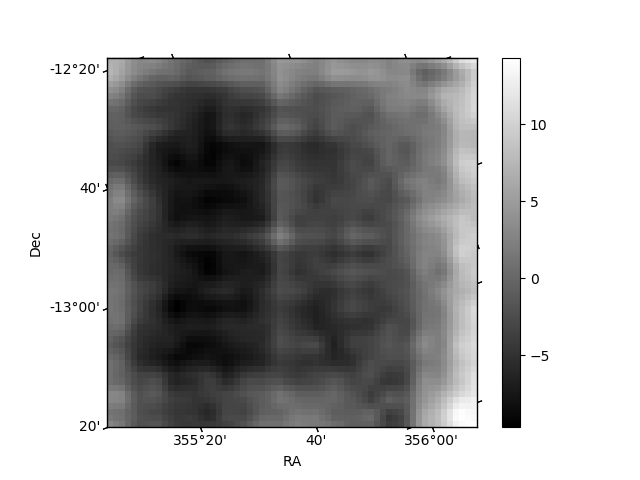
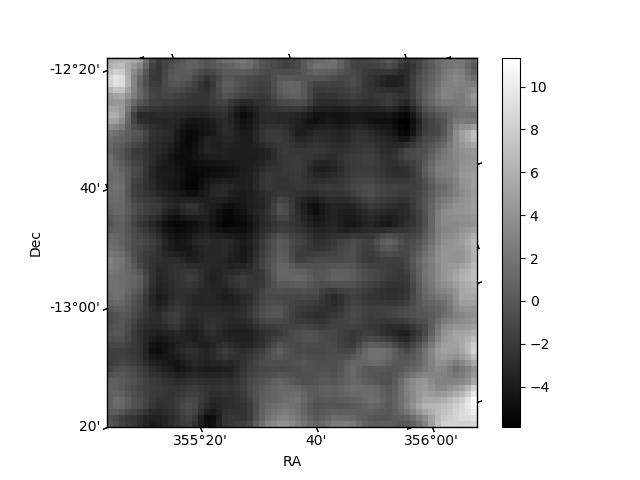
Histogram calculated using DETX and DETY for each event in the final _common_clean file
| Quadrant A | 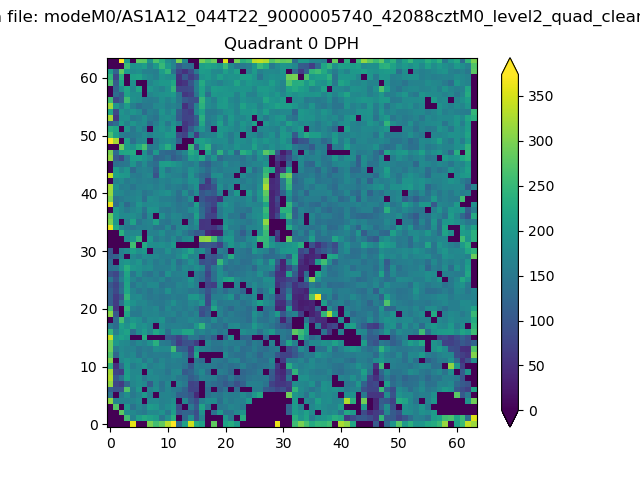 |
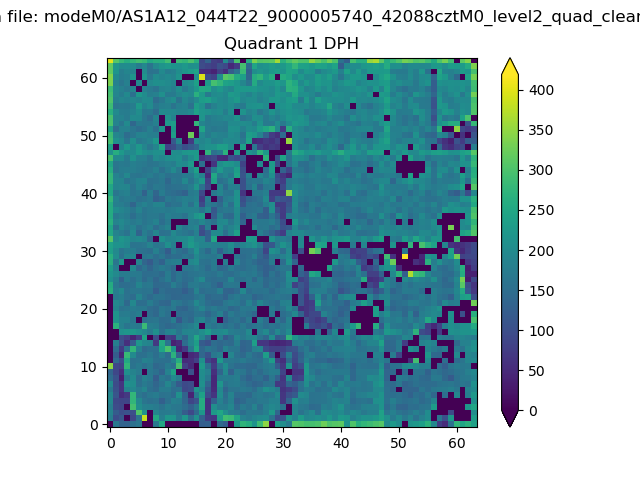 |
Quadrant B |
|---|---|---|---|
| Quadrant D | 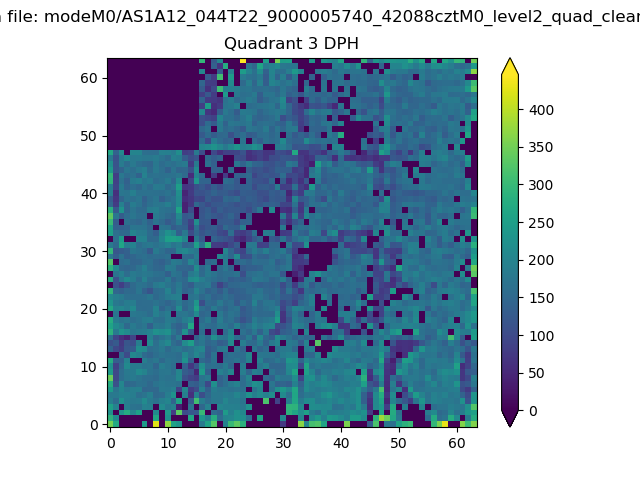 |
 |
Quadrant C |
| Plot type | Count rate plots | Images |
|---|---|---|
| Comparison with Poisson distribution Blue bars denote a histogram of data divided into 1 sec bins. Red curve is a Poisson curve with rate = median count rate of data. |
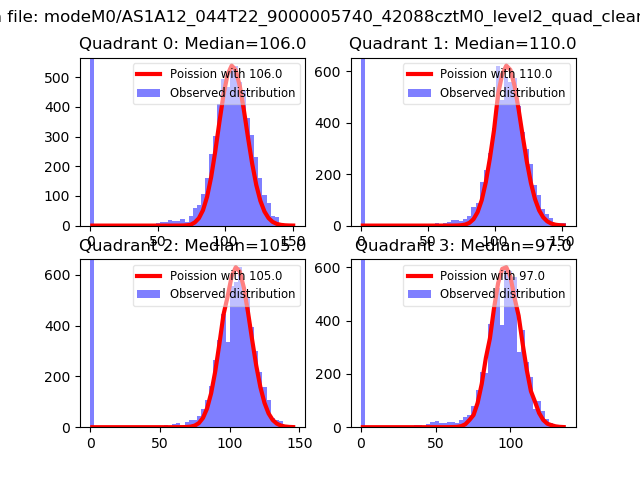 |
 |
| Quadrant-wise count rates Data is divided into 100 sec bins |
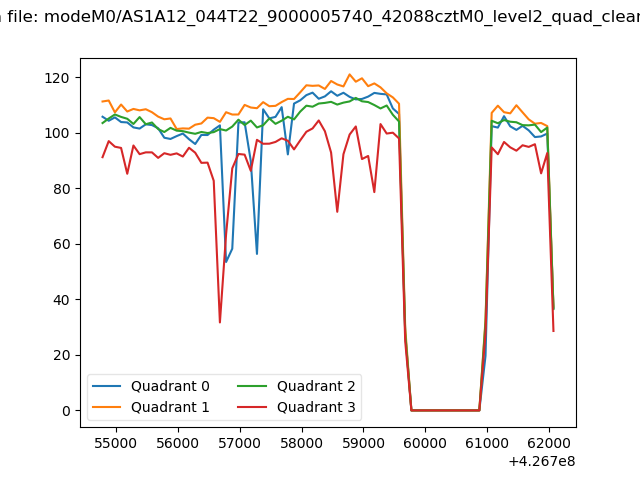 |
|
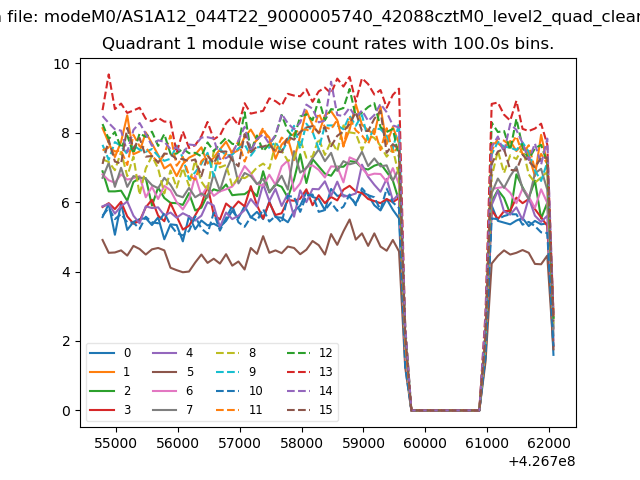
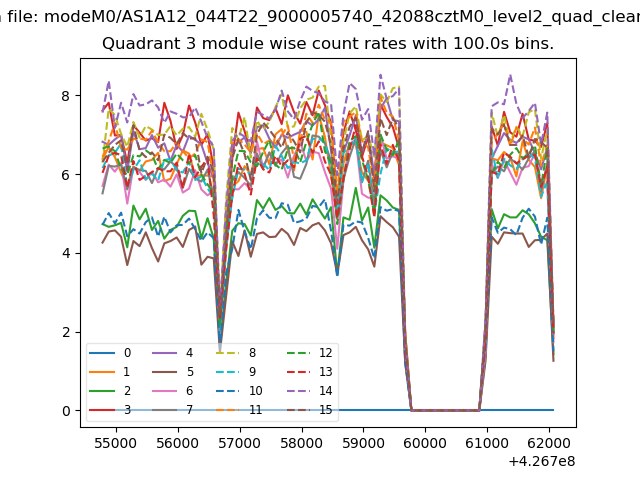
| Module-wise count rates for Quadrant A Data is divided into 100 sec bins |
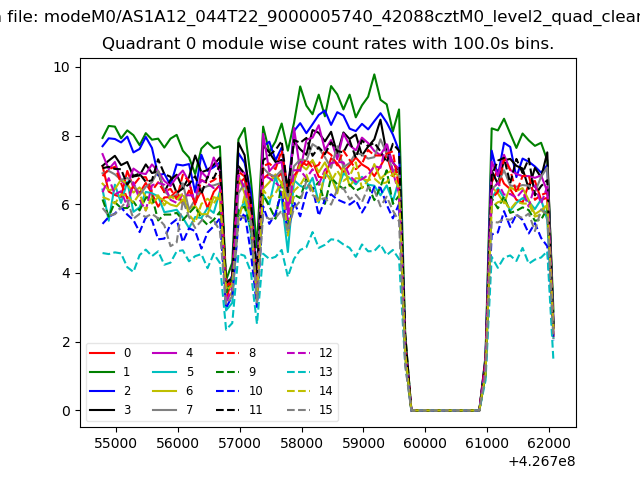 |
 |
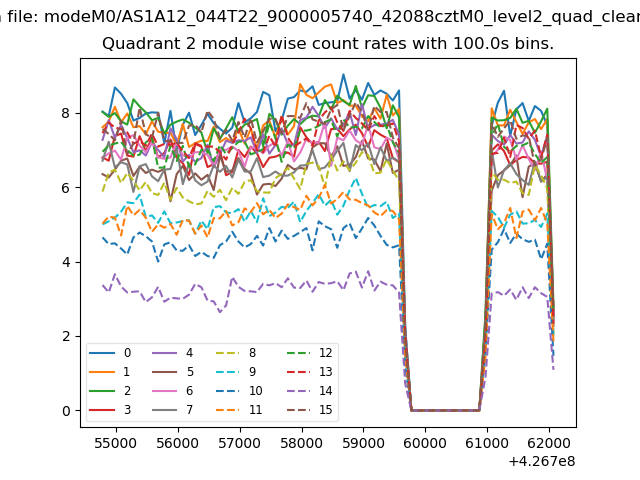
| Module-wise count rates for Quadrant B Data is divided into 100 sec bins |
 |
 |
| Module-wise count rates for Quadrant C Data is divided into 100 sec bins |
 |
 |
| Module-wise count rates for Quadrant D Data is divided into 100 sec bins |
 |
 |
| Parameter | Plot |
|---|---|
| CZT HV Monitor | 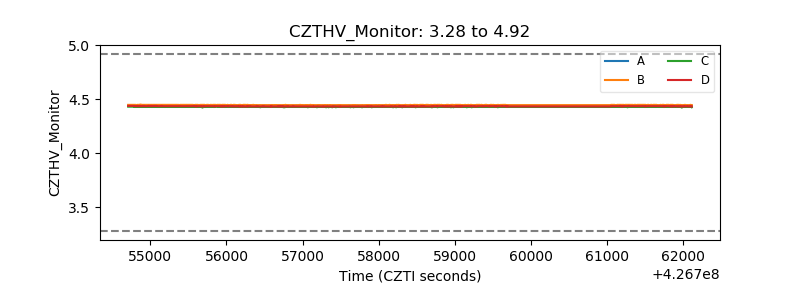 |
| D_VDD | 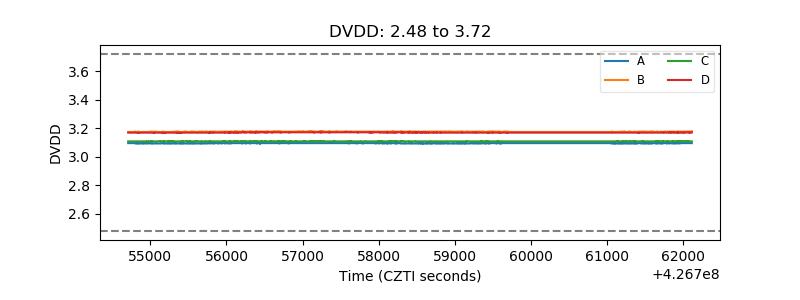 |
| Temperature 1 |  |
| Veto HV Monitor | 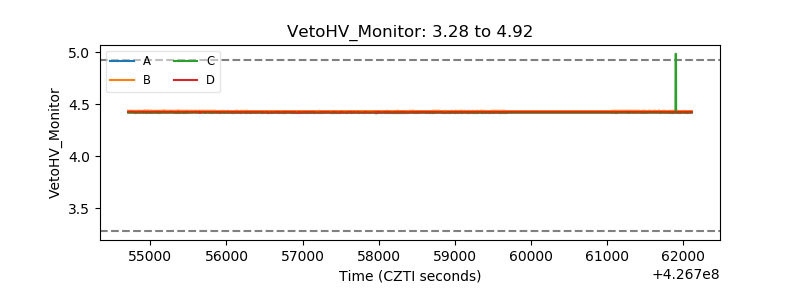 |
| Veto LLD | 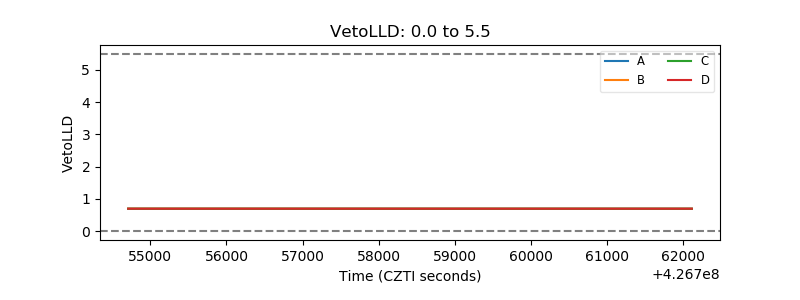 |
| Alpha Counter | 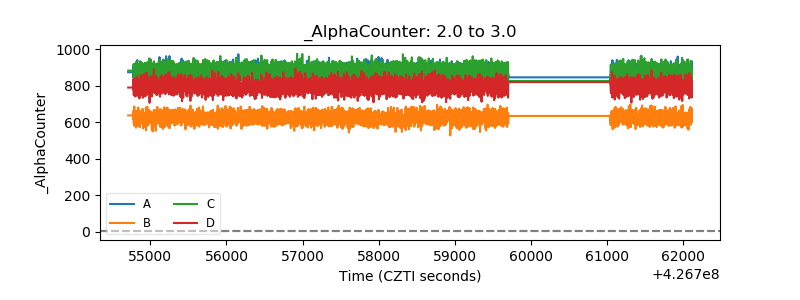 |
| _CPM_Rate | 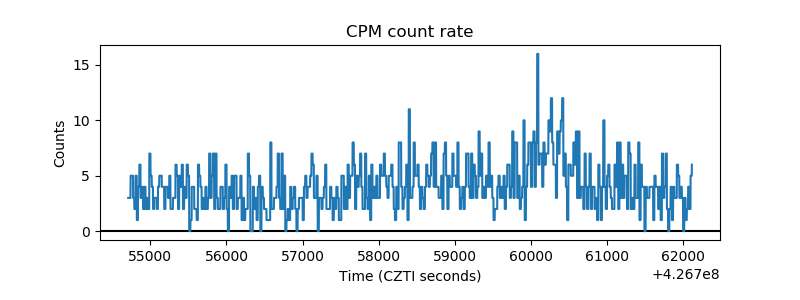 |
| CZT Counter |  |
| +2.5 Volts monitor | 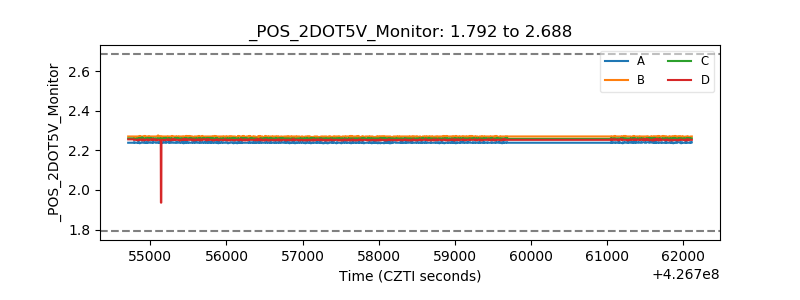 |
| +5 Volts monitor |  |
| _ROLL_ROT | 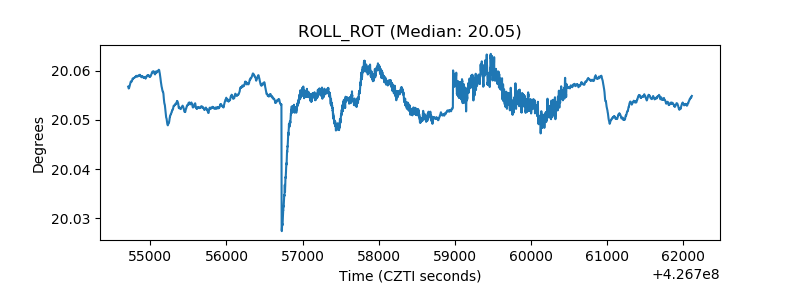 |
| _Roll_DEC | 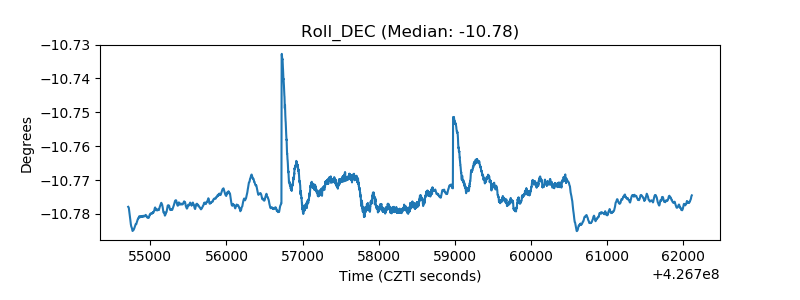 |
| _Roll_RA | 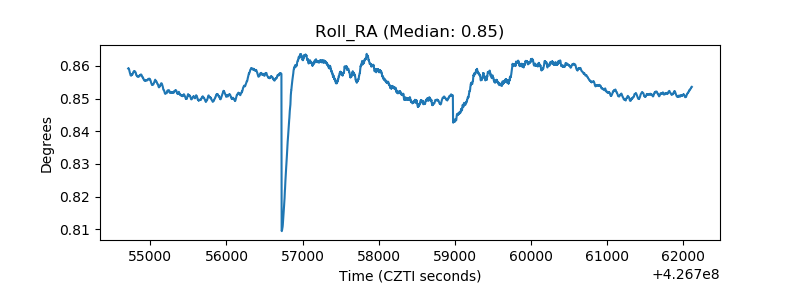 |
| Veto Counter | 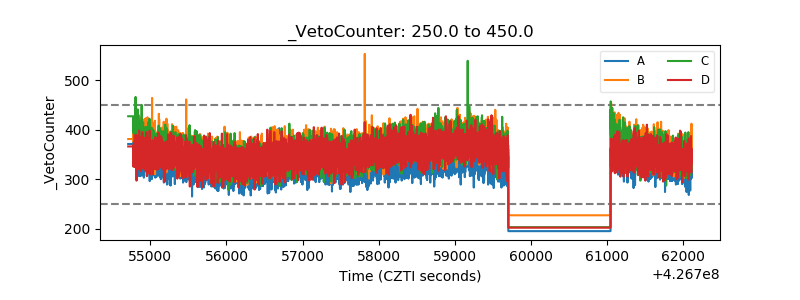 |