| Param | Original file | Final file |
|---|---|---|
| Filename | modeM0/AS1A12_044T22_9000005740_42089cztM0_level2.fits | modeM0/AS1A12_044T22_9000005740_42089cztM0_level2_quad_clean.evt |
| Size (bytes) | 164,257,920 | 35,925,120 |
| Size | 156.6 MB | 34.3 MB |
| Events in quadrant A | 2,487,390 | 226,296 |
| Events in quadrant B | 976,401 | 245,646 |
| Events in quadrant C | 1,037,880 | 236,586 |
| Events in quadrant D | 1,396,829 | 212,984 |
| Mode M0 | |||
|---|---|---|---|
| Quadrant | BADHDUFLAG | Total packets | Discarded packets |
| A | 0 | 9053 | 51 |
| B | 0 | 4654 | 7 |
| C | 0 | 4646 | 13 |
| D | 0 | 5832 | 6 |
| Mode SS | |||
|---|---|---|---|
| Quadrant | BADHDUFLAG | Total packets | Discarded packets |
| A | 0 | 46 | 0 |
| B | 0 | 46 | 0 |
| C | 0 | 46 | 0 |
| D | 0 | 46 | 0 |
| Mode M9 | |||
|---|---|---|---|
| Quadrant | BADHDUFLAG | Total packets | Discarded packets |
| A | 0 | 3 | 0 |
| B | 0 | 4 | 0 |
| C | 0 | 4 | 0 |
| D | 0 | 4 | 0 |
| Quadrant | Total seconds | Saturated seconds | Saturation percentage |
|---|---|---|---|
| A | 2306 | 137 | 5.941023% |
| B | 2311 | 5 | 0.216357% |
| C | 2309 | 1 | 0.043309% |
| D | 2312 | 94 | 4.065744% |
Noise dominated data is calculated using 1-second bins in cleaned event files. If a bin has >2000 counts, and if more than 50% of those come from <1% of pixels, then it is considered to be noise-dominated and hence unusable.
| Quadrant | # 1 sec bins | Bins with >0 counts | Bins with >2000 counts | High rate bins dominated by noise | Noise dominated (total time) | Noise dominated (detector-on time) | Marked lightcurve |
|---|---|---|---|---|---|---|---|
| A | 2309 | 2308 | 86 | 86 | 3.72% | 3.73% | 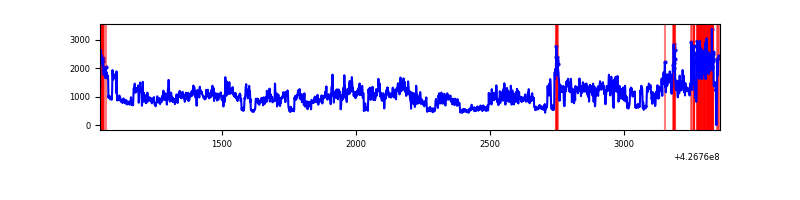 |
| B | 2311 | 2311 | 0 | 0 | 0.00% | 0.00% | 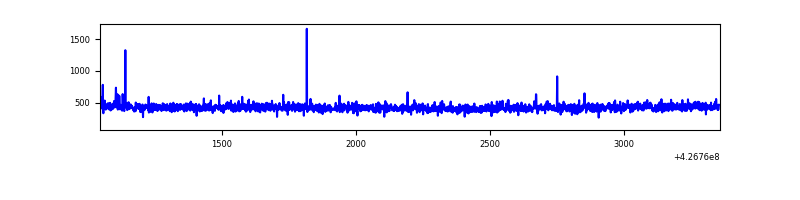 |
| C | 2309 | 2309 | 0 | 0 | 0.00% | 0.00% | 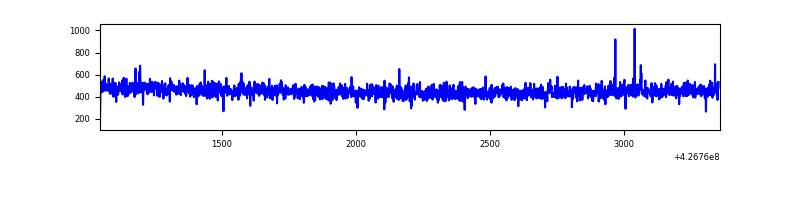 |
| D | 2313 | 2313 | 83 | 83 | 3.59% | 3.59% | 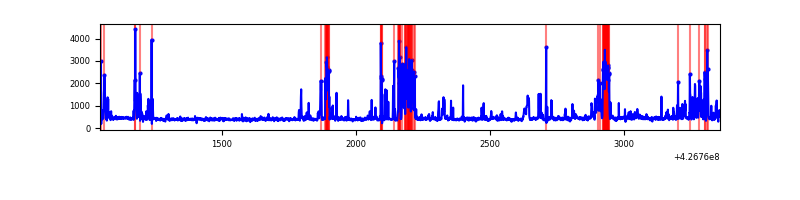 |
Top three noisy pixels from each quadrant. If the there are fewer than three noisy pixels in the level2.evt file, extra rows are filled as -1
| Pixel properties | Quadrant properties | ||||||
|---|---|---|---|---|---|---|---|
| Quadrant | DetID | PixID | Counts | Sigma | Mean | Median | Sigma |
| A | 15 | 222 | 1183186 | 22857.44 | 244 | 239 | 51.8 |
| A | 10 | 83 | 249637 | 4818.98 | 244 | 239 | 51.8 |
| A | 15 | 223 | 94512 | 1821.59 | 244 | 239 | 51.8 |
| B | 5 | 255 | 8453 | 163.22 | 245 | 238 | 50.3 |
| B | 12 | 111 | 6154 | 117.54 | 245 | 238 | 50.3 |
| B | 11 | 111 | 5785 | 110.21 | 245 | 238 | 50.3 |
| C | 15 | 214 | 98271 | 1695.42 | 239 | 239 | 57.8 |
| C | 12 | 249 | 5663 | 93.8 | 239 | 239 | 57.8 |
| C | 13 | 61 | 1655 | 24.48 | 239 | 239 | 57.8 |
| D | 13 | 249 | 247855 | 4146.07 | 238 | 231 | 59.7 |
| D | 1 | 47 | 81045 | 1353.1 | 238 | 231 | 59.7 |
| D | 12 | 6 | 54611 | 910.51 | 238 | 231 | 59.7 |
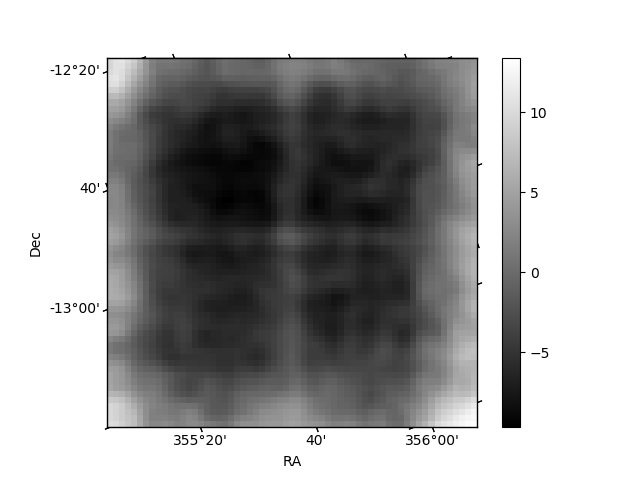
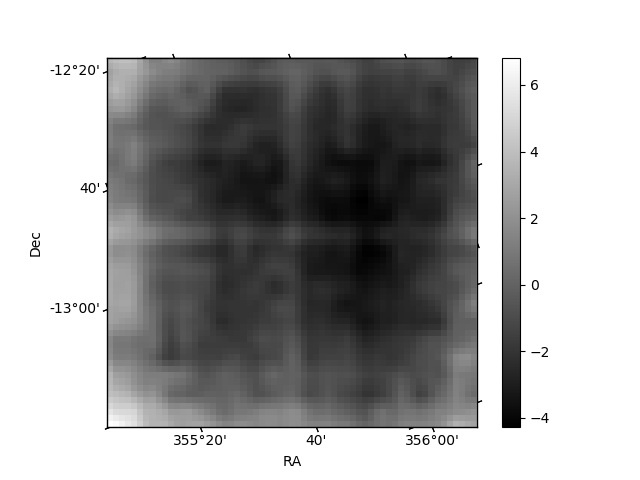
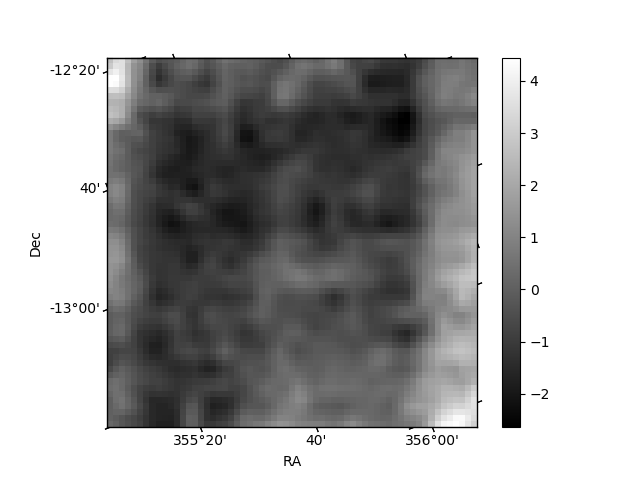
Histogram calculated using DETX and DETY for each event in the final _common_clean file
| Quadrant A | 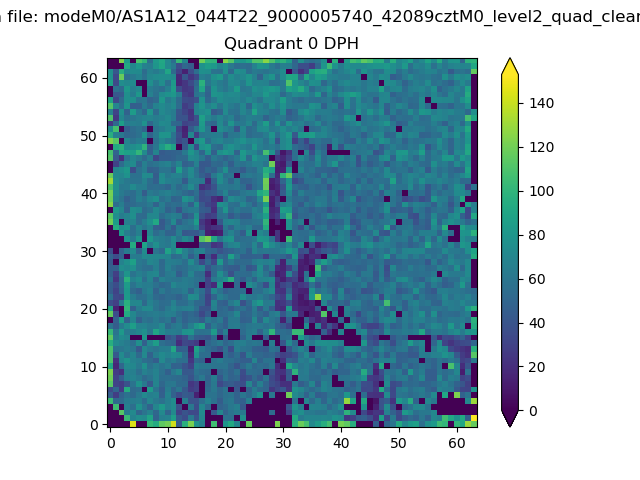 |
 |
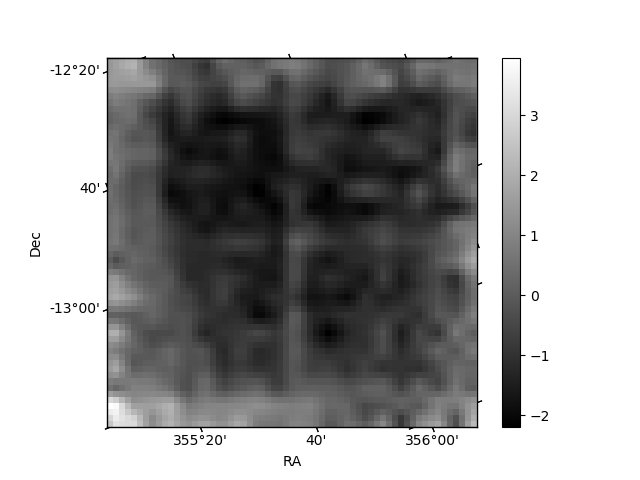
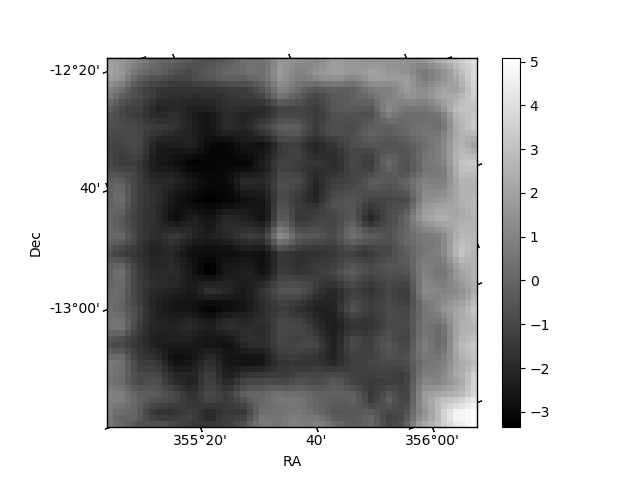
Quadrant B |
|---|---|---|---|
| Quadrant D | 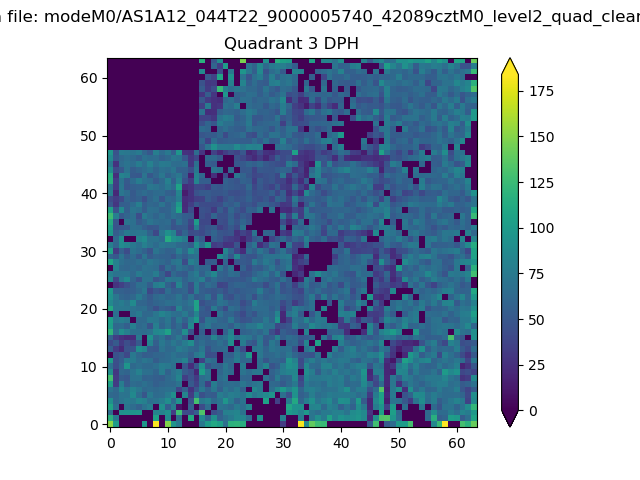 |
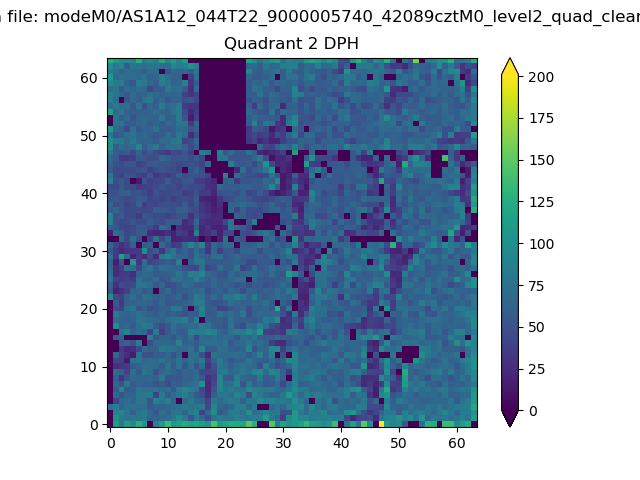 |
Quadrant C |
| Plot type | Count rate plots | Images |
|---|---|---|
| Comparison with Poisson distribution Blue bars denote a histogram of data divided into 1 sec bins. Red curve is a Poisson curve with rate = median count rate of data. |
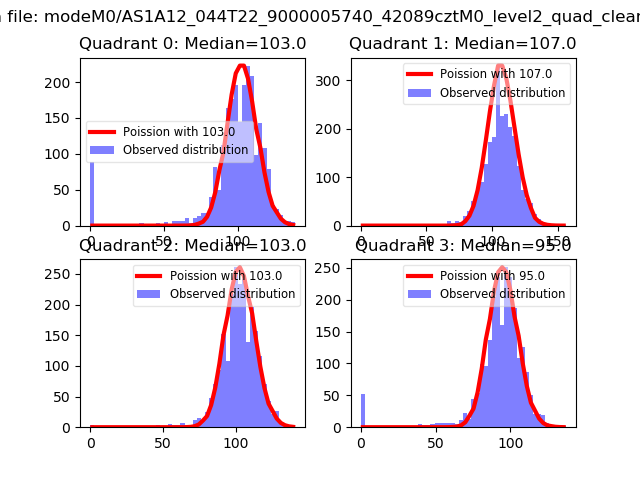 |
 |
| Quadrant-wise count rates Data is divided into 100 sec bins |
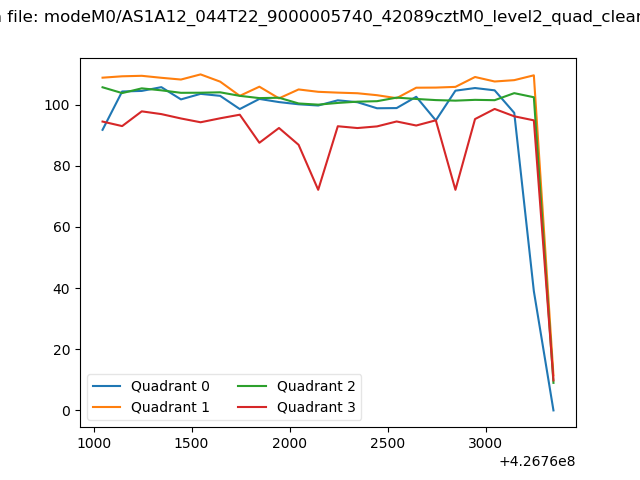 |
|
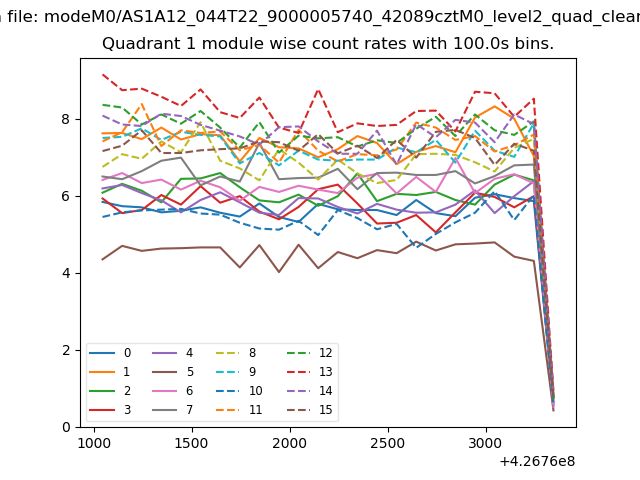
| Module-wise count rates for Quadrant A Data is divided into 100 sec bins |
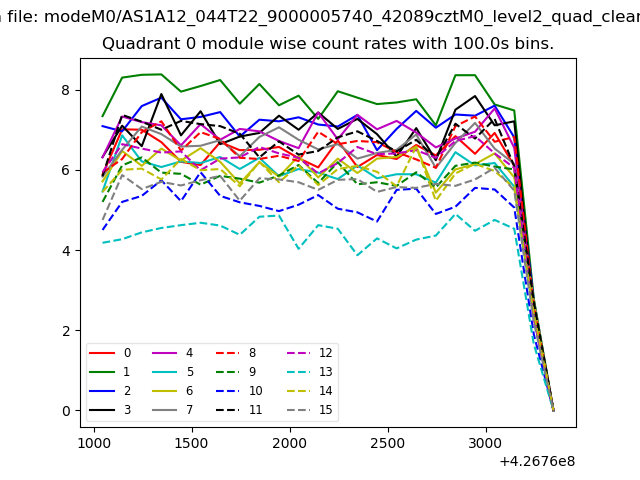 |
 |
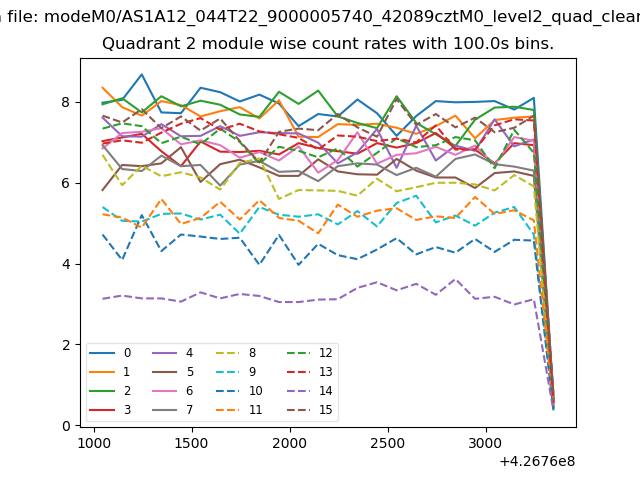
| Module-wise count rates for Quadrant B Data is divided into 100 sec bins |
 |
 |
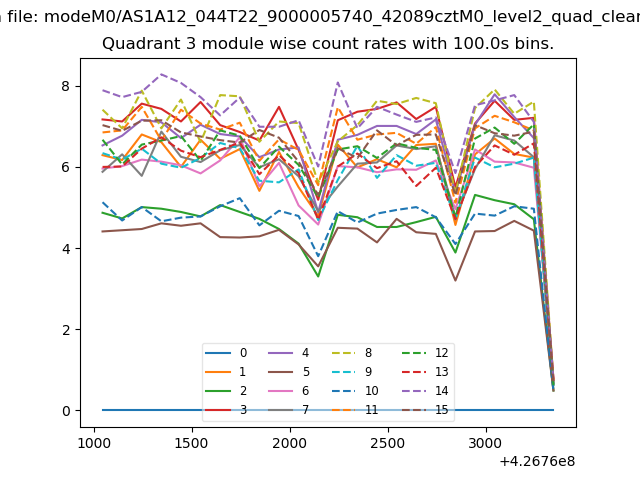
| Module-wise count rates for Quadrant C Data is divided into 100 sec bins |
 |
 |
| Module-wise count rates for Quadrant D Data is divided into 100 sec bins |
 |
 |
| Parameter | Plot |
|---|---|
| CZT HV Monitor | 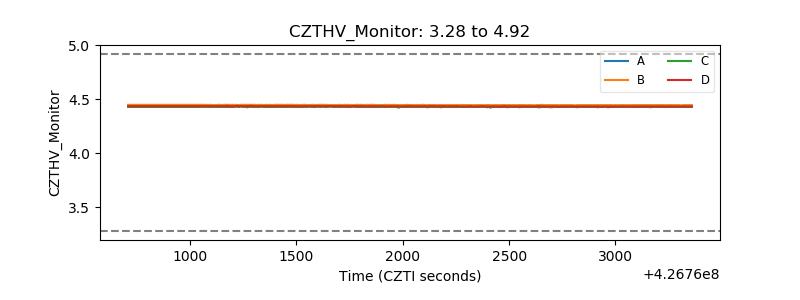 |
| D_VDD | 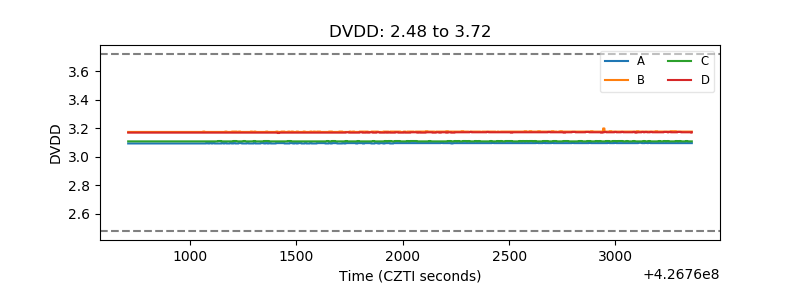 |
| Temperature 1 |  |
| Veto HV Monitor | 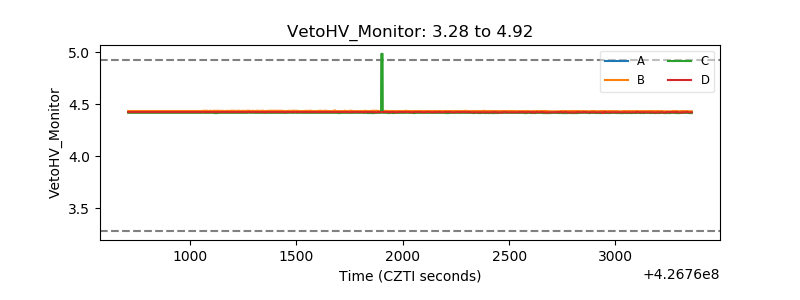 |
| Veto LLD | 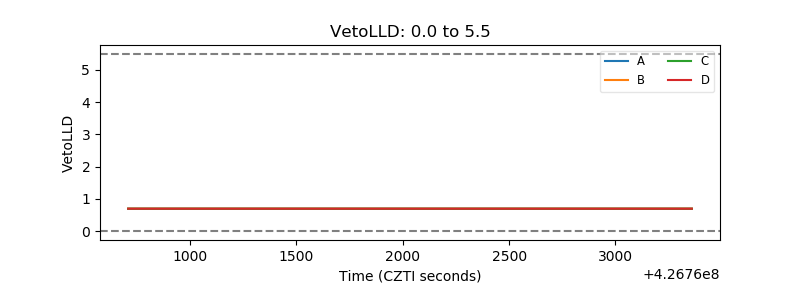 |
| Alpha Counter | 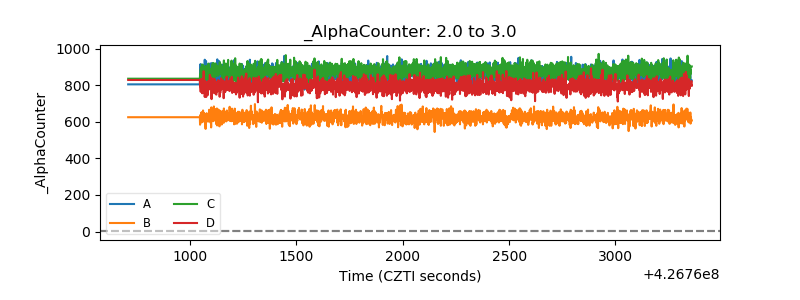 |
| _CPM_Rate | 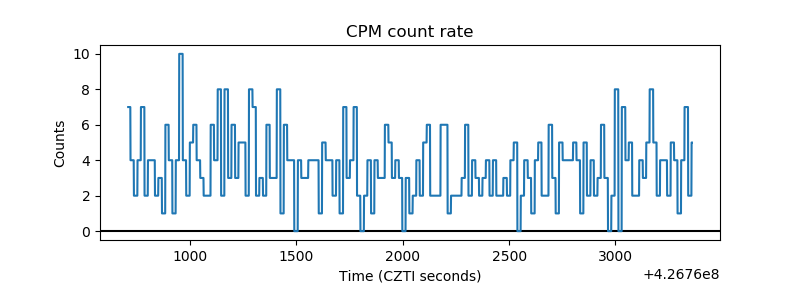 |
| CZT Counter | 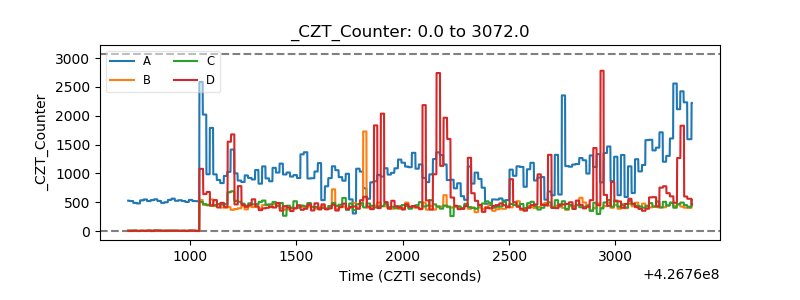 |
| +2.5 Volts monitor | 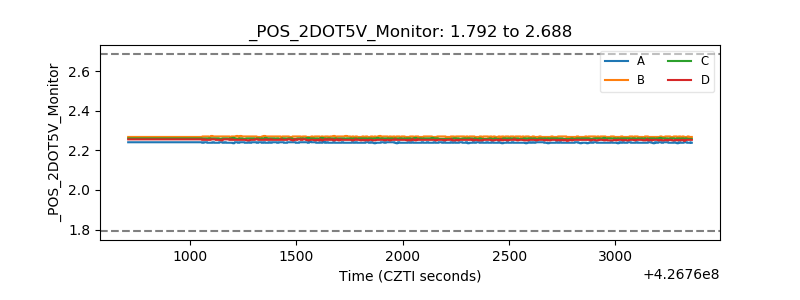 |
| +5 Volts monitor | 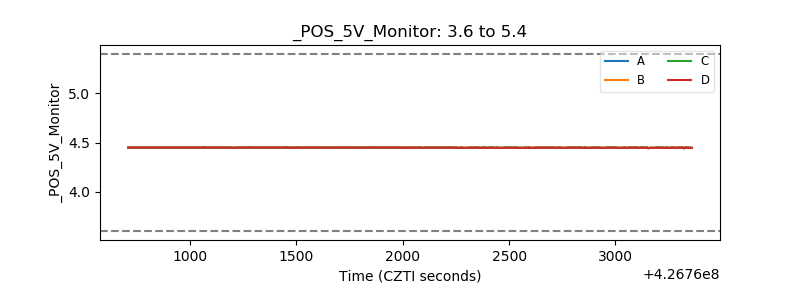 |
| _ROLL_ROT | 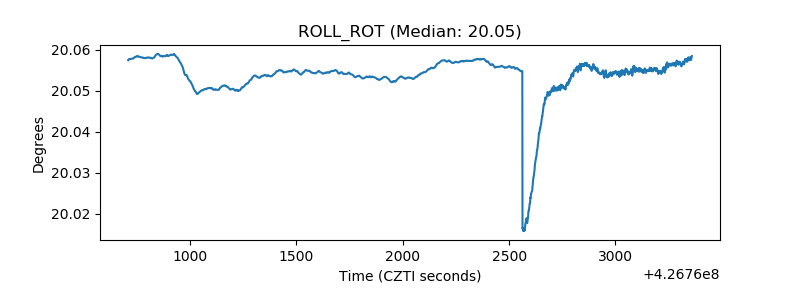 |
| _Roll_DEC | 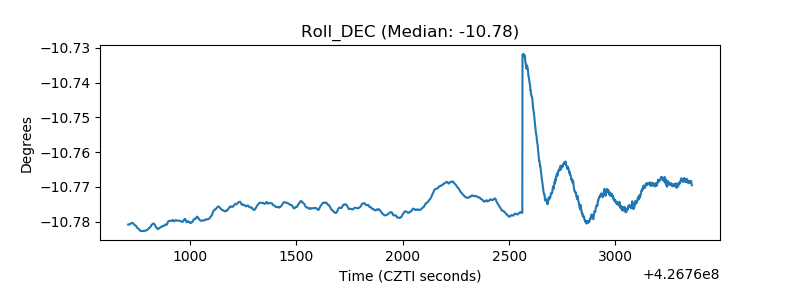 |
| _Roll_RA | 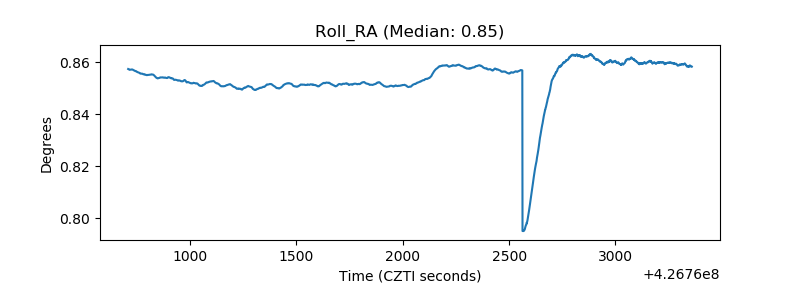 |
| Veto Counter | 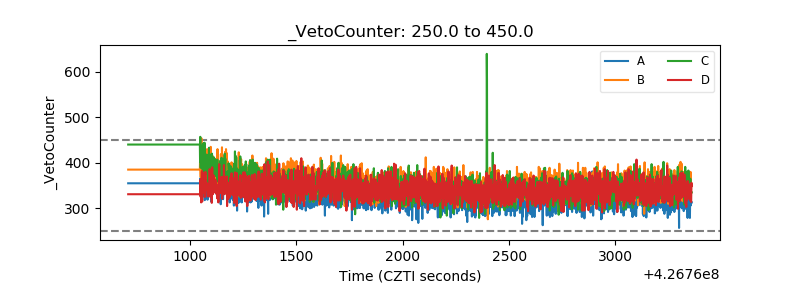 |