| Param | Original file | Final file |
|---|---|---|
| Filename | modeM0/AS1A12_044T22_9000005740_42091cztM0_level2.fits | modeM0/AS1A12_044T22_9000005740_42091cztM0_level2_quad_clean.evt |
| Size (bytes) | 577,255,680 | 134,504,640 |
| Size | 550.5 MB | 128.3 MB |
| Events in quadrant A | 7,130,467 | 894,132 |
| Events in quadrant B | 3,850,958 | 923,140 |
| Events in quadrant C | 3,939,448 | 883,059 |
| Events in quadrant D | 5,790,127 | 783,679 |
| Mode M0 | |||
|---|---|---|---|
| Quadrant | BADHDUFLAG | Total packets | Discarded packets |
| A | 0 | 26816 | 2 |
| B | 0 | 17502 | 2 |
| C | 0 | 17032 | 2 |
| D | 0 | 22898 | 2 |
| Mode SS | |||
|---|---|---|---|
| Quadrant | BADHDUFLAG | Total packets | Discarded packets |
| A | 0 | 174 | 0 |
| B | 0 | 174 | 0 |
| C | 0 | 174 | 0 |
| D | 0 | 174 | 0 |
| Mode M9 | |||
|---|---|---|---|
| Quadrant | BADHDUFLAG | Total packets | Discarded packets |
| A | 0 | 26 | 0 |
| B | 0 | 26 | 0 |
| C | 0 | 26 | 0 |
| D | 0 | 26 | 0 |
| Quadrant | Total seconds | Saturated seconds | Saturation percentage |
|---|---|---|---|
| A | 8471 | 293 | 3.458860% |
| B | 8471 | 62 | 0.731909% |
| C | 8472 | 8 | 0.094429% |
| D | 8472 | 427 | 5.040132% |
Noise dominated data is calculated using 1-second bins in cleaned event files. If a bin has >2000 counts, and if more than 50% of those come from <1% of pixels, then it is considered to be noise-dominated and hence unusable.
| Quadrant | # 1 sec bins | Bins with >0 counts | Bins with >2000 counts | High rate bins dominated by noise | Noise dominated (total time) | Noise dominated (detector-on time) | Marked lightcurve |
|---|---|---|---|---|---|---|---|
| A | 11098 | 8473 | 253 | 253 | 2.28% | 2.99% | 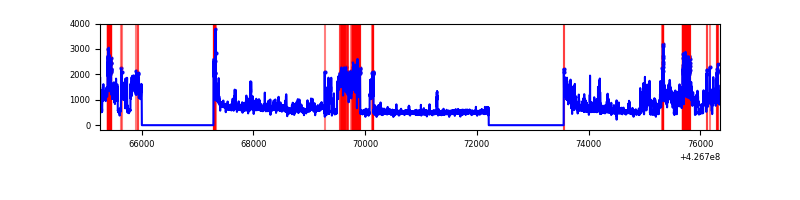 |
| B | 11098 | 8473 | 41 | 41 | 0.37% | 0.48% | 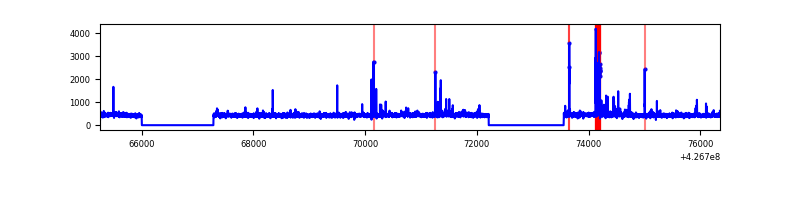 |
| C | 11099 | 8474 | 2 | 2 | 0.02% | 0.02% | 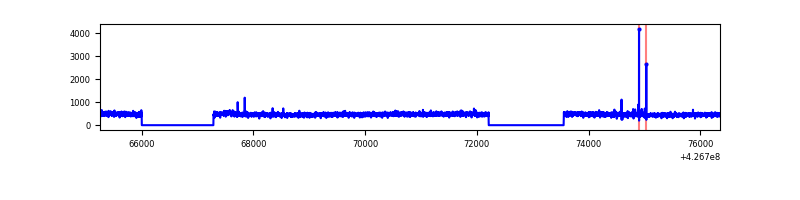 |
| D | 11099 | 8474 | 337 | 337 | 3.04% | 3.98% | 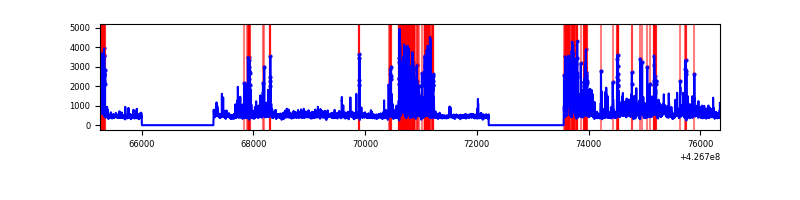 |
Top three noisy pixels from each quadrant. If the there are fewer than three noisy pixels in the level2.evt file, extra rows are filled as -1
| Pixel properties | Quadrant properties | ||||||
|---|---|---|---|---|---|---|---|
| Quadrant | DetID | PixID | Counts | Sigma | Mean | Median | Sigma |
| A | 15 | 222 | 1801008 | 9468.39 | 923 | 904 | 190.1 |
| A | 15 | 223 | 942809 | 4954.34 | 923 | 904 | 190.1 |
| A | 10 | 83 | 764707 | 4017.54 | 923 | 904 | 190.1 |
| B | 5 | 255 | 187743 | 1044.54 | 921 | 892 | 178.9 |
| B | 3 | 112 | 37728 | 205.92 | 921 | 892 | 178.9 |
| B | 12 | 111 | 23085 | 124.06 | 921 | 892 | 178.9 |
| C | 15 | 214 | 343091 | 1610.54 | 908 | 912 | 212.5 |
| C | 8 | 79 | 36827 | 169.04 | 908 | 912 | 212.5 |
| C | 15 | 159 | 12731 | 55.63 | 908 | 912 | 212.5 |
| D | 1 | 52 | 706543 | 3221.25 | 892 | 868 | 219.1 |
| D | 12 | 6 | 492502 | 2244.2 | 892 | 868 | 219.1 |
| D | 2 | 249 | 457610 | 2084.93 | 892 | 868 | 219.1 |
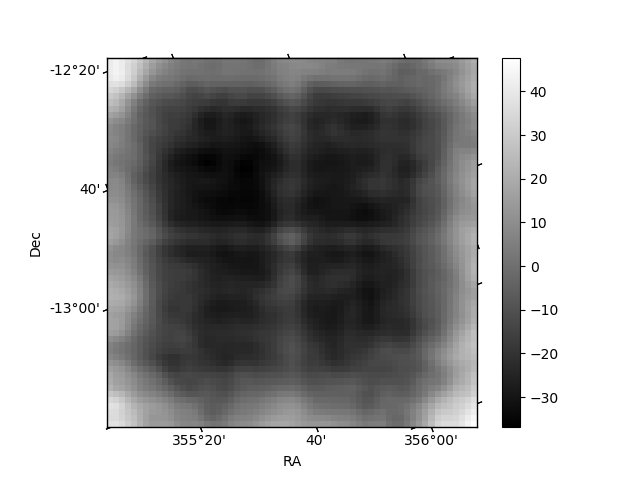
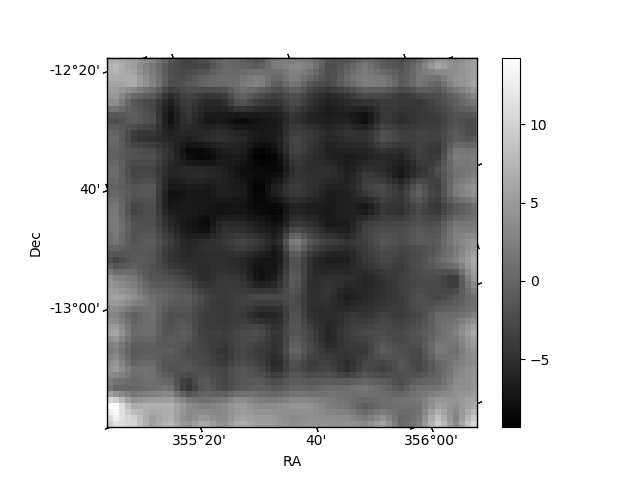
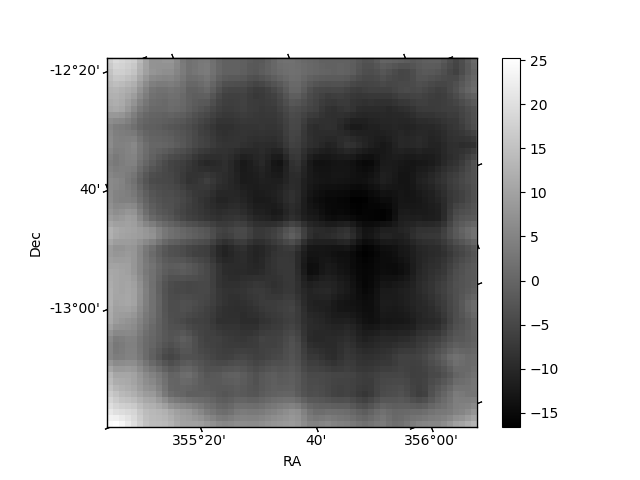
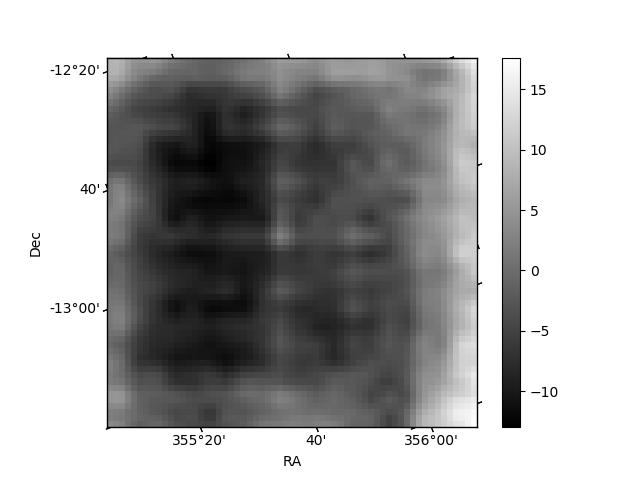
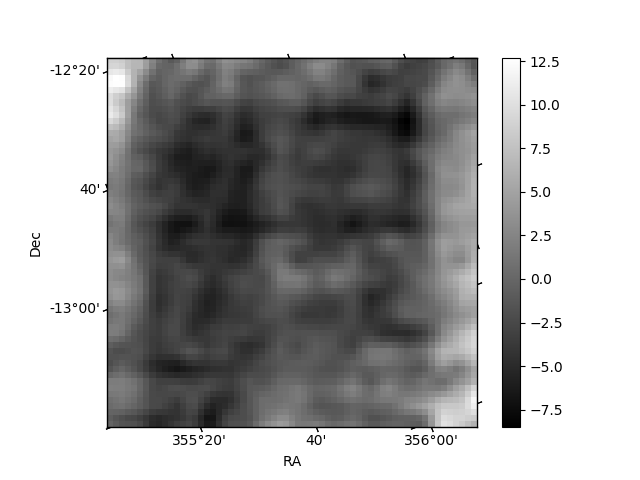
Histogram calculated using DETX and DETY for each event in the final _common_clean file
| Quadrant A | 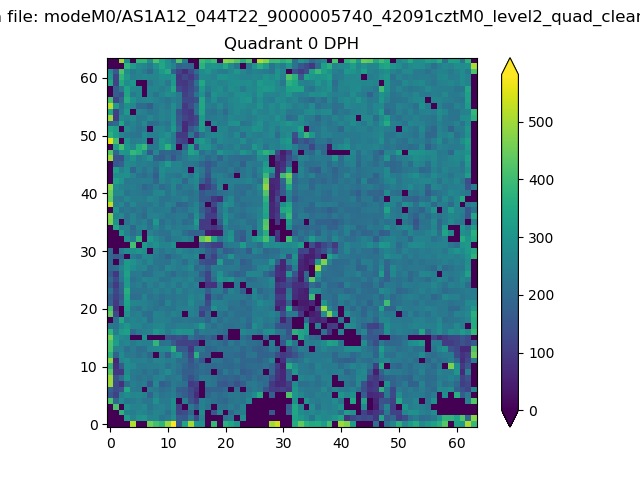 |
 |
Quadrant B |
|---|---|---|---|
| Quadrant D | 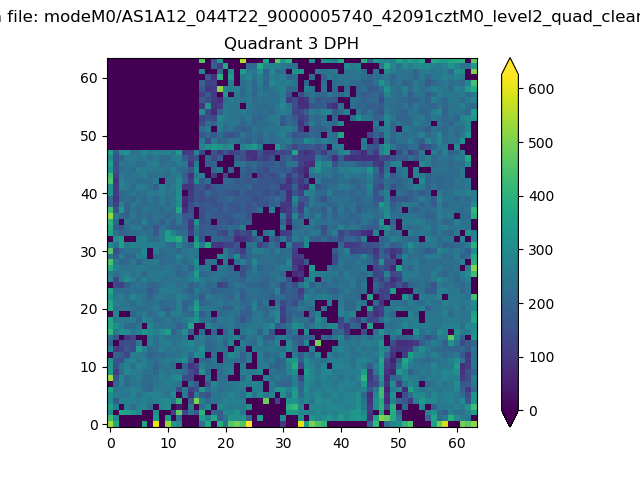 |
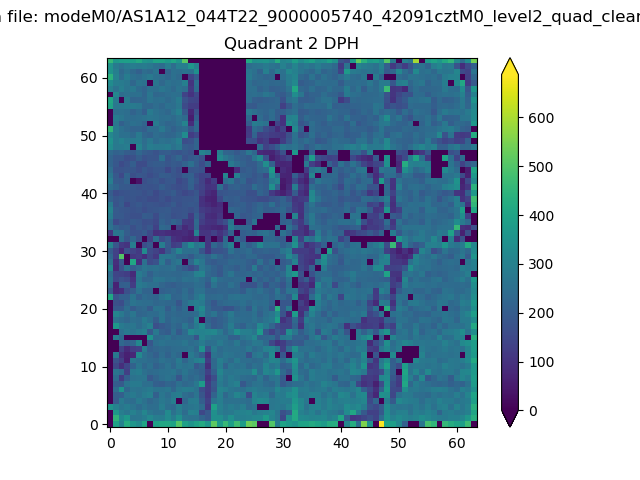 |
Quadrant C |
| Plot type | Count rate plots | Images |
|---|---|---|
| Comparison with Poisson distribution Blue bars denote a histogram of data divided into 1 sec bins. Red curve is a Poisson curve with rate = median count rate of data. |
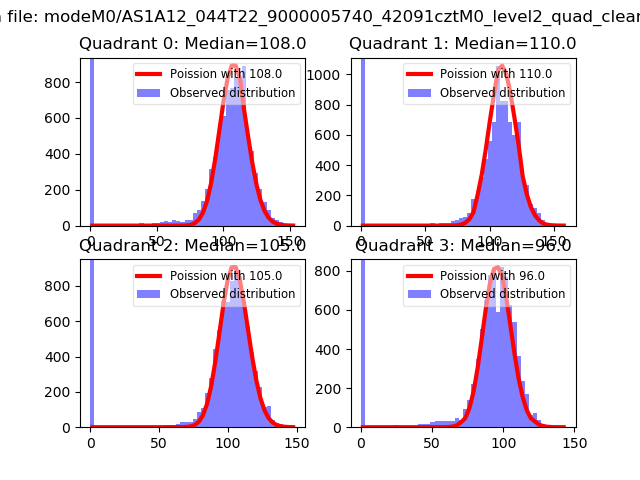 |
 |
| Quadrant-wise count rates Data is divided into 100 sec bins |
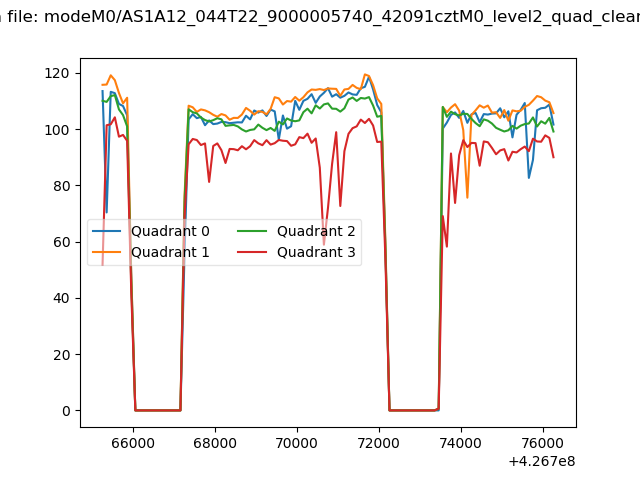 |
|
| Module-wise count rates for Quadrant A Data is divided into 100 sec bins |
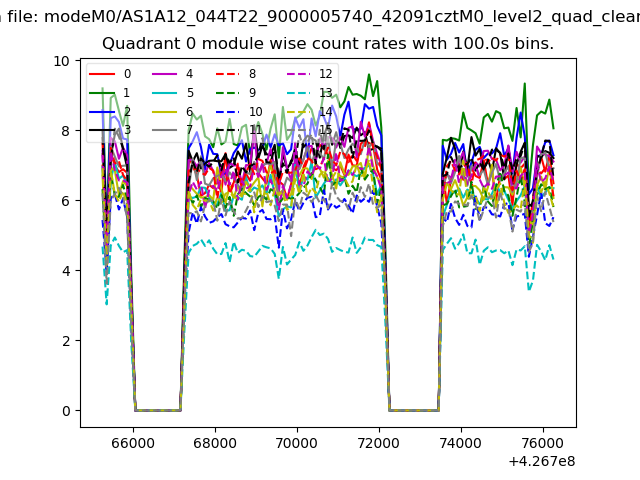 |
 |
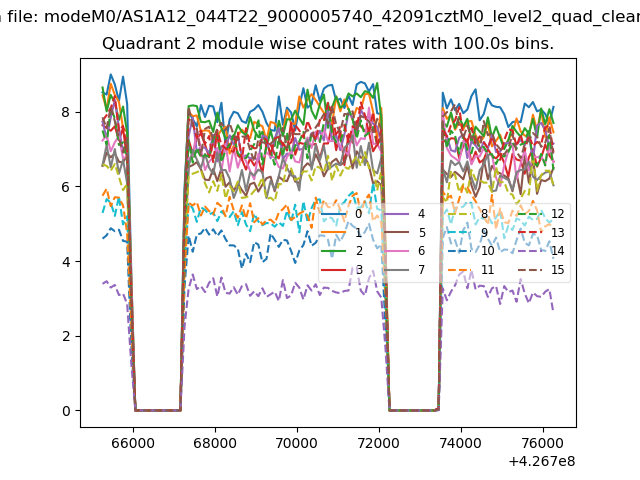
| Module-wise count rates for Quadrant B Data is divided into 100 sec bins |
 |
 |
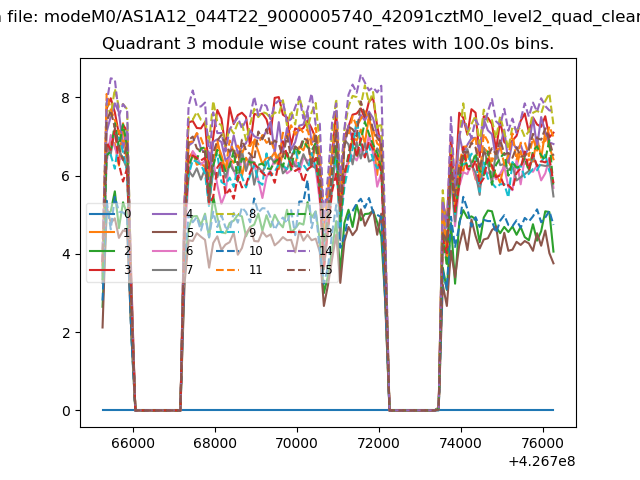
| Module-wise count rates for Quadrant C Data is divided into 100 sec bins |
 |
 |
| Module-wise count rates for Quadrant D Data is divided into 100 sec bins |
 |
 |
| Parameter | Plot |
|---|---|
| CZT HV Monitor | 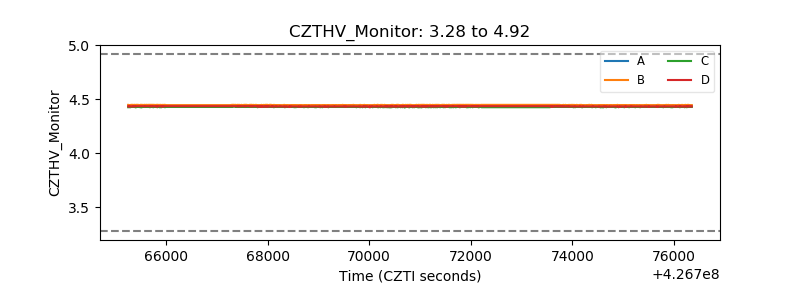 |
| D_VDD |  |
| Temperature 1 |  |
| Veto HV Monitor | 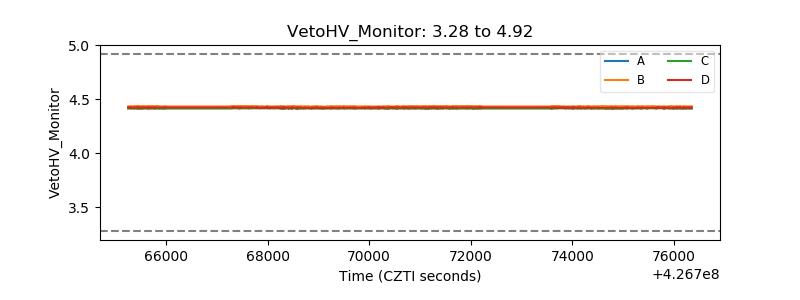 |
| Veto LLD | 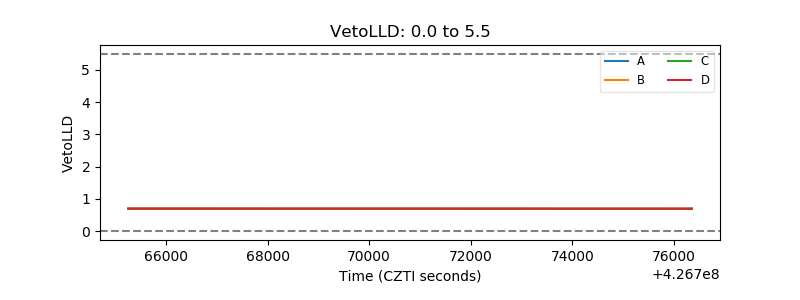 |
| Alpha Counter | 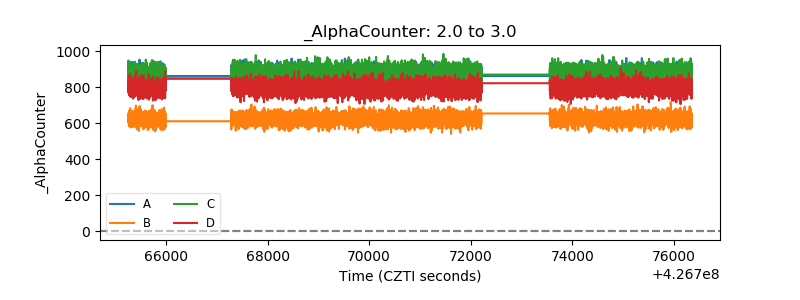 |
| _CPM_Rate | 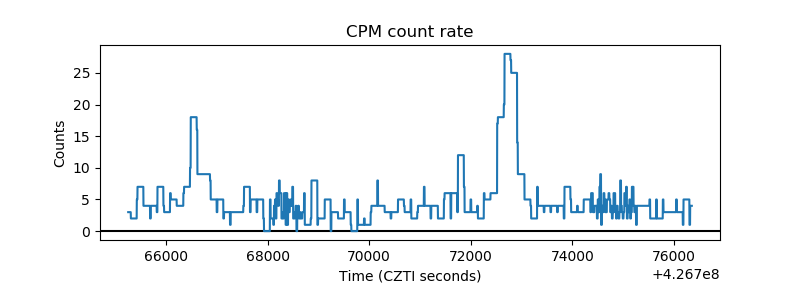 |
| CZT Counter | 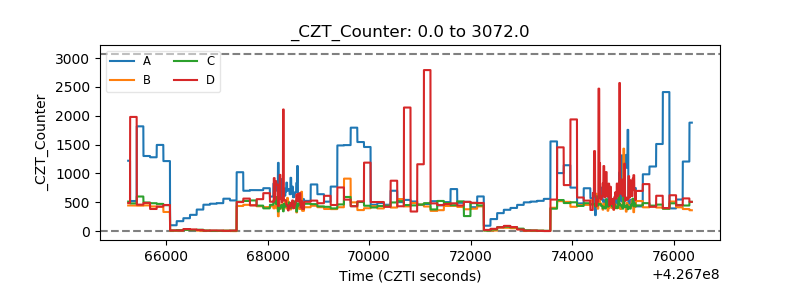 |
| +2.5 Volts monitor | 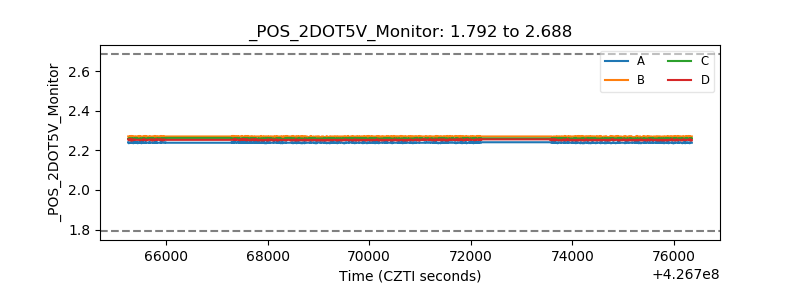 |
| +5 Volts monitor | 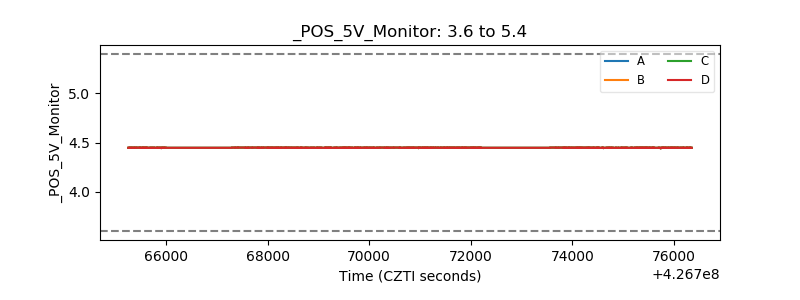 |
| _ROLL_ROT |  |
| _Roll_DEC | 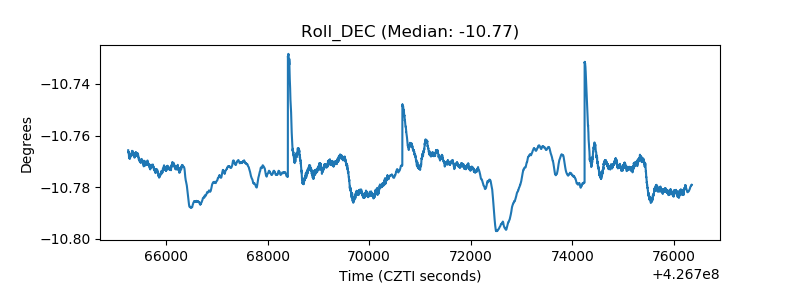 |
| _Roll_RA |  |
| Veto Counter | 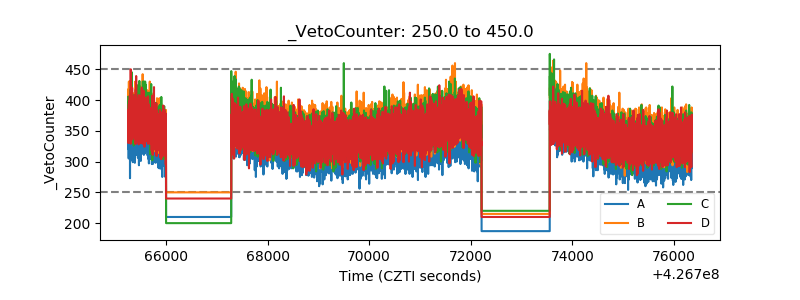 |