| Param | Original file | Final file |
|---|---|---|
| Filename | modeM0/AS1A12_088T01_9000005742_42091cztM0_level2.fits | modeM0/AS1A12_088T01_9000005742_42091cztM0_level2_quad_clean.evt |
| Size (bytes) | 108,008,640 | 26,562,240 |
| Size | 103.0 MB | 25.3 MB |
| Events in quadrant A | 1,198,329 | 174,361 |
| Events in quadrant B | 756,269 | 185,868 |
| Events in quadrant C | 799,098 | 174,899 |
| Events in quadrant D | 1,118,037 | 152,135 |
| Mode M0 | |||
|---|---|---|---|
| Quadrant | BADHDUFLAG | Total packets | Discarded packets |
| A | 0 | 4655 | 4 |
| B | 0 | 3232 | 1 |
| C | 0 | 3215 | 1 |
| D | 0 | 4351 | 1 |
| Mode SS | |||
|---|---|---|---|
| Quadrant | BADHDUFLAG | Total packets | Discarded packets |
| A | 0 | 34 | 0 |
| B | 0 | 34 | 0 |
| C | 0 | 34 | 0 |
| D | 0 | 34 | 0 |
| Mode M9 | |||
|---|---|---|---|
| Quadrant | BADHDUFLAG | Total packets | Discarded packets |
| A | 0 | 15 | 0 |
| B | 0 | 15 | 0 |
| C | 0 | 15 | 0 |
| D | 0 | 15 | 0 |
| Quadrant | Total seconds | Saturated seconds | Saturation percentage |
|---|---|---|---|
| A | 1588 | 62 | 3.904282% |
| B | 1588 | 3 | 0.188917% |
| C | 1588 | 1 | 0.062972% |
| D | 1588 | 115 | 7.241814% |
Noise dominated data is calculated using 1-second bins in cleaned event files. If a bin has >2000 counts, and if more than 50% of those come from <1% of pixels, then it is considered to be noise-dominated and hence unusable.
| Quadrant | # 1 sec bins | Bins with >0 counts | Bins with >2000 counts | High rate bins dominated by noise | Noise dominated (total time) | Noise dominated (detector-on time) | Marked lightcurve |
|---|---|---|---|---|---|---|---|
| A | 3022 | 1589 | 33 | 33 | 1.09% | 2.08% | 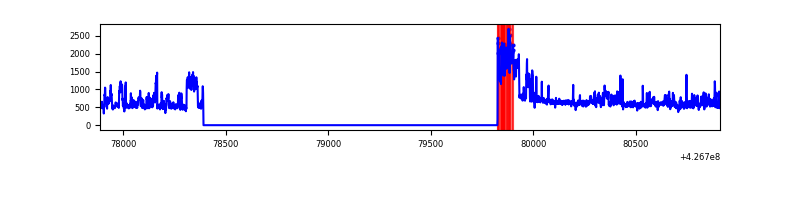 |
| B | 3022 | 1589 | 0 | 0 | 0.00% | 0.00% | 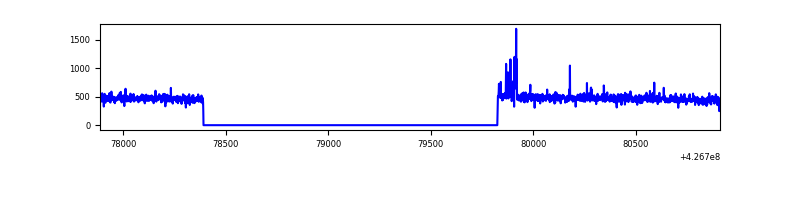 |
| C | 3022 | 1589 | 0 | 0 | 0.00% | 0.00% | 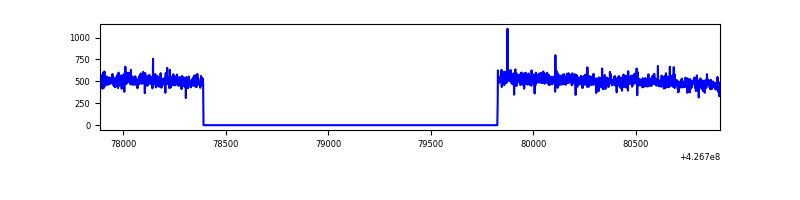 |
| D | 3022 | 1589 | 88 | 88 | 2.91% | 5.54% | 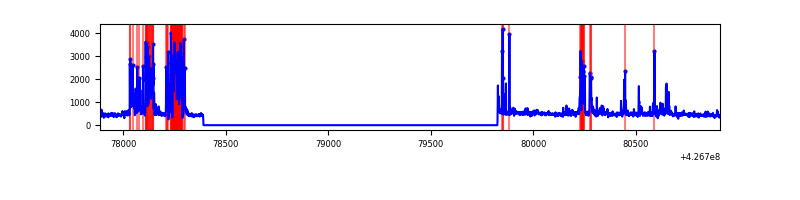 |
Top three noisy pixels from each quadrant. If the there are fewer than three noisy pixels in the level2.evt file, extra rows are filled as -1
| Pixel properties | Quadrant properties | ||||||
|---|---|---|---|---|---|---|---|
| Quadrant | DetID | PixID | Counts | Sigma | Mean | Median | Sigma |
| A | 15 | 222 | 246294 | 5966.72 | 189 | 185 | 41.2 |
| A | 10 | 83 | 194088 | 4701.03 | 189 | 185 | 41.2 |
| A | 15 | 223 | 15165 | 363.18 | 189 | 185 | 41.2 |
| B | 5 | 255 | 15367 | 383.58 | 187 | 182 | 39.6 |
| B | 12 | 111 | 4696 | 114.03 | 187 | 182 | 39.6 |
| B | 11 | 111 | 4543 | 110.16 | 187 | 182 | 39.6 |
| C | 15 | 214 | 69265 | 1533.75 | 186 | 187 | 45.0 |
| C | 12 | 249 | 2021 | 40.72 | 186 | 187 | 45.0 |
| C | 8 | 79 | 1854 | 37.01 | 186 | 187 | 45.0 |
| D | 12 | 6 | 268438 | 5950.97 | 181 | 176 | 45.1 |
| D | 13 | 112 | 49686 | 1098.3 | 181 | 176 | 45.1 |
| D | 1 | 52 | 28282 | 623.49 | 181 | 176 | 45.1 |
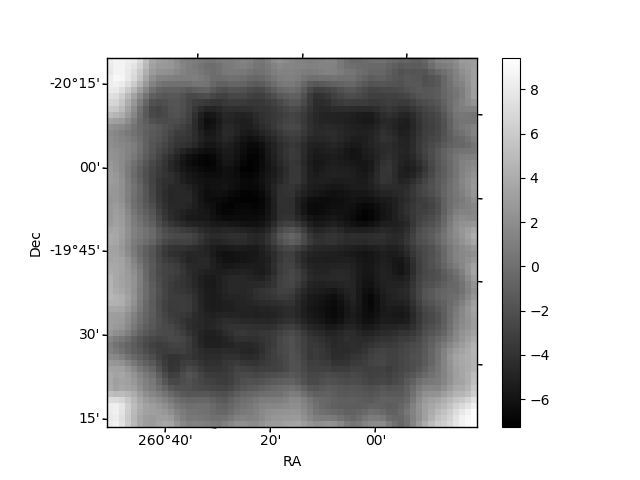
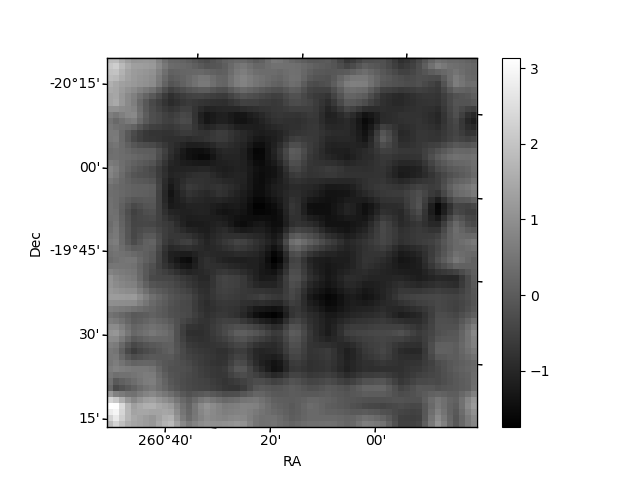
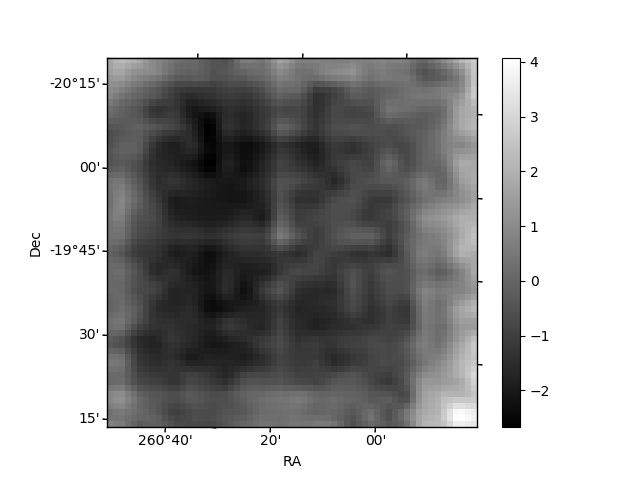
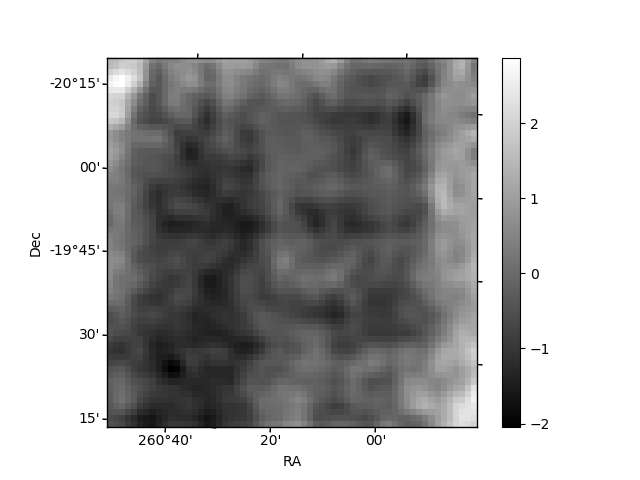
Histogram calculated using DETX and DETY for each event in the final _common_clean file
| Quadrant A | 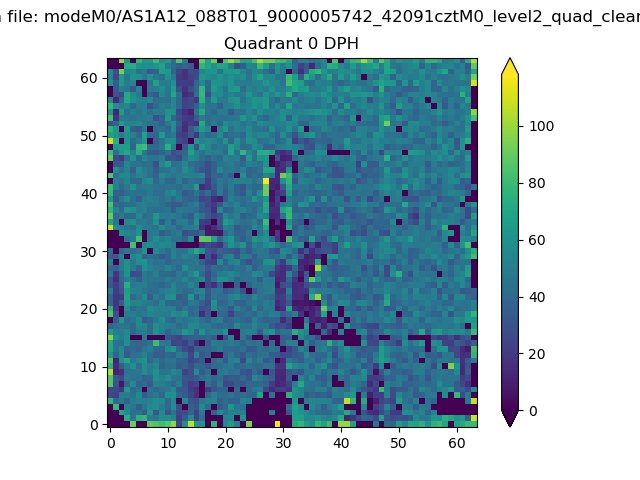 |
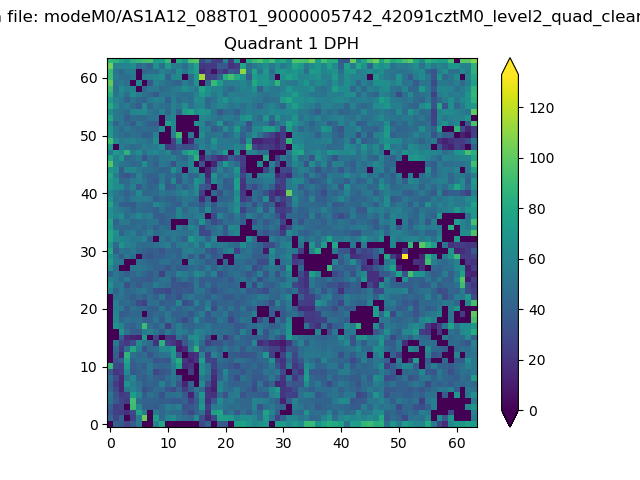 |
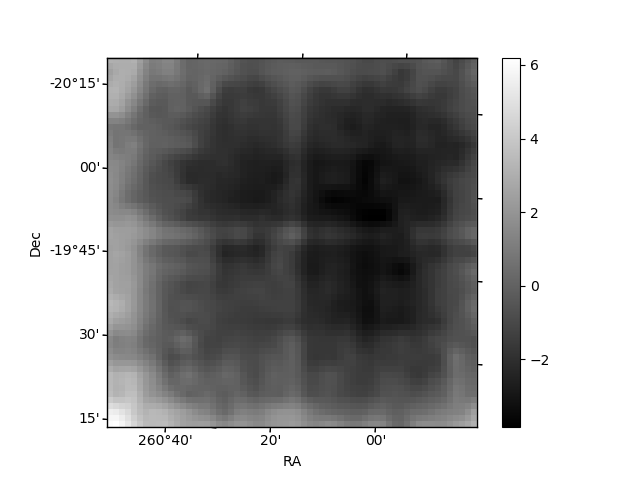
Quadrant B |
|---|---|---|---|
| Quadrant D | 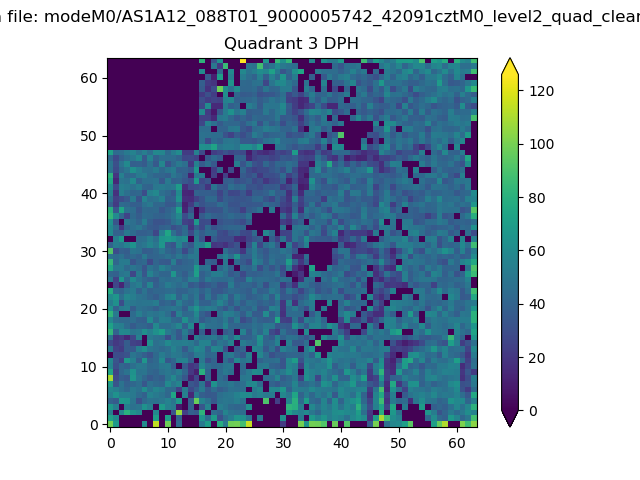 |
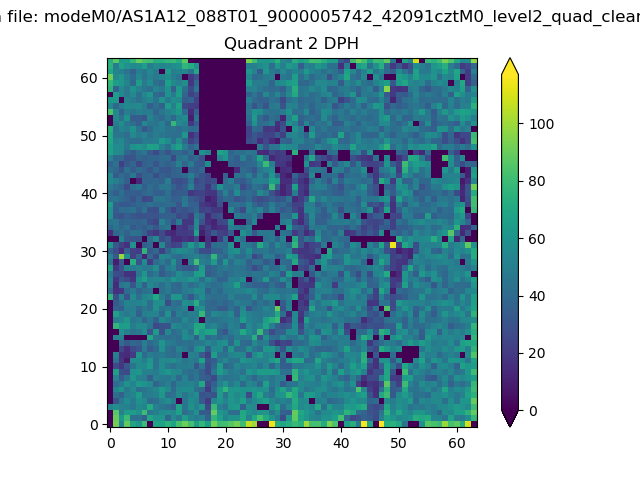 |
Quadrant C |
| Plot type | Count rate plots | Images |
|---|---|---|
| Comparison with Poisson distribution Blue bars denote a histogram of data divided into 1 sec bins. Red curve is a Poisson curve with rate = median count rate of data. |
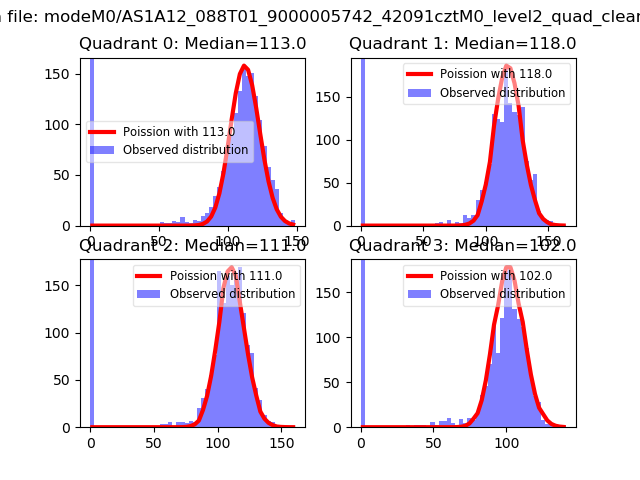 |
 |
| Quadrant-wise count rates Data is divided into 100 sec bins |
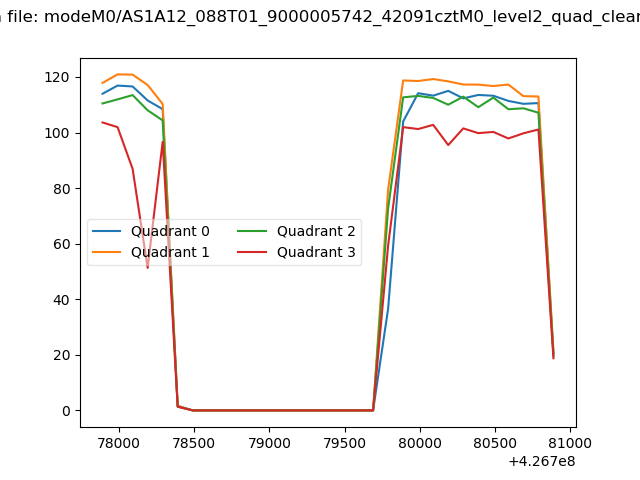 |
|
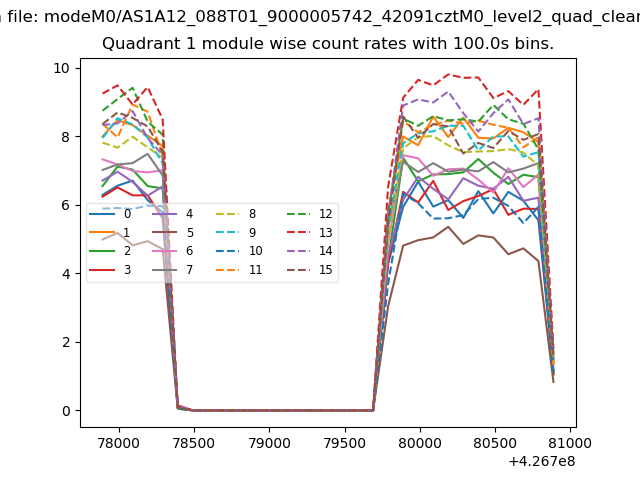
| Module-wise count rates for Quadrant A Data is divided into 100 sec bins |
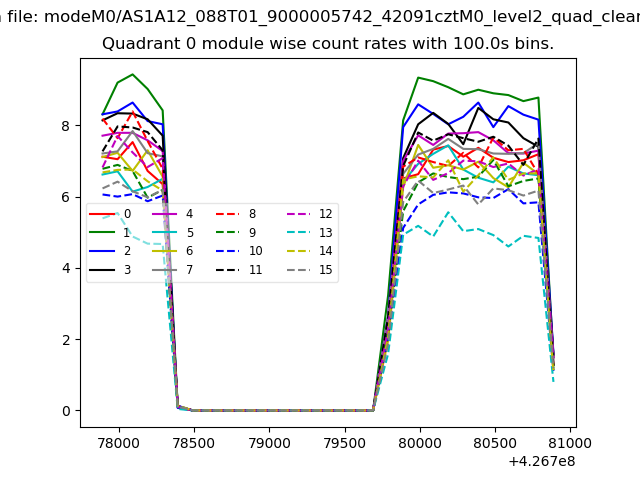 |
 |
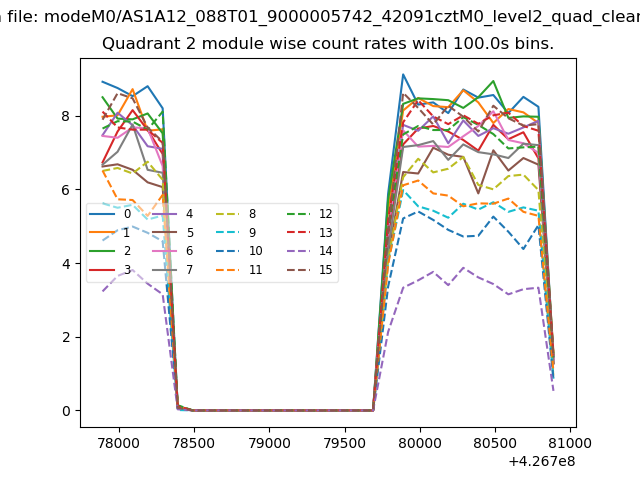
| Module-wise count rates for Quadrant B Data is divided into 100 sec bins |
 |
 |
| Module-wise count rates for Quadrant C Data is divided into 100 sec bins |
 |
 |
| Module-wise count rates for Quadrant D Data is divided into 100 sec bins |
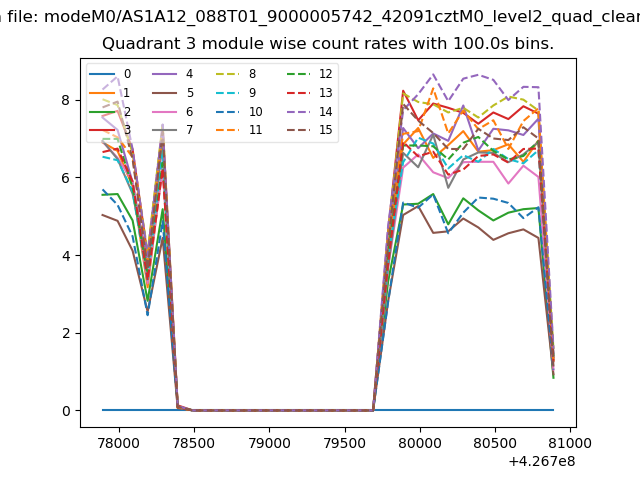 |
 |
| Parameter | Plot |
|---|---|
| CZT HV Monitor | 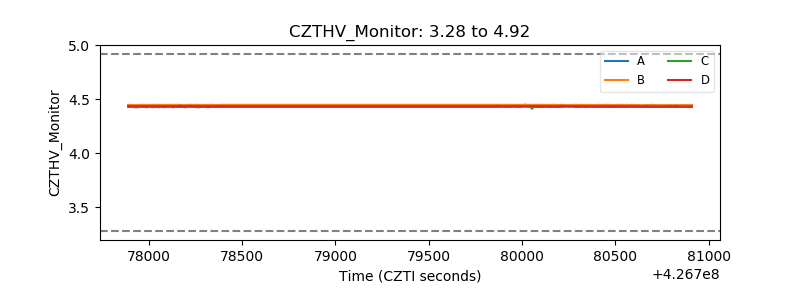 |
| D_VDD | 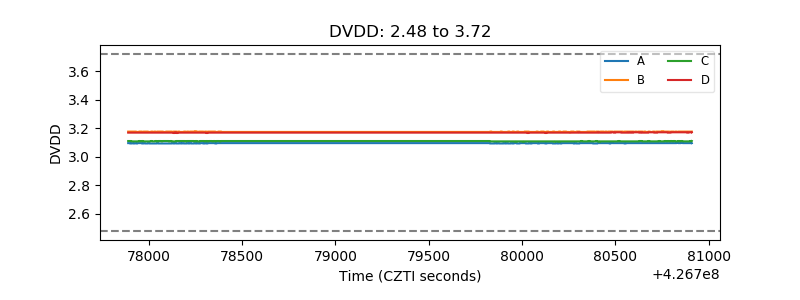 |
| Temperature 1 | 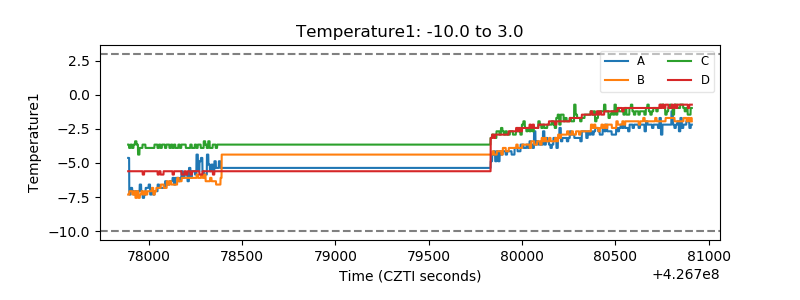 |
| Veto HV Monitor | 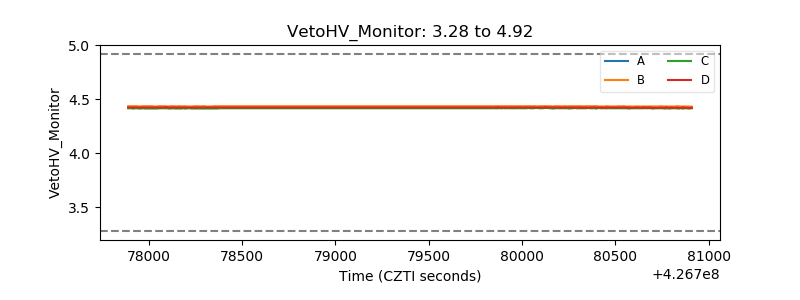 |
| Veto LLD |  |
| Alpha Counter | 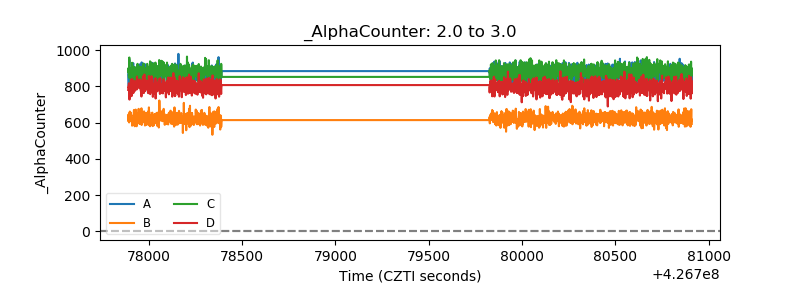 |
| _CPM_Rate | 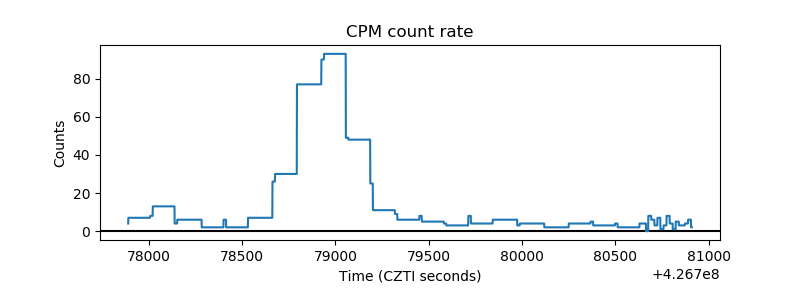 |
| CZT Counter | 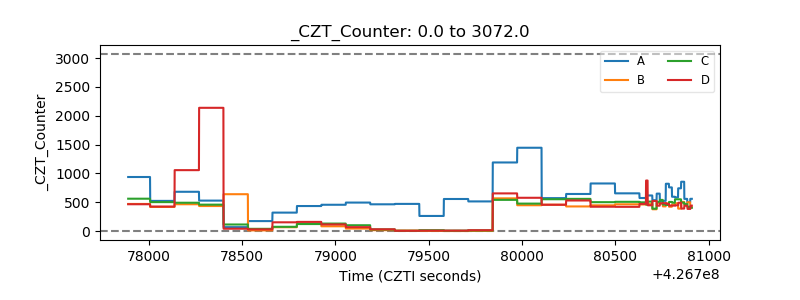 |
| +2.5 Volts monitor | 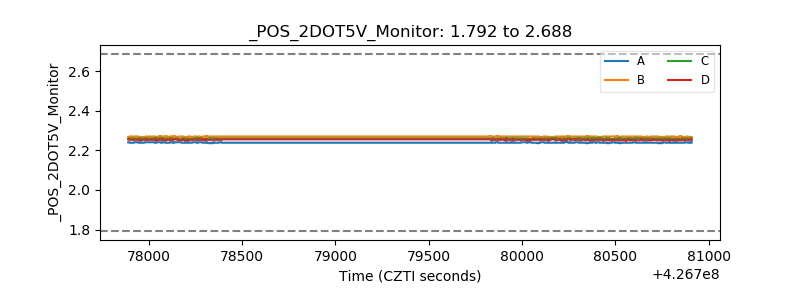 |
| +5 Volts monitor | 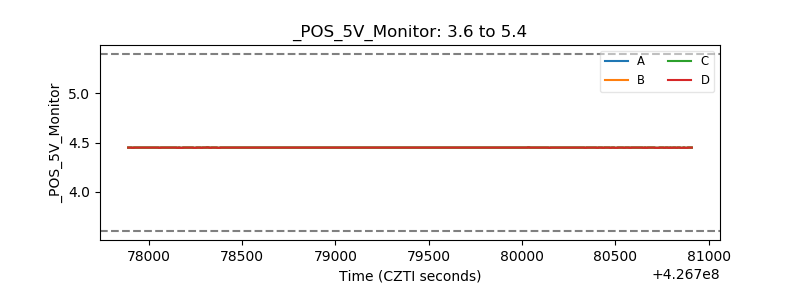 |
| _ROLL_ROT |  |
| _Roll_DEC | 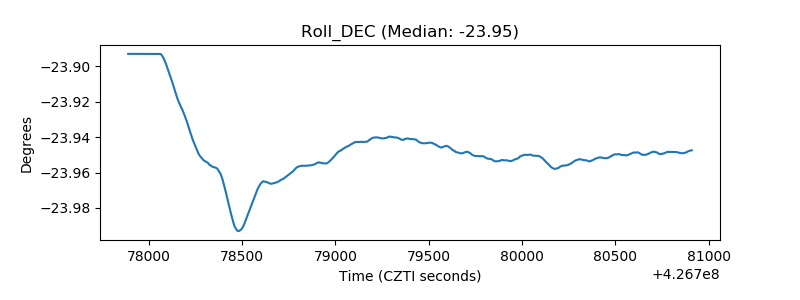 |
| _Roll_RA | 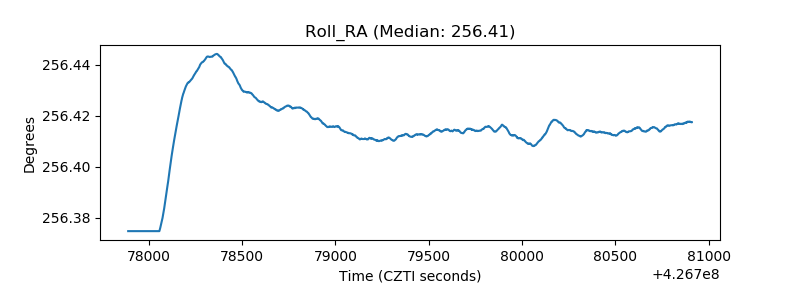 |
| Veto Counter | 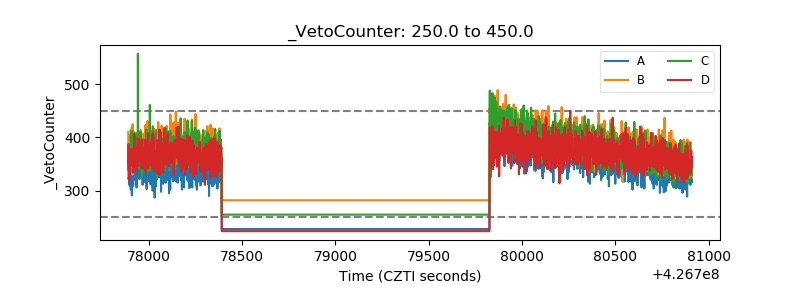 |