| Param | Original file | Final file |
|---|---|---|
| Filename | modeM0/AS1A12_088T01_9000005742_42092cztM0_level2.fits | modeM0/AS1A12_088T01_9000005742_42092cztM0_level2_quad_clean.evt |
| Size (bytes) | 210,018,240 | 56,998,080 |
| Size | 200.3 MB | 54.4 MB |
| Events in quadrant A | 2,305,934 | 380,578 |
| Events in quadrant B | 1,487,154 | 388,393 |
| Events in quadrant C | 1,555,133 | 370,845 |
| Events in quadrant D | 2,151,426 | 337,850 |
| Mode M0 | |||
|---|---|---|---|
| Quadrant | BADHDUFLAG | Total packets | Discarded packets |
| A | 0 | 9252 | 0 |
| B | 0 | 7077 | 0 |
| C | 0 | 7031 | 0 |
| D | 0 | 8868 | 0 |
| Mode SS | |||
|---|---|---|---|
| Quadrant | BADHDUFLAG | Total packets | Discarded packets |
| A | 0 | 70 | 0 |
| B | 0 | 70 | 0 |
| C | 0 | 70 | 0 |
| D | 0 | 70 | 0 |
| Quadrant | Total seconds | Saturated seconds | Saturation percentage |
|---|---|---|---|
| A | 3505 | 10 | 0.285307% |
| B | 3506 | 2 | 0.057045% |
| C | 3506 | 0 | 0.000000% |
| D | 3506 | 87 | 2.481460% |
Noise dominated data is calculated using 1-second bins in cleaned event files. If a bin has >2000 counts, and if more than 50% of those come from <1% of pixels, then it is considered to be noise-dominated and hence unusable.
| Quadrant | # 1 sec bins | Bins with >0 counts | Bins with >2000 counts | High rate bins dominated by noise | Noise dominated (total time) | Noise dominated (detector-on time) | Marked lightcurve |
|---|---|---|---|---|---|---|---|
| A | 3505 | 3505 | 0 | 0 | 0.00% | 0.00% | 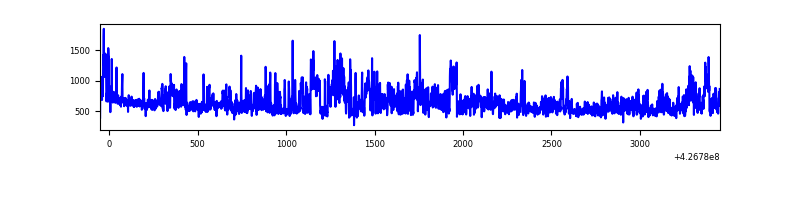 |
| B | 3506 | 3506 | 2 | 2 | 0.06% | 0.06% | 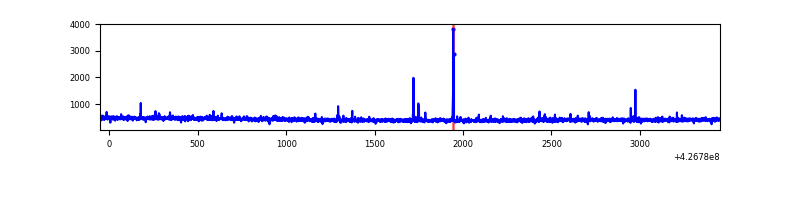 |
| C | 3506 | 3506 | 0 | 0 | 0.00% | 0.00% | 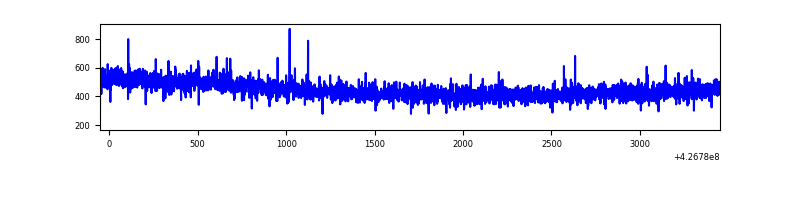 |
| D | 3506 | 3506 | 99 | 99 | 2.82% | 2.82% | 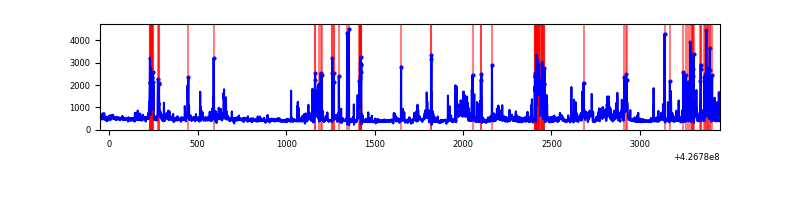 |
Top three noisy pixels from each quadrant. If the there are fewer than three noisy pixels in the level2.evt file, extra rows are filled as -1
| Pixel properties | Quadrant properties | ||||||
|---|---|---|---|---|---|---|---|
| Quadrant | DetID | PixID | Counts | Sigma | Mean | Median | Sigma |
| A | 15 | 222 | 443410 | 5539.11 | 376 | 367 | 80.0 |
| A | 10 | 83 | 285763 | 3568.14 | 376 | 367 | 80.0 |
| A | 15 | 223 | 90669 | 1128.99 | 376 | 367 | 80.0 |
| B | 5 | 255 | 26237 | 346.71 | 370 | 359 | 74.6 |
| B | 12 | 111 | 9008 | 115.88 | 370 | 359 | 74.6 |
| B | 11 | 111 | 8376 | 107.41 | 370 | 359 | 74.6 |
| C | 15 | 214 | 143585 | 1662.42 | 361 | 363 | 86.2 |
| C | 12 | 249 | 3985 | 42.04 | 361 | 363 | 86.2 |
| C | 13 | 61 | 2423 | 23.91 | 361 | 363 | 86.2 |
| D | 1 | 52 | 354095 | 3951.55 | 361 | 352 | 89.5 |
| D | 10 | 199 | 160849 | 1792.86 | 361 | 352 | 89.5 |
| D | 12 | 6 | 133486 | 1487.2 | 361 | 352 | 89.5 |
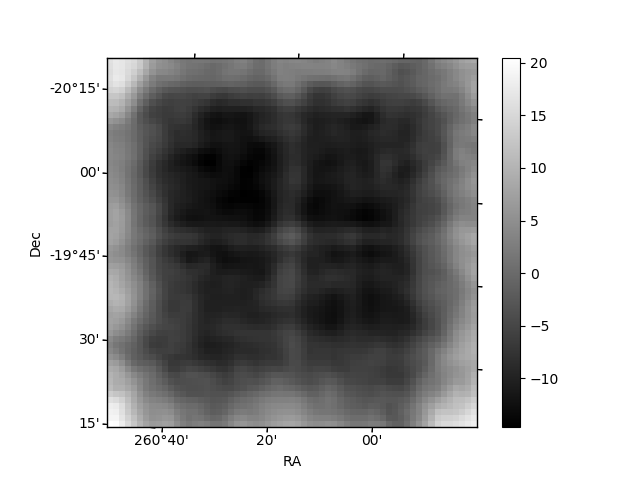
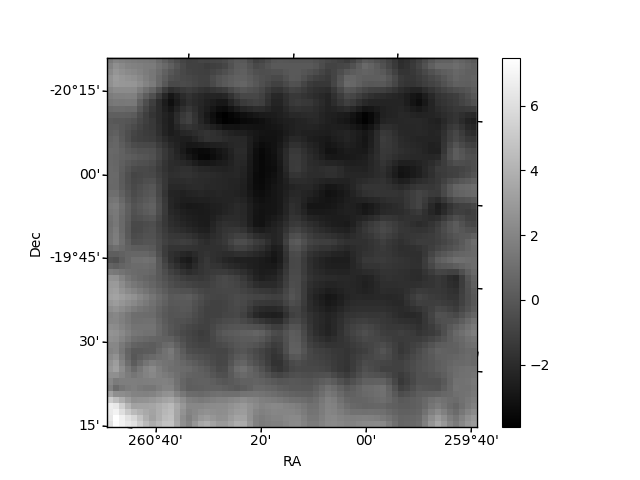
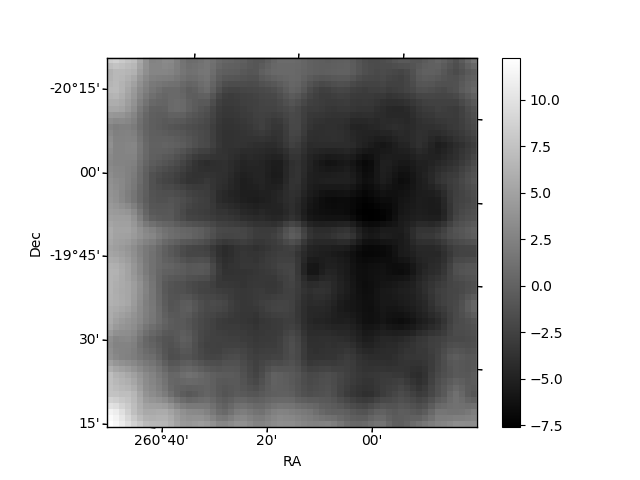
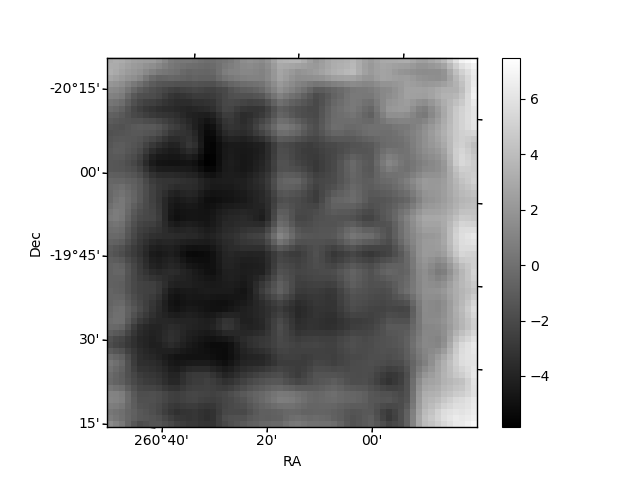
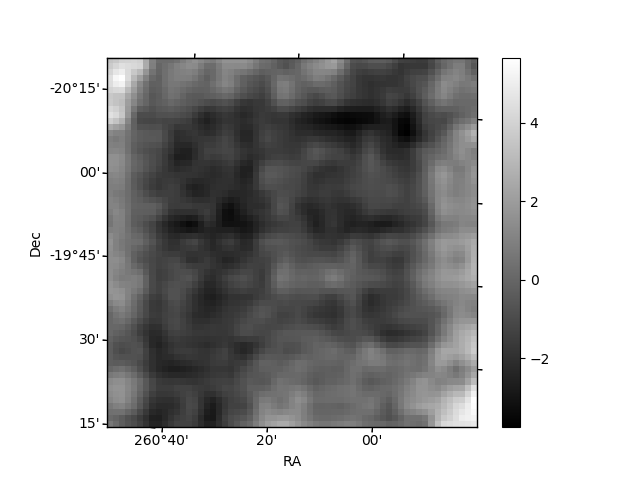
Histogram calculated using DETX and DETY for each event in the final _common_clean file
| Quadrant A | 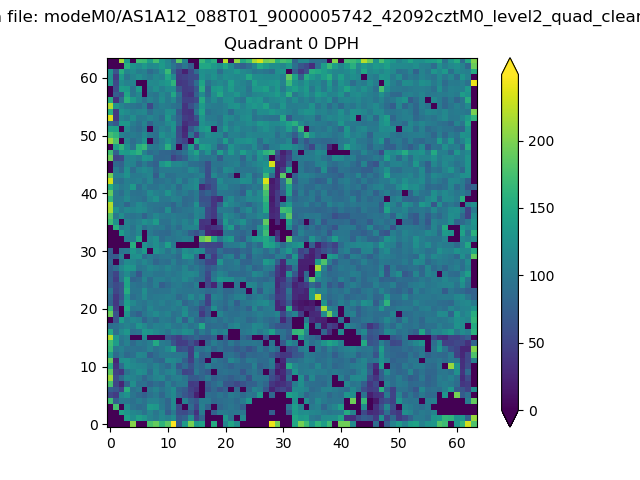 |
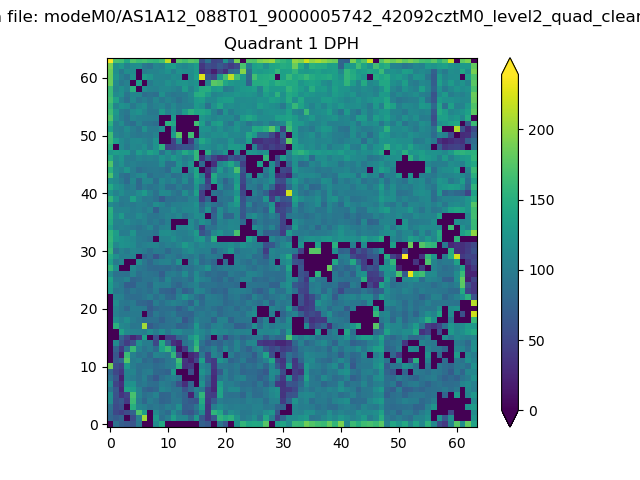 |
Quadrant B |
|---|---|---|---|
| Quadrant D | 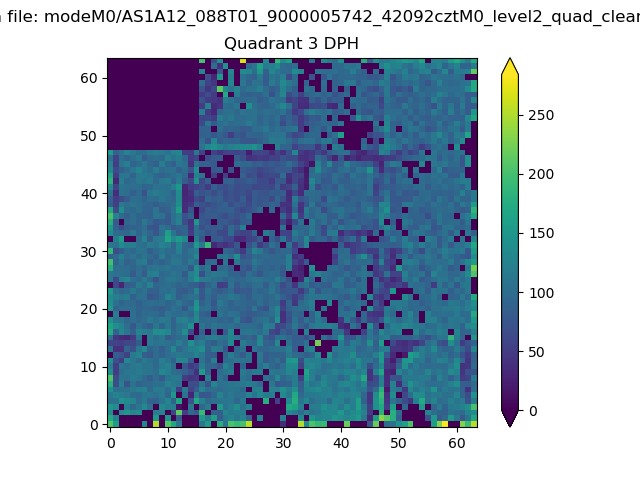 |
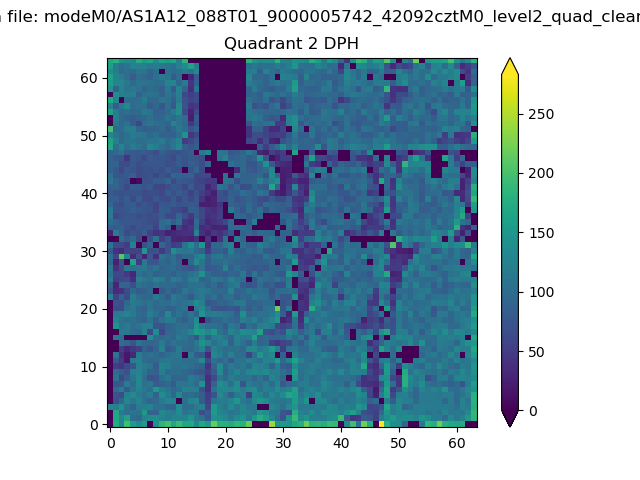 |
Quadrant C |
| Plot type | Count rate plots | Images |
|---|---|---|
| Comparison with Poisson distribution Blue bars denote a histogram of data divided into 1 sec bins. Red curve is a Poisson curve with rate = median count rate of data. |
 |
 |
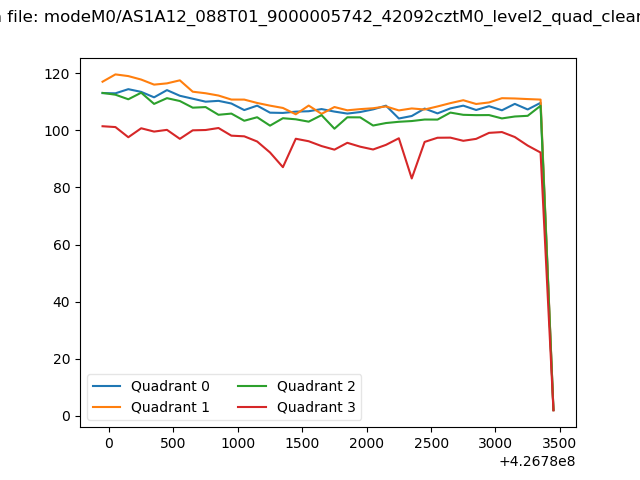
| Quadrant-wise count rates Data is divided into 100 sec bins |
 |
|
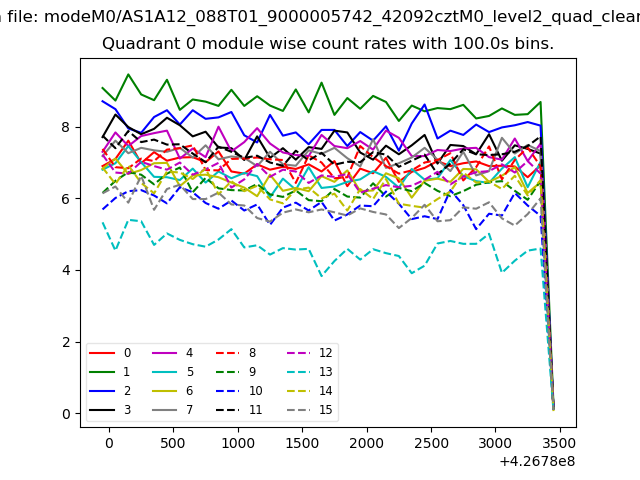
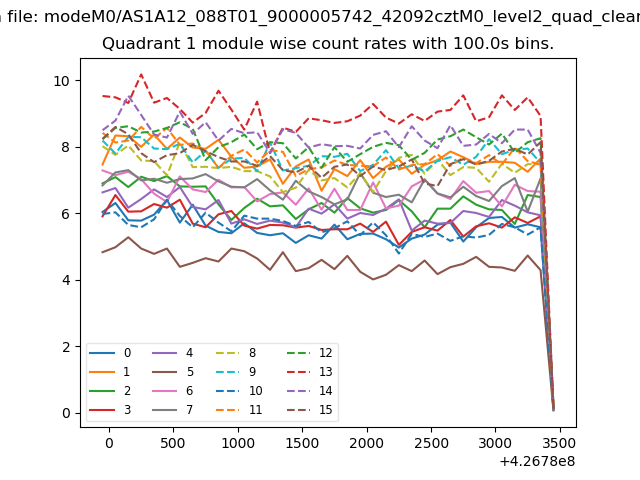
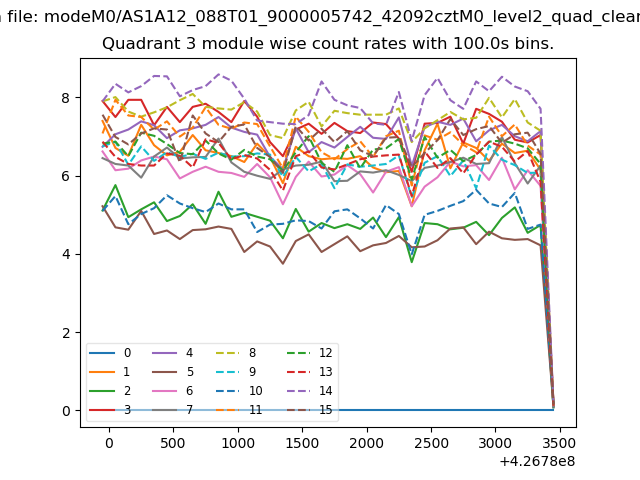
| Module-wise count rates for Quadrant A Data is divided into 100 sec bins |
 |
 |
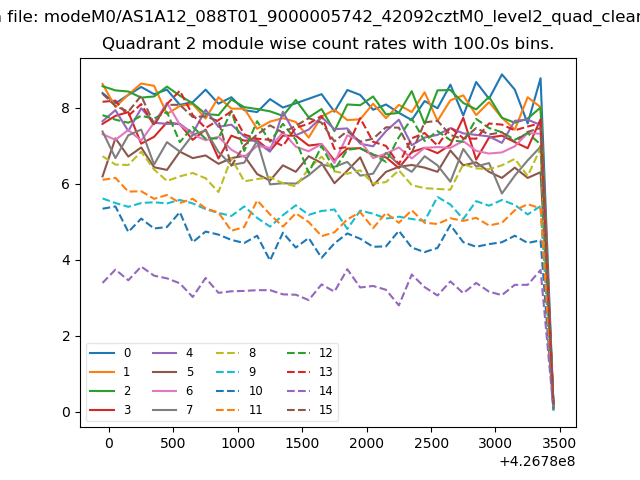
| Module-wise count rates for Quadrant B Data is divided into 100 sec bins |
 |
 |
| Module-wise count rates for Quadrant C Data is divided into 100 sec bins |
 |
 |
| Module-wise count rates for Quadrant D Data is divided into 100 sec bins |
 |
 |
| Parameter | Plot |
|---|---|
| CZT HV Monitor | 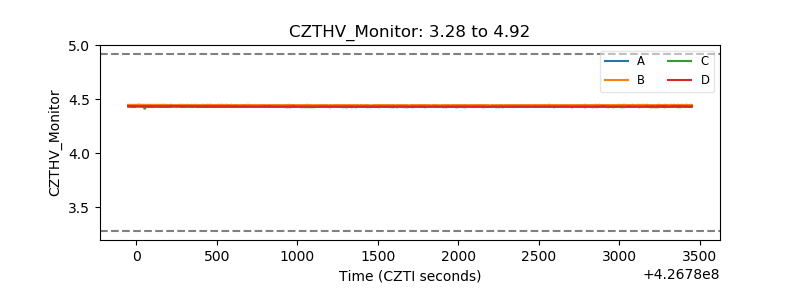 |
| D_VDD | 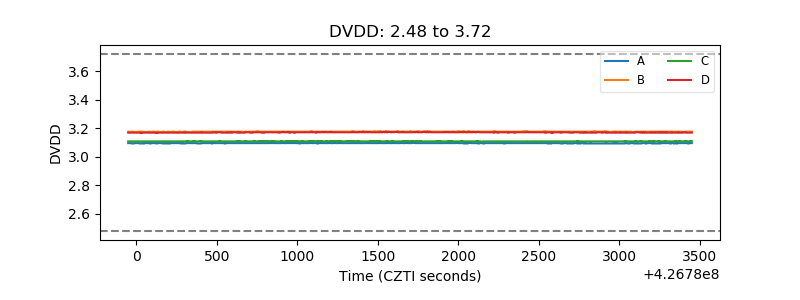 |
| Temperature 1 | 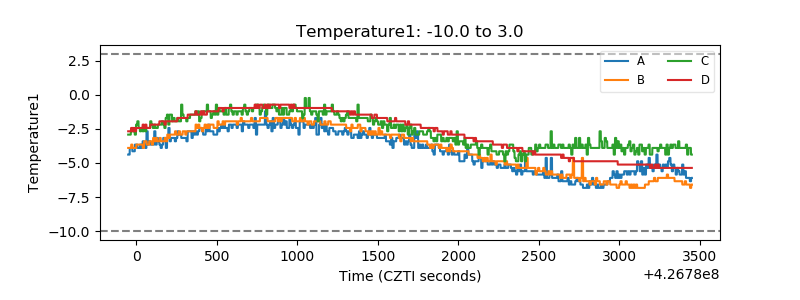 |
| Veto HV Monitor | 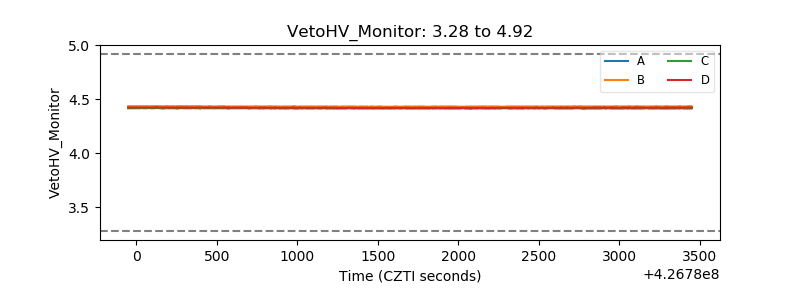 |
| Veto LLD | 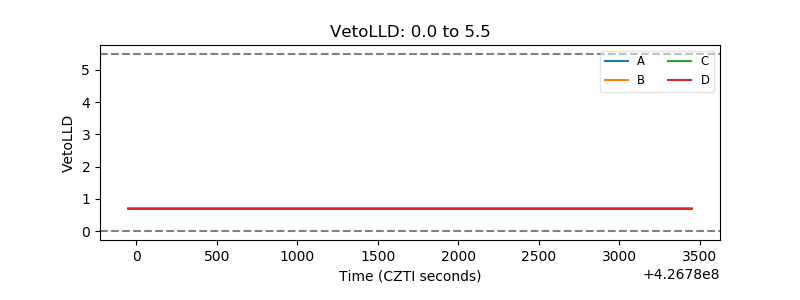 |
| Alpha Counter | 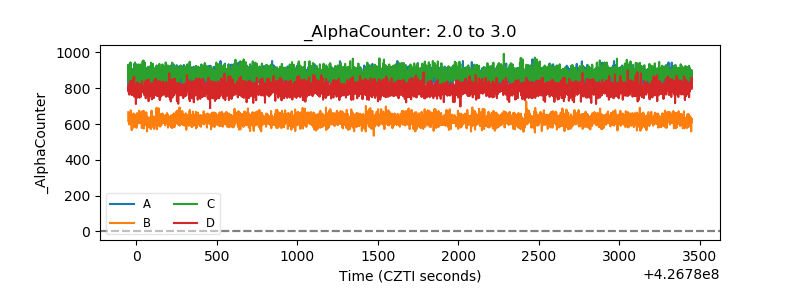 |
| _CPM_Rate | 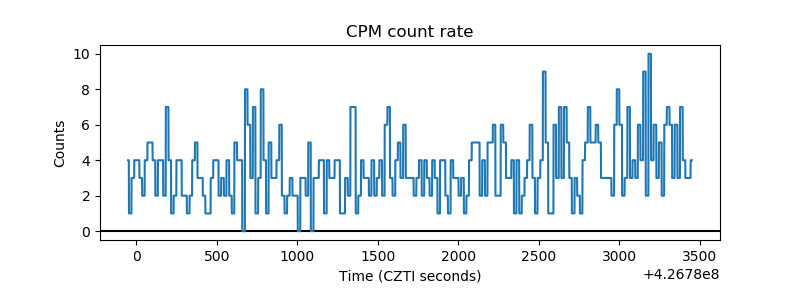 |
| CZT Counter | 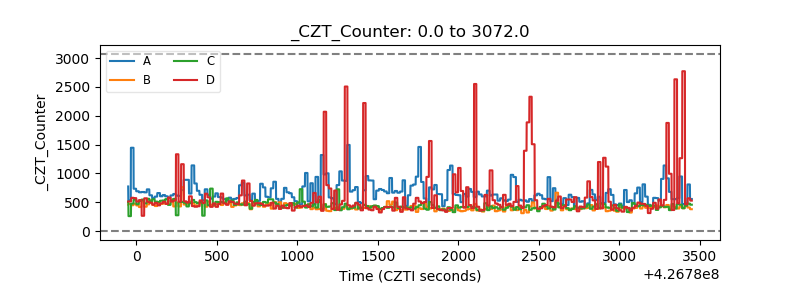 |
| +2.5 Volts monitor |  |
| +5 Volts monitor |  |
| _ROLL_ROT | 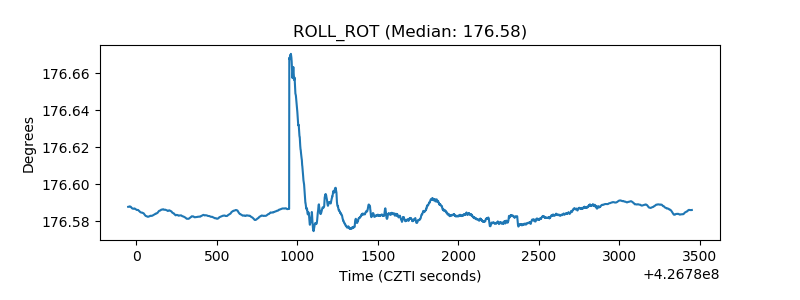 |
| _Roll_DEC | 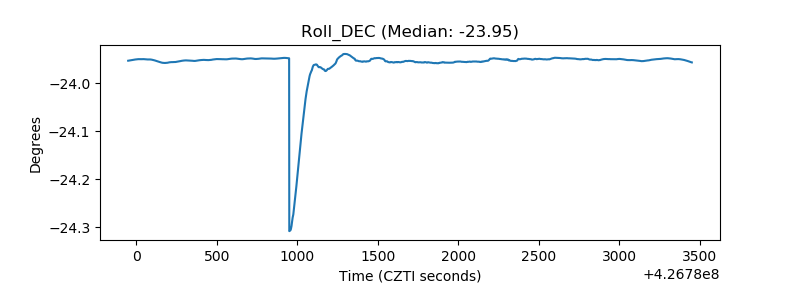 |
| _Roll_RA | 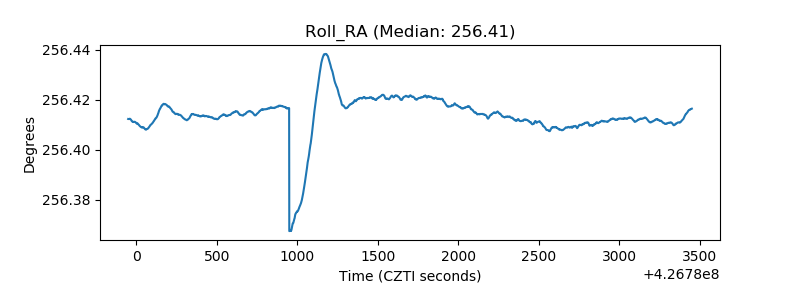 |
| Veto Counter | 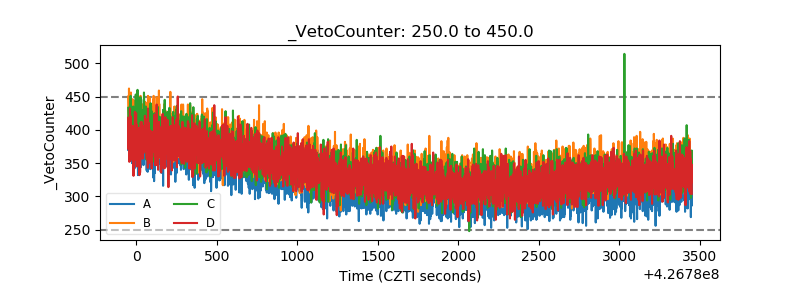 |