| Param | Original file | Final file |
|---|---|---|
| Filename | modeM0/AS1A12_088T02_9000005744_42092cztM0_level2.fits | modeM0/AS1A12_088T02_9000005744_42092cztM0_level2_quad_clean.evt |
| Size (bytes) | 127,264,320 | 31,092,480 |
| Size | 121.4 MB | 29.7 MB |
| Events in quadrant A | 1,743,144 | 204,249 |
| Events in quadrant B | 868,376 | 214,772 |
| Events in quadrant C | 928,181 | 202,153 |
| Events in quadrant D | 1,026,824 | 186,711 |
| Mode SS | |||
|---|---|---|---|
| Quadrant | BADHDUFLAG | Total packets | Discarded packets |
| A | 0 | 40 | 0 |
| B | 0 | 40 | 0 |
| C | 0 | 40 | 0 |
| D | 0 | 40 | 0 |
| Mode M9 | |||
|---|---|---|---|
| Quadrant | BADHDUFLAG | Total packets | Discarded packets |
| A | 0 | 15 | 0 |
| B | 0 | 15 | 0 |
| C | 0 | 15 | 0 |
| D | 0 | 15 | 0 |
| Mode M0 | |||
|---|---|---|---|
| Quadrant | BADHDUFLAG | Total packets | Discarded packets |
| A | 0 | 6443 | 2 |
| B | 0 | 3708 | 1 |
| C | 0 | 3730 | 1 |
| D | 0 | 4244 | 1 |
| Quadrant | Total seconds | Saturated seconds | Saturation percentage |
|---|---|---|---|
| A | 1824 | 96 | 5.263158% |
| B | 1824 | 2 | 0.109649% |
| C | 1824 | 1 | 0.054825% |
| D | 1824 | 19 | 1.041667% |
Noise dominated data is calculated using 1-second bins in cleaned event files. If a bin has >2000 counts, and if more than 50% of those come from <1% of pixels, then it is considered to be noise-dominated and hence unusable.
| Quadrant | # 1 sec bins | Bins with >0 counts | Bins with >2000 counts | High rate bins dominated by noise | Noise dominated (total time) | Noise dominated (detector-on time) | Marked lightcurve |
|---|---|---|---|---|---|---|---|
| A | 3376 | 1825 | 40 | 40 | 1.18% | 2.19% | 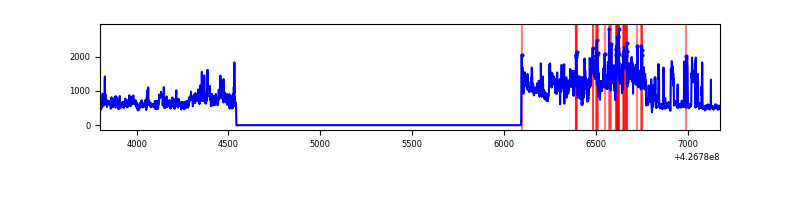 |
| B | 3376 | 1825 | 1 | 1 | 0.03% | 0.05% | 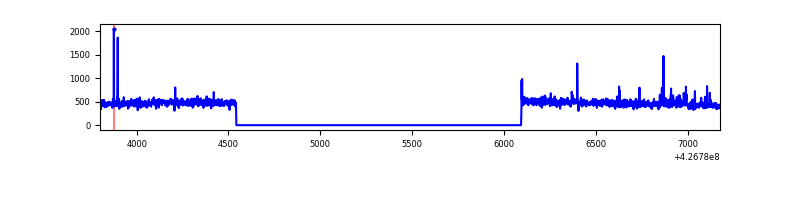 |
| C | 3376 | 1825 | 0 | 0 | 0.00% | 0.00% | 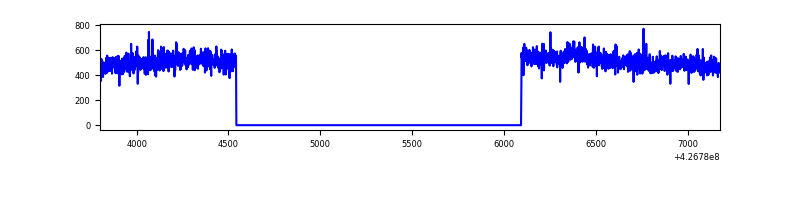 |
| D | 3376 | 1825 | 11 | 11 | 0.33% | 0.60% | 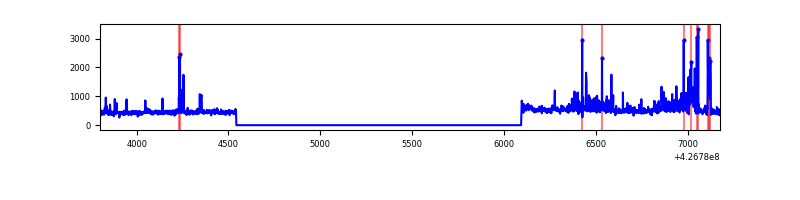 |
Top three noisy pixels from each quadrant. If the there are fewer than three noisy pixels in the level2.evt file, extra rows are filled as -1
| Pixel properties | Quadrant properties | ||||||
|---|---|---|---|---|---|---|---|
| Quadrant | DetID | PixID | Counts | Sigma | Mean | Median | Sigma |
| A | 15 | 222 | 657592 | 14452.4 | 215 | 211 | 45.5 |
| A | 10 | 83 | 219248 | 4815.49 | 215 | 211 | 45.5 |
| A | 15 | 223 | 16869 | 366.22 | 215 | 211 | 45.5 |
| B | 5 | 255 | 17196 | 389.5 | 215 | 209 | 43.6 |
| B | 12 | 111 | 5430 | 119.71 | 215 | 209 | 43.6 |
| B | 11 | 111 | 5117 | 112.54 | 215 | 209 | 43.6 |
| C | 15 | 214 | 78193 | 1530.53 | 211 | 213 | 50.9 |
| C | 8 | 79 | 23147 | 450.13 | 211 | 213 | 50.9 |
| C | 10 | 223 | 1525 | 25.75 | 211 | 213 | 50.9 |
| D | 10 | 199 | 80380 | 1484.29 | 213 | 206 | 54.0 |
| D | 1 | 52 | 46761 | 861.89 | 213 | 206 | 54.0 |
| D | 13 | 249 | 27148 | 498.79 | 213 | 206 | 54.0 |
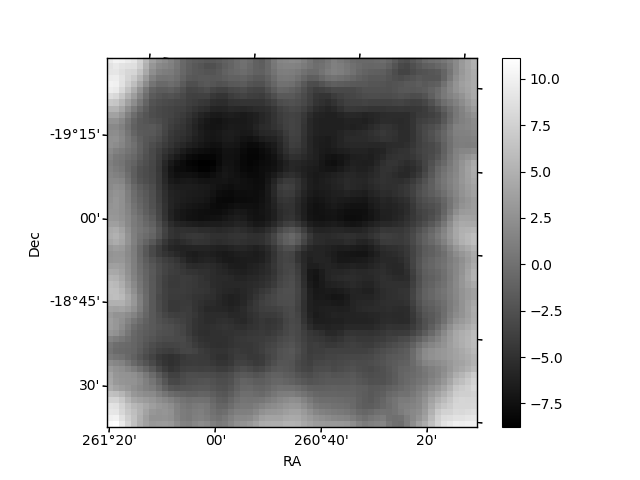
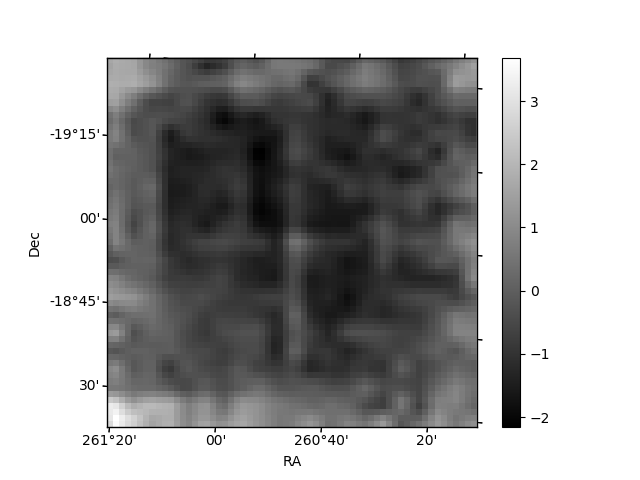
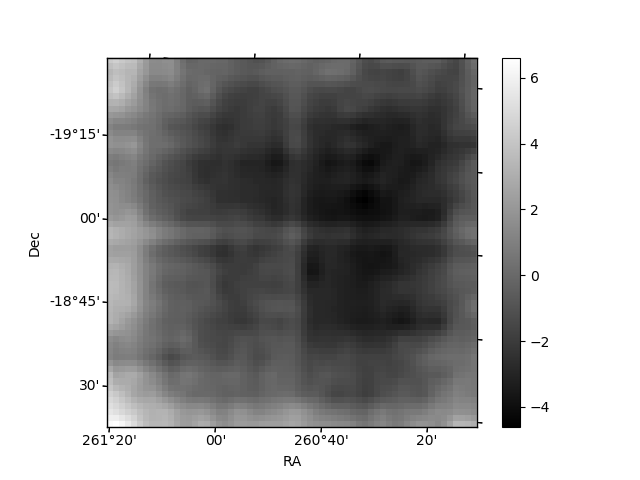
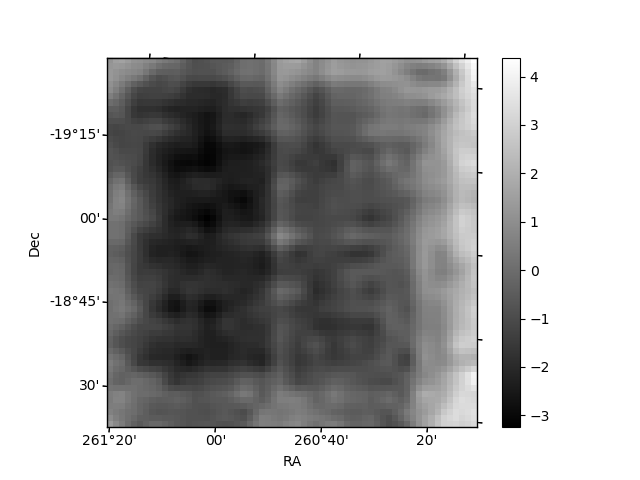
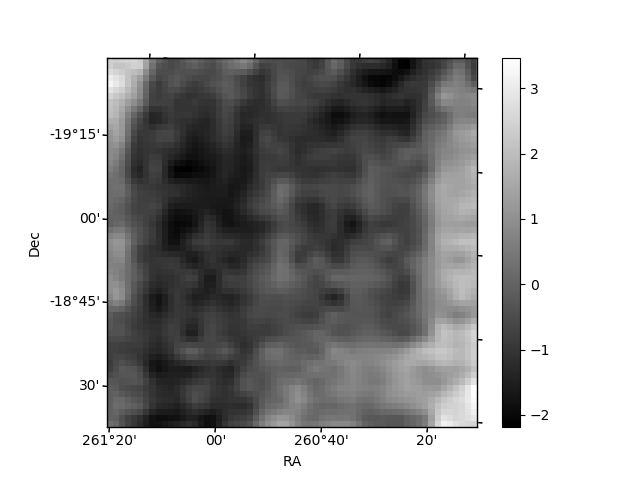
Histogram calculated using DETX and DETY for each event in the final _common_clean file
| Quadrant A | 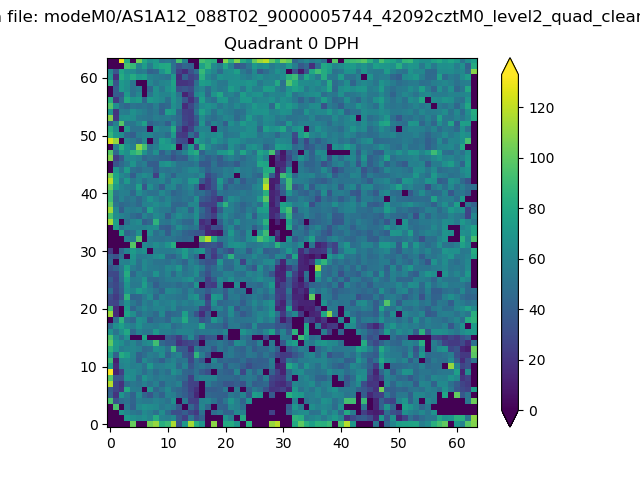 |
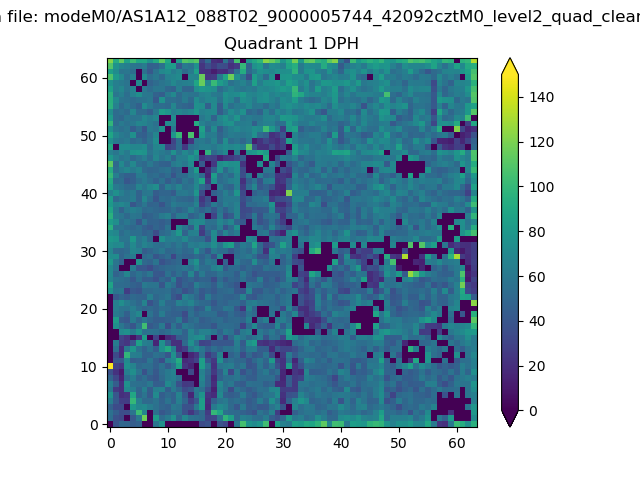 |
Quadrant B |
|---|---|---|---|
| Quadrant D | 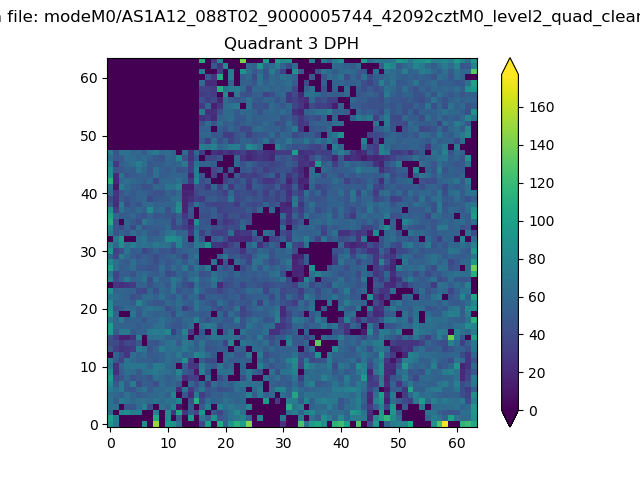 |
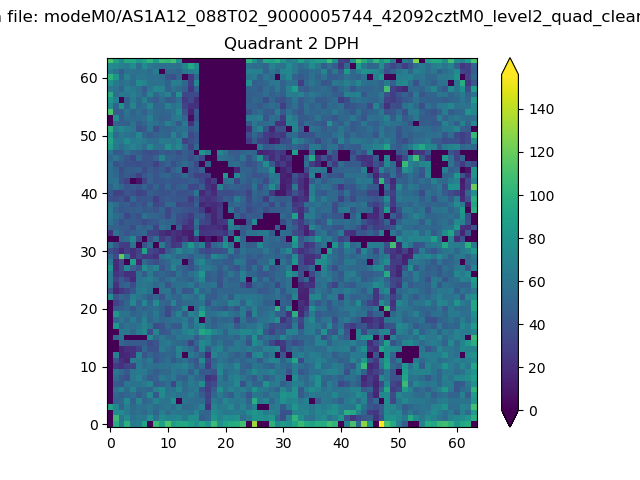 |
Quadrant C |
| Plot type | Count rate plots | Images |
|---|---|---|
| Comparison with Poisson distribution Blue bars denote a histogram of data divided into 1 sec bins. Red curve is a Poisson curve with rate = median count rate of data. |
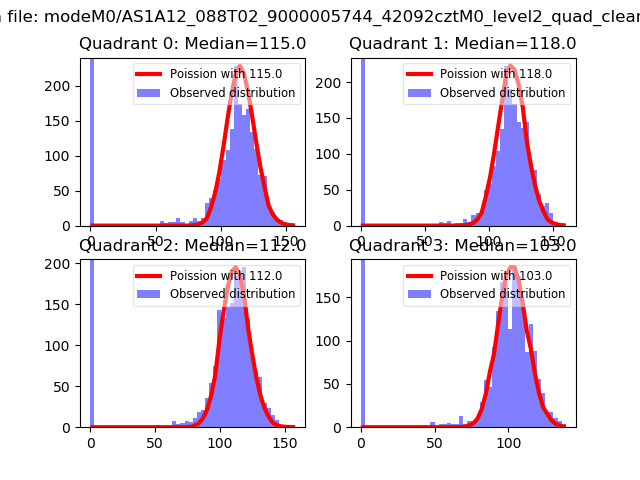 |
 |
| Quadrant-wise count rates Data is divided into 100 sec bins |
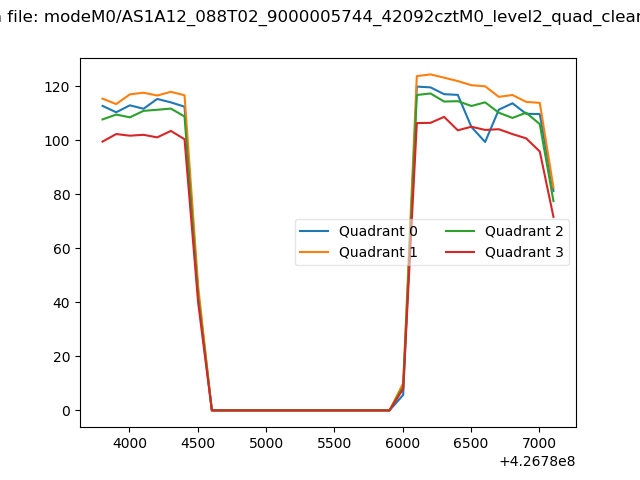 |
|
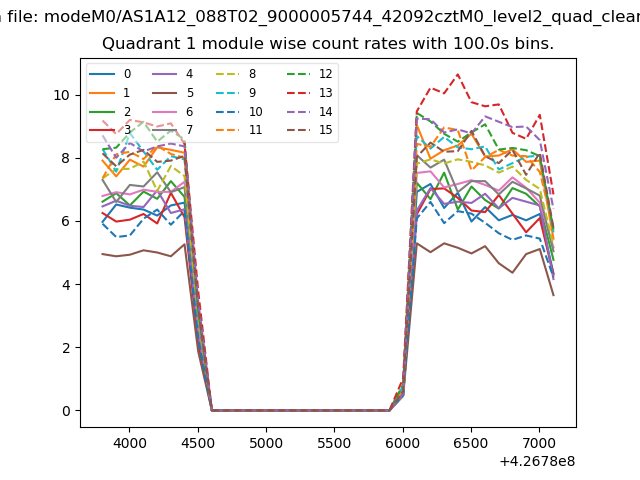
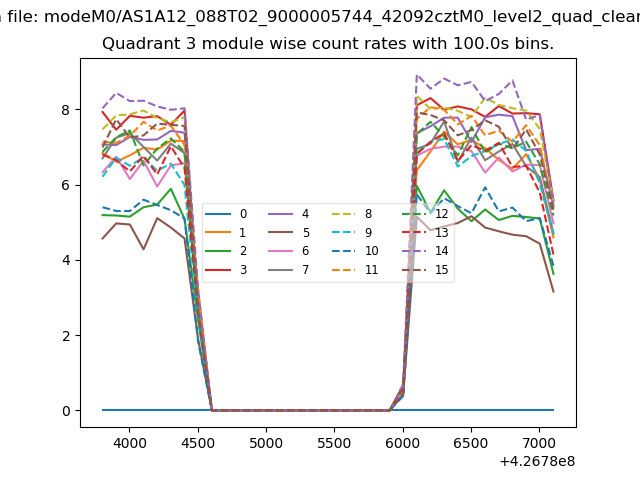
| Module-wise count rates for Quadrant A Data is divided into 100 sec bins |
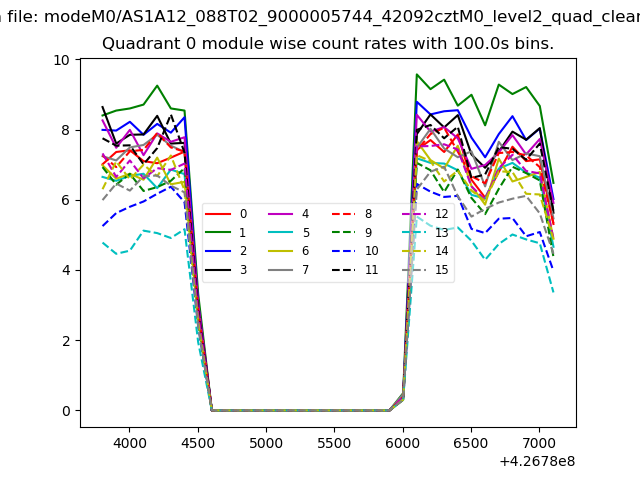 |
 |
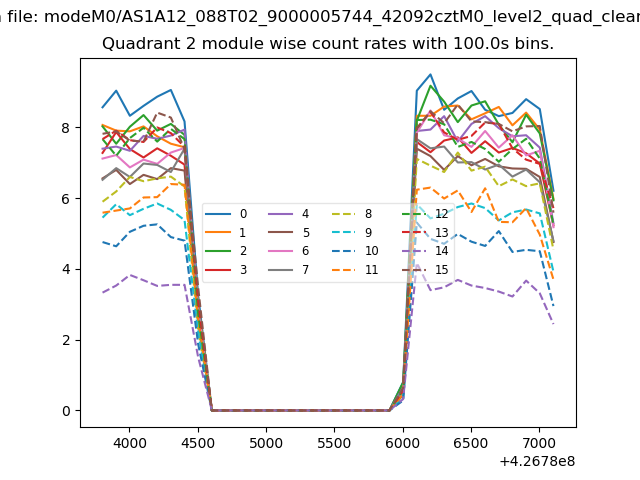
| Module-wise count rates for Quadrant B Data is divided into 100 sec bins |
 |
 |
| Module-wise count rates for Quadrant C Data is divided into 100 sec bins |
 |
 |
| Module-wise count rates for Quadrant D Data is divided into 100 sec bins |
 |
 |
| Parameter | Plot |
|---|---|
| CZT HV Monitor | 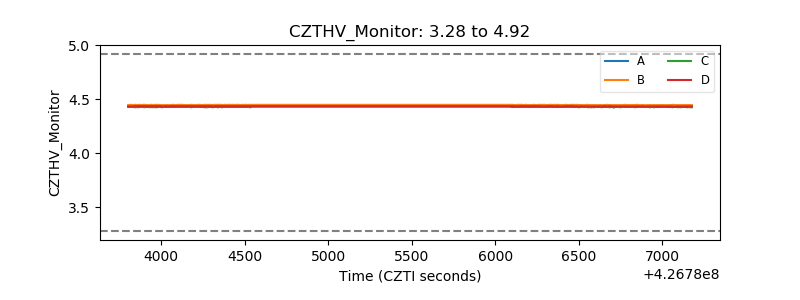 |
| D_VDD | 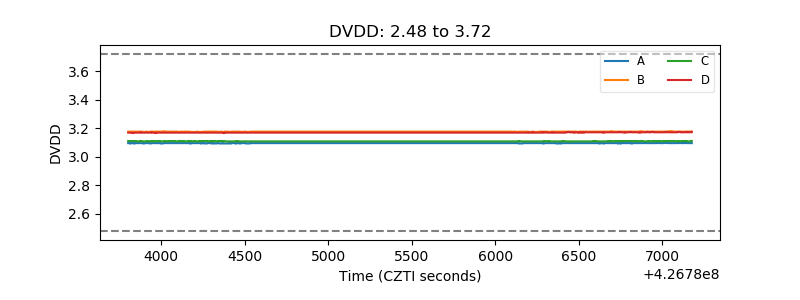 |
| Temperature 1 | 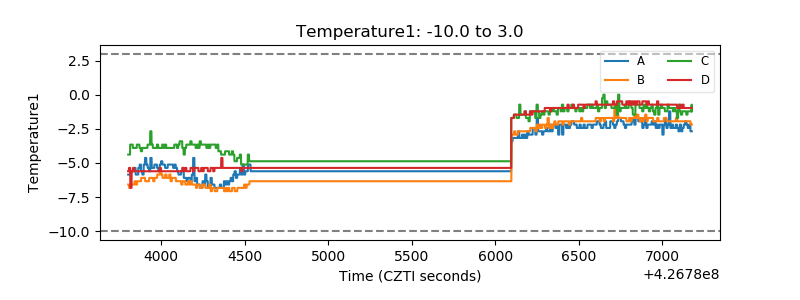 |
| Veto HV Monitor |  |
| Veto LLD | 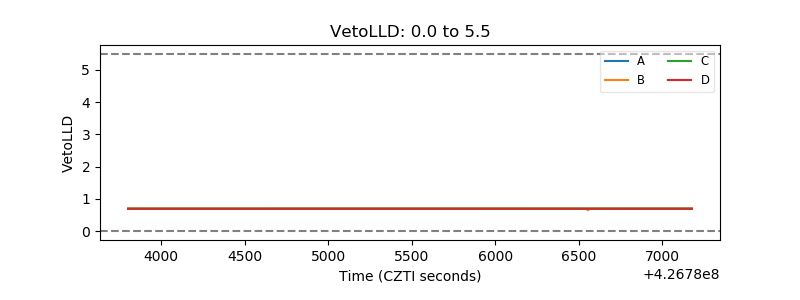 |
| Alpha Counter | 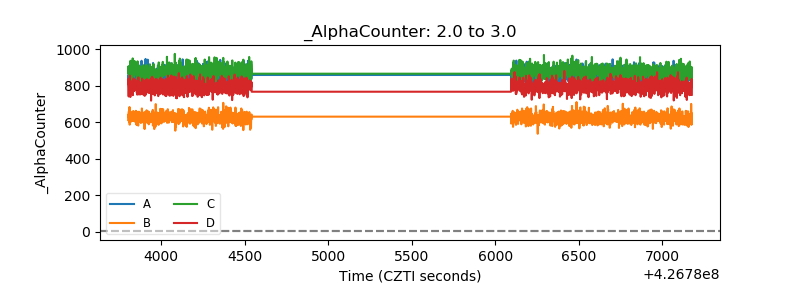 |
| _CPM_Rate | 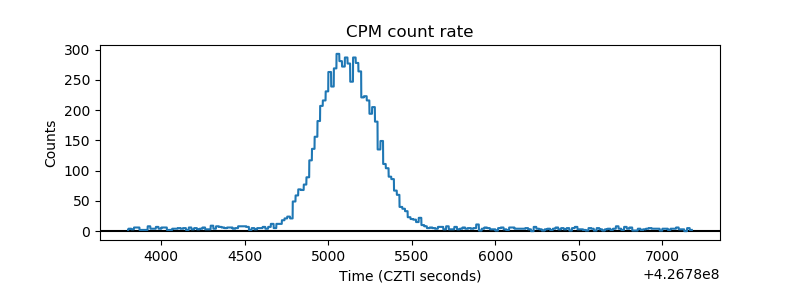 |
| CZT Counter | 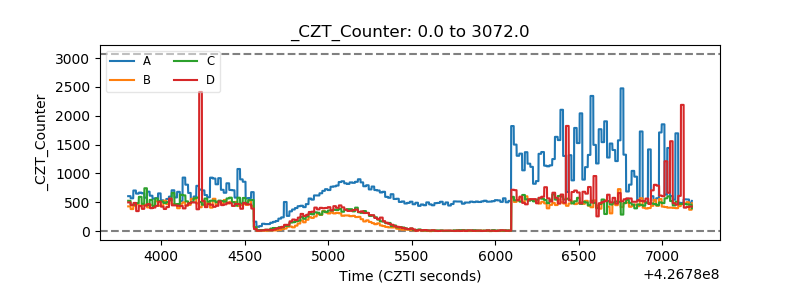 |
| +2.5 Volts monitor | 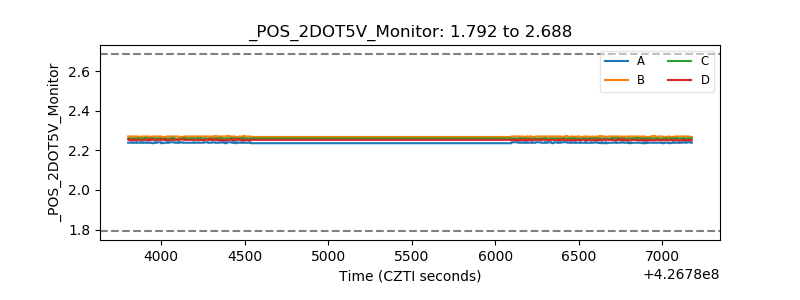 |
| +5 Volts monitor | 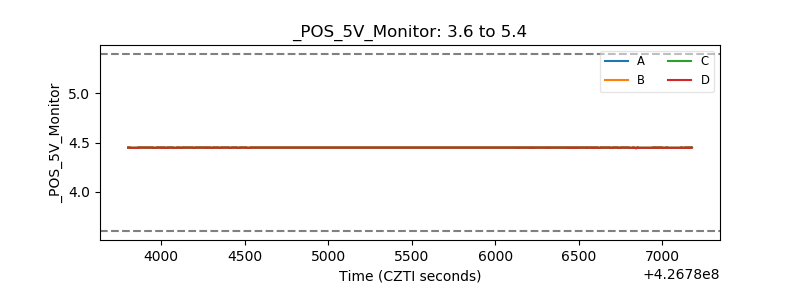 |
| _ROLL_ROT |  |
| _Roll_DEC | 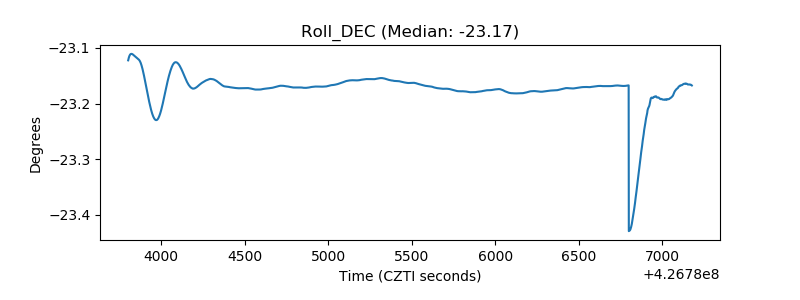 |
| _Roll_RA | 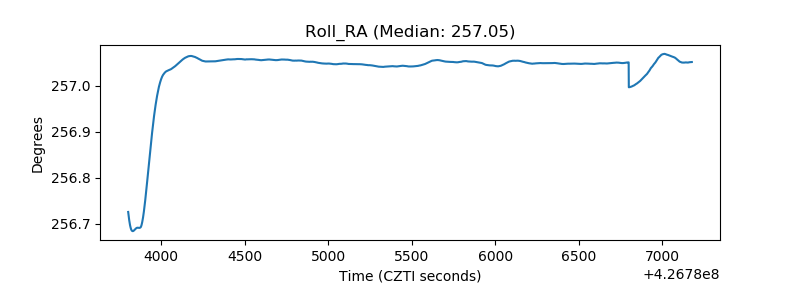 |
| Veto Counter | 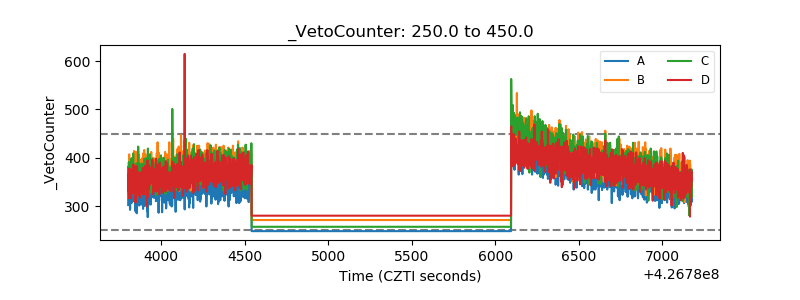 |