| Param | Original file | Final file |
|---|---|---|
| Filename | modeM0/AS1A12_088T08_9000005748_42098cztM0_level2.fits | modeM0/AS1A12_088T08_9000005748_42098cztM0_level2_quad_clean.evt |
| Size (bytes) | 338,869,440 | 86,771,520 |
| Size | 323.2 MB | 82.8 MB |
| Events in quadrant A | 4,977,999 | 572,966 |
| Events in quadrant B | 2,270,092 | 615,318 |
| Events in quadrant C | 2,356,777 | 574,623 |
| Events in quadrant D | 2,553,622 | 517,757 |
| Mode SS | |||
|---|---|---|---|
| Quadrant | BADHDUFLAG | Total packets | Discarded packets |
| A | 0 | 100 | 0 |
| B | 0 | 100 | 0 |
| C | 0 | 100 | 0 |
| D | 0 | 100 | 0 |
| Mode M0 | |||
|---|---|---|---|
| Quadrant | BADHDUFLAG | Total packets | Discarded packets |
| A | 0 | 18263 | 3 |
| B | 0 | 10095 | 2 |
| C | 0 | 10019 | 2 |
| D | 0 | 11180 | 2 |
| Mode M9 | |||
|---|---|---|---|
| Quadrant | BADHDUFLAG | Total packets | Discarded packets |
| A | 0 | 32 | 0 |
| B | 0 | 32 | 0 |
| C | 0 | 32 | 0 |
| D | 0 | 33 | 0 |
| Quadrant | Total seconds | Saturated seconds | Saturation percentage |
|---|---|---|---|
| A | 4949 | 244 | 4.930289% |
| B | 4949 | 25 | 0.505153% |
| C | 4949 | 4 | 0.080824% |
| D | 4949 | 73 | 1.475045% |
Noise dominated data is calculated using 1-second bins in cleaned event files. If a bin has >2000 counts, and if more than 50% of those come from <1% of pixels, then it is considered to be noise-dominated and hence unusable.
| Quadrant | # 1 sec bins | Bins with >0 counts | Bins with >2000 counts | High rate bins dominated by noise | Noise dominated (total time) | Noise dominated (detector-on time) | Marked lightcurve |
|---|---|---|---|---|---|---|---|
| A | 7072 | 4950 | 259 | 259 | 3.66% | 5.23% | 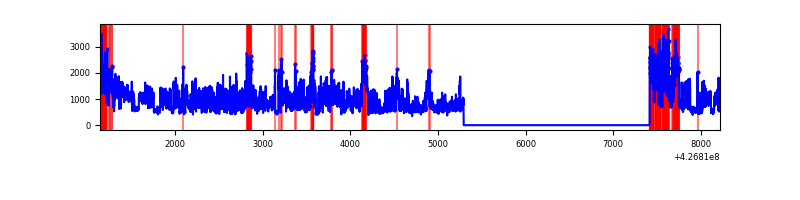 |
| B | 7072 | 4950 | 13 | 13 | 0.18% | 0.26% | 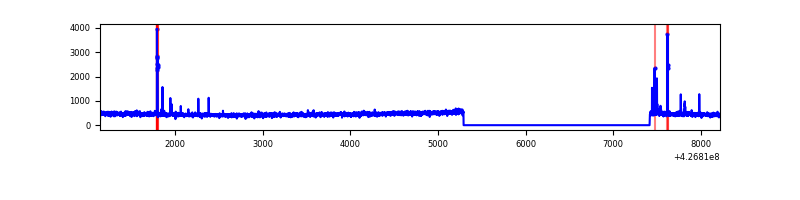 |
| C | 7072 | 4950 | 0 | 0 | 0.00% | 0.00% | 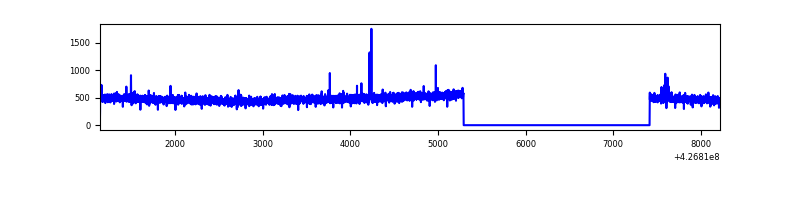 |
| D | 7072 | 4950 | 71 | 71 | 1.00% | 1.43% | 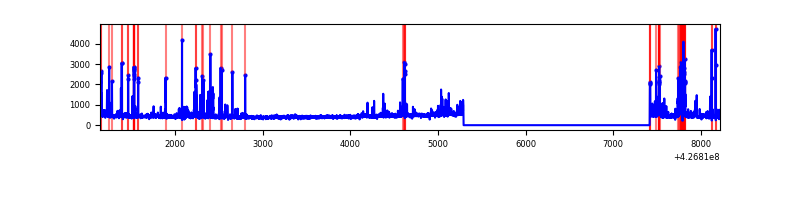 |
Top three noisy pixels from each quadrant. If the there are fewer than three noisy pixels in the level2.evt file, extra rows are filled as -1
| Pixel properties | Quadrant properties | ||||||
|---|---|---|---|---|---|---|---|
| Quadrant | DetID | PixID | Counts | Sigma | Mean | Median | Sigma |
| A | 15 | 222 | 2354864 | 20914.34 | 551 | 542 | 112.6 |
| A | 10 | 83 | 484641 | 4300.44 | 551 | 542 | 112.6 |
| A | 13 | 6 | 7528 | 62.06 | 551 | 542 | 112.6 |
| B | 5 | 255 | 59044 | 541.77 | 560 | 545 | 108.0 |
| B | 12 | 111 | 13424 | 119.27 | 560 | 545 | 108.0 |
| B | 14 | 111 | 12357 | 109.39 | 560 | 545 | 108.0 |
| C | 15 | 214 | 206524 | 1611.51 | 548 | 552 | 127.8 |
| C | 15 | 111 | 12764 | 95.55 | 548 | 552 | 127.8 |
| C | 13 | 61 | 3746 | 24.99 | 548 | 552 | 127.8 |
| D | 1 | 52 | 169009 | 1299.3 | 536 | 523 | 129.7 |
| D | 2 | 249 | 132366 | 1016.73 | 536 | 523 | 129.7 |
| D | 12 | 6 | 102856 | 789.16 | 536 | 523 | 129.7 |
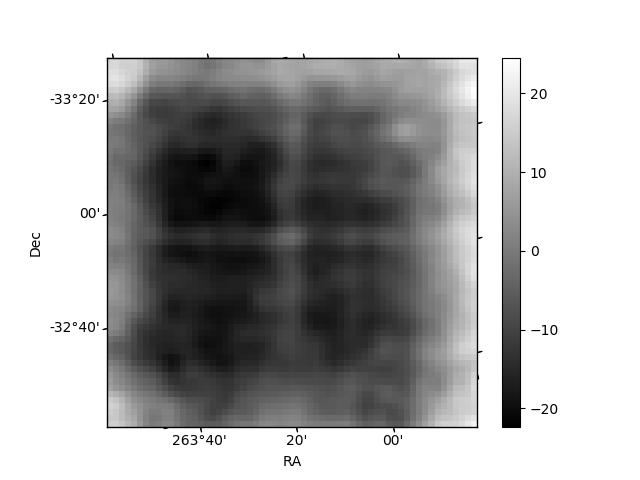
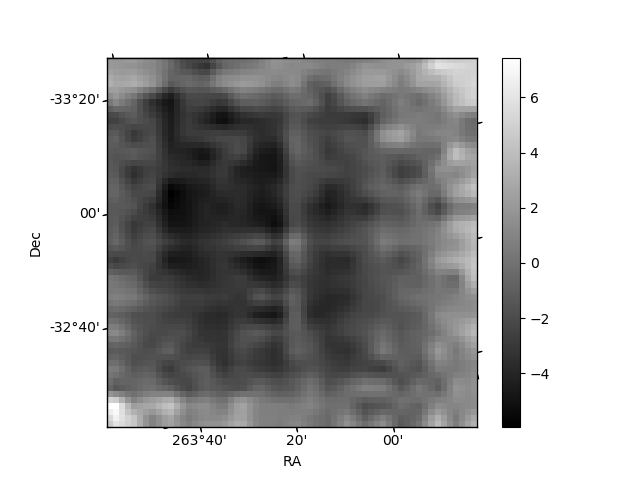
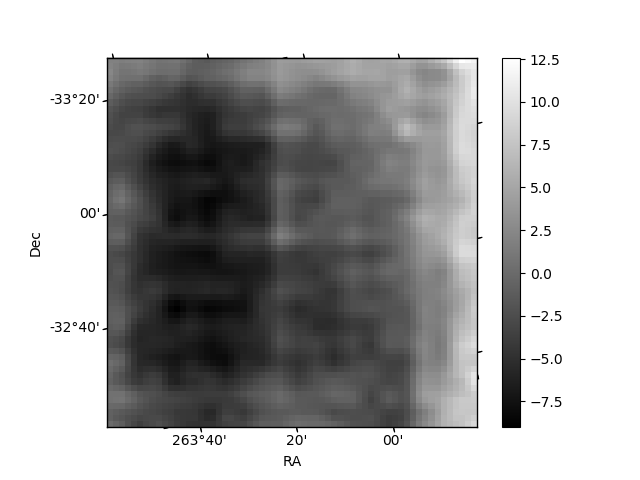
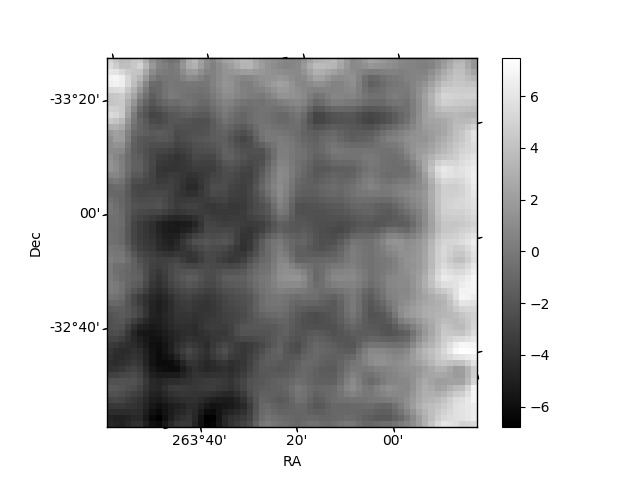
Histogram calculated using DETX and DETY for each event in the final _common_clean file
| Quadrant A | 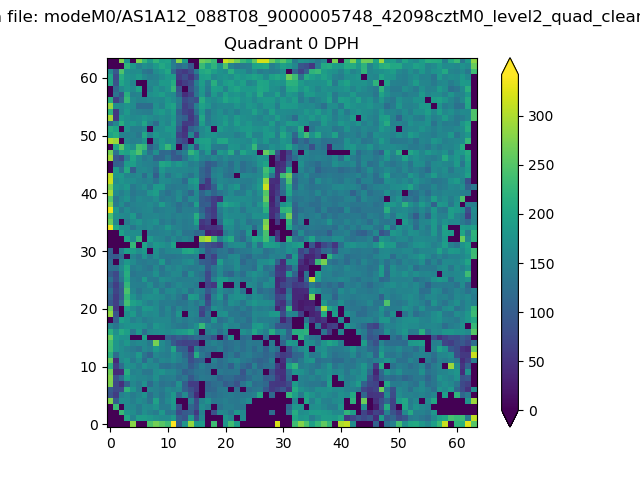 |
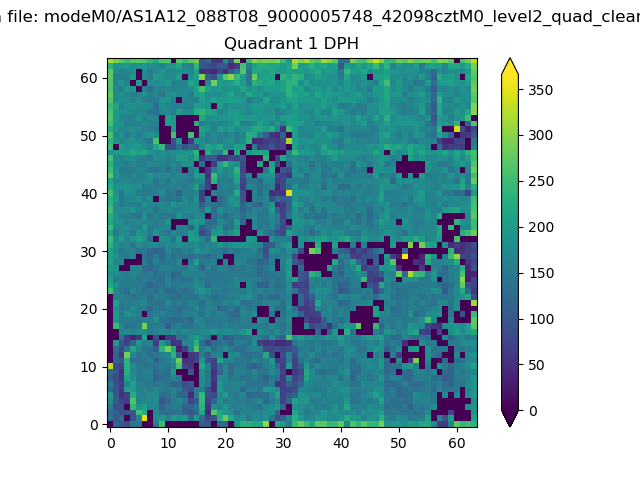 |
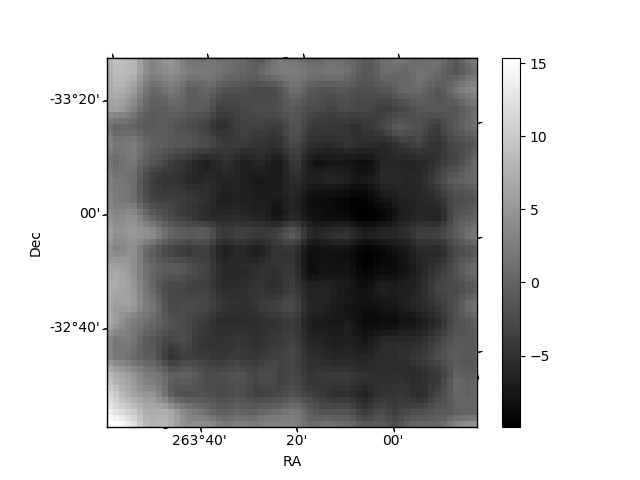
Quadrant B |
|---|---|---|---|
| Quadrant D | 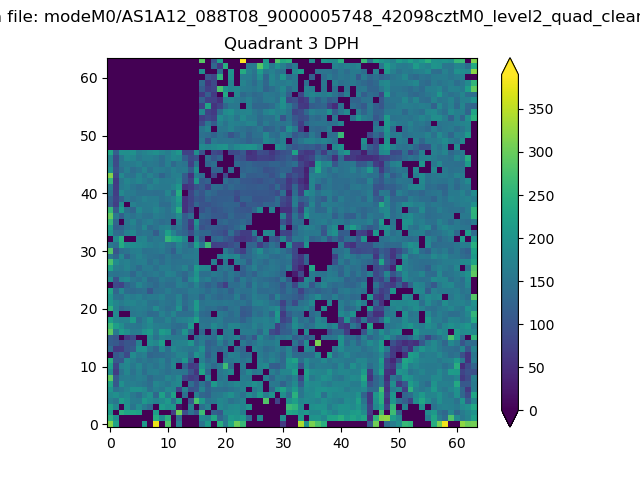 |
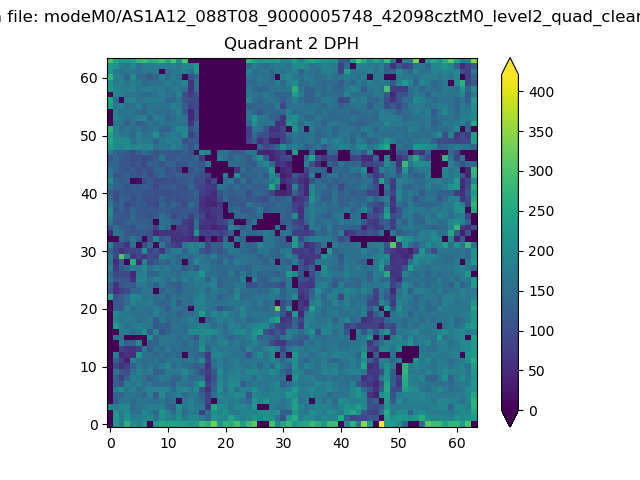 |
Quadrant C |
| Plot type | Count rate plots | Images |
|---|---|---|
| Comparison with Poisson distribution Blue bars denote a histogram of data divided into 1 sec bins. Red curve is a Poisson curve with rate = median count rate of data. |
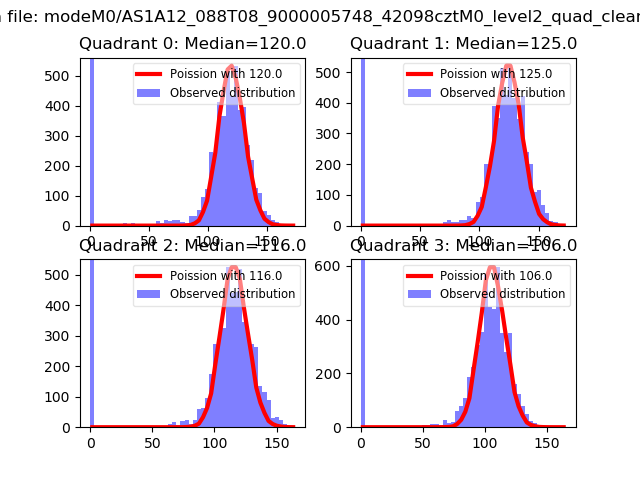 |
 |
| Quadrant-wise count rates Data is divided into 100 sec bins |
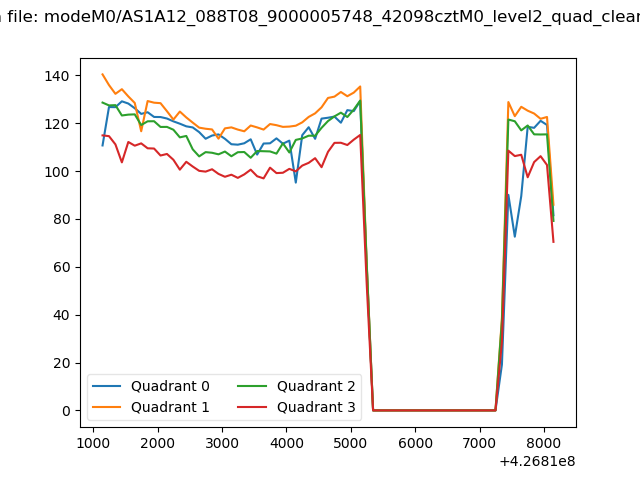 |
|
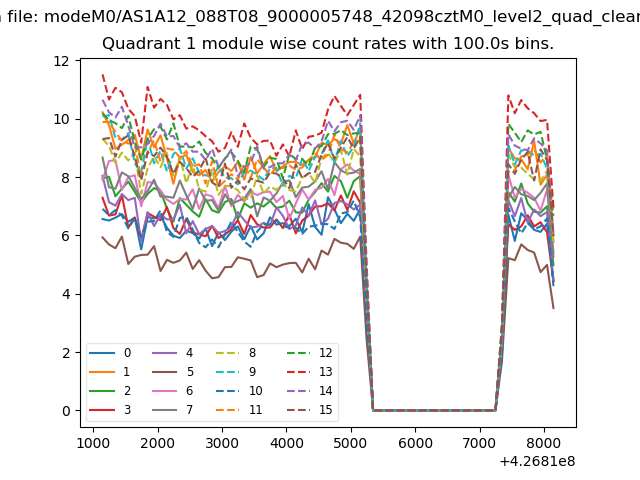
| Module-wise count rates for Quadrant A Data is divided into 100 sec bins |
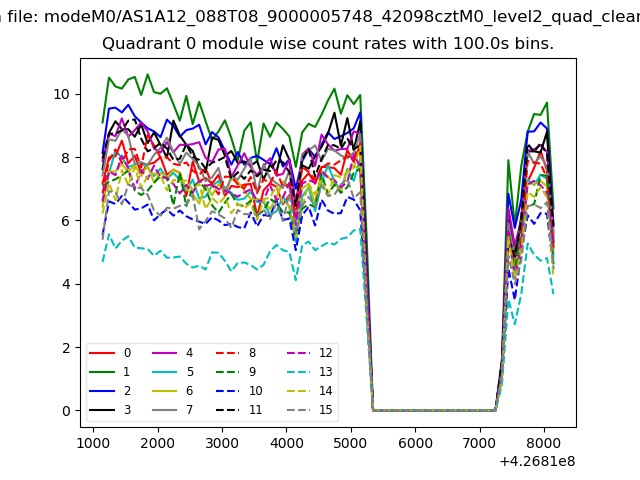 |
 |
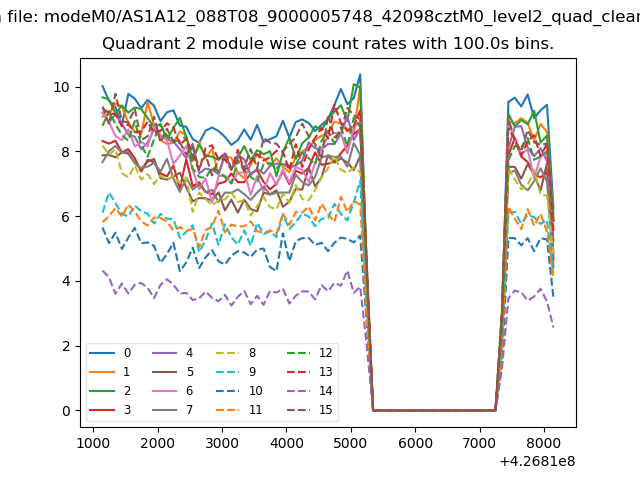
| Module-wise count rates for Quadrant B Data is divided into 100 sec bins |
 |
 |
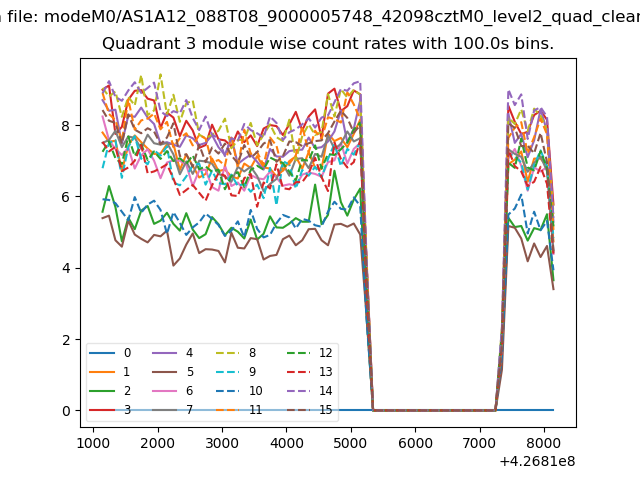
| Module-wise count rates for Quadrant C Data is divided into 100 sec bins |
 |
 |
| Module-wise count rates for Quadrant D Data is divided into 100 sec bins |
 |
 |
| Parameter | Plot |
|---|---|
| CZT HV Monitor |  |
| D_VDD | 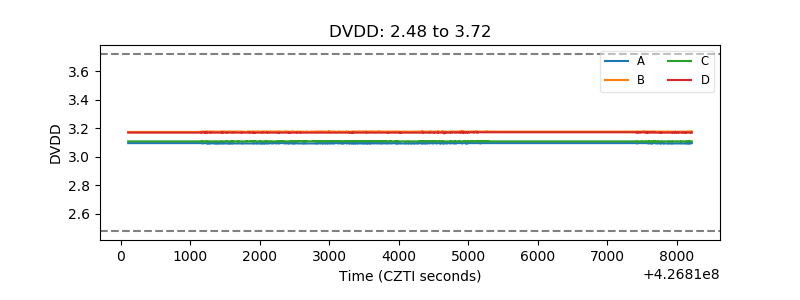 |
| Temperature 1 | 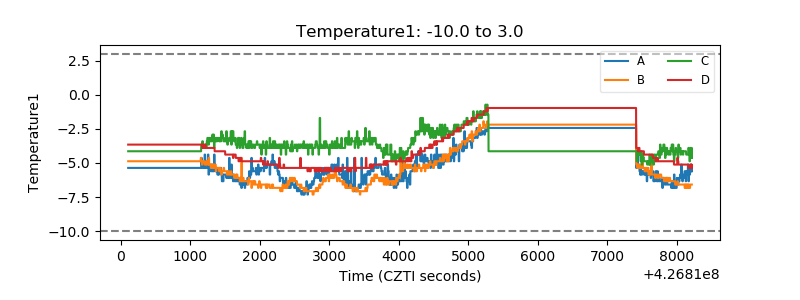 |
| Veto HV Monitor | 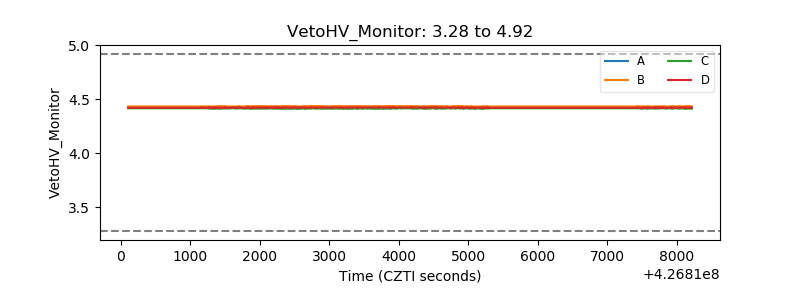 |
| Veto LLD |  |
| Alpha Counter | 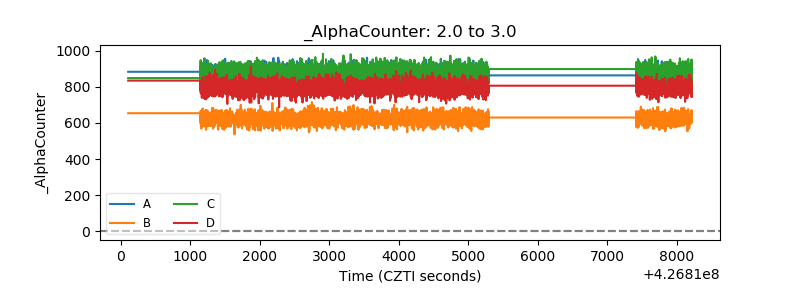 |
| _CPM_Rate | 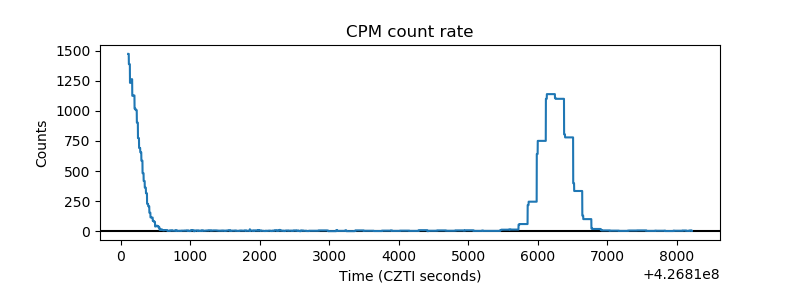 |
| CZT Counter | 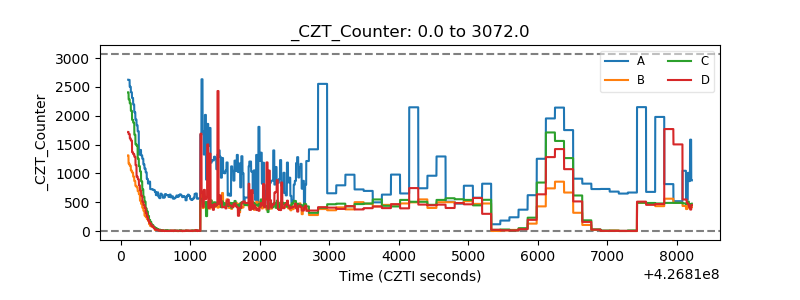 |
| +2.5 Volts monitor | 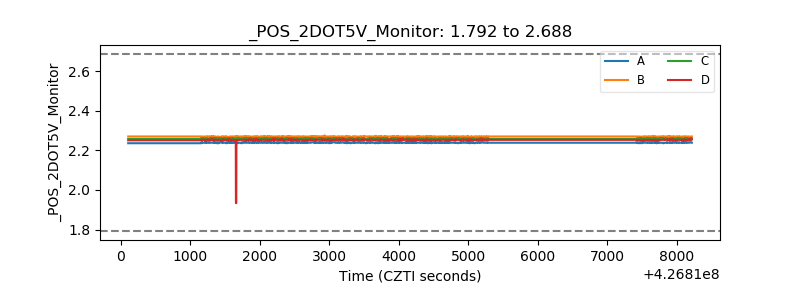 |
| +5 Volts monitor | 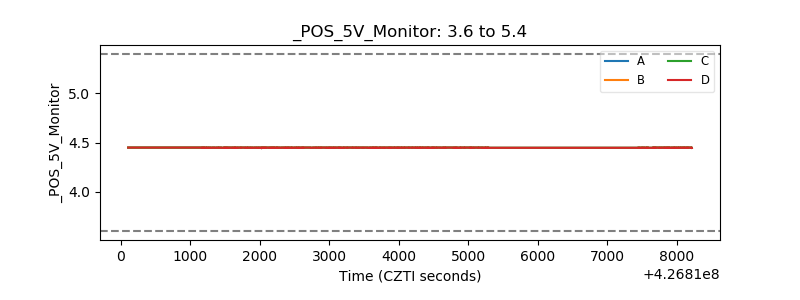 |
| _ROLL_ROT | 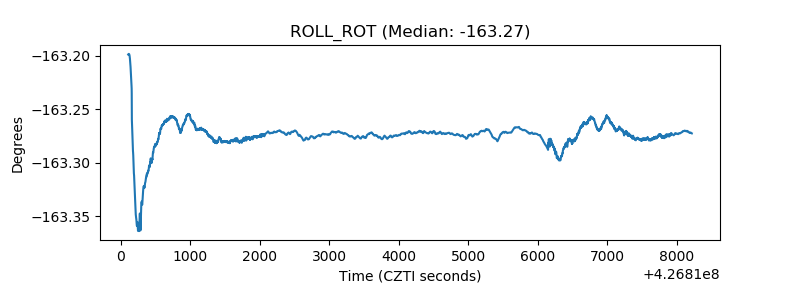 |
| _Roll_DEC | 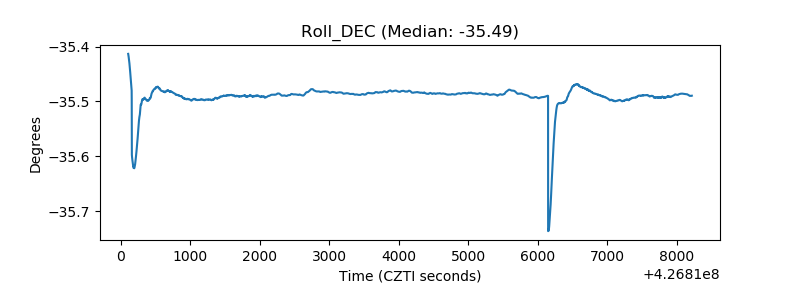 |
| _Roll_RA | 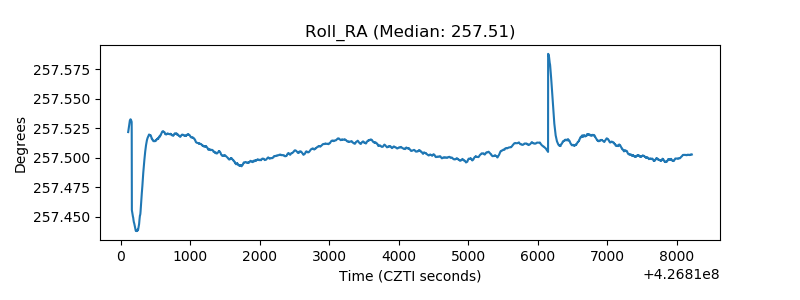 |
| Veto Counter | 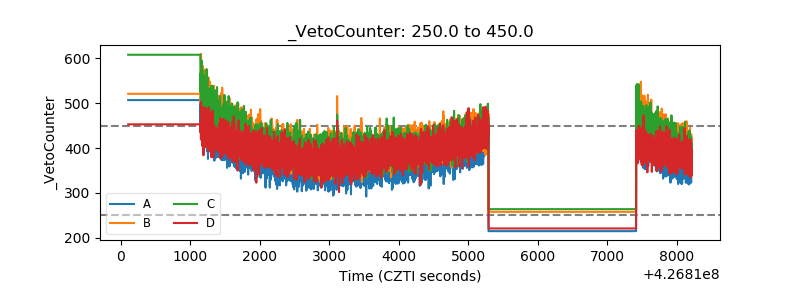 |