| Param | Original file | Final file |
|---|---|---|
| Filename | modeM0/AS1A12_088T08_9000005748_42099cztM0_level2.fits | modeM0/AS1A12_088T08_9000005748_42099cztM0_level2_quad_clean.evt |
| Size (bytes) | 368,470,080 | 82,224,000 |
| Size | 351.4 MB | 78.4 MB |
| Events in quadrant A | 5,383,435 | 531,396 |
| Events in quadrant B | 2,235,267 | 587,643 |
| Events in quadrant C | 2,304,800 | 546,904 |
| Events in quadrant D | 3,333,651 | 479,209 |
| Mode SS | |||
|---|---|---|---|
| Quadrant | BADHDUFLAG | Total packets | Discarded packets |
| A | 0 | 100 | 0 |
| B | 0 | 100 | 0 |
| C | 0 | 100 | 0 |
| D | 0 | 100 | 0 |
| Mode M0 | |||
|---|---|---|---|
| Quadrant | BADHDUFLAG | Total packets | Discarded packets |
| A | 0 | 19368 | 3 |
| B | 0 | 10038 | 2 |
| C | 0 | 9890 | 2 |
| D | 0 | 13332 | 2 |
| Mode M9 | |||
|---|---|---|---|
| Quadrant | BADHDUFLAG | Total packets | Discarded packets |
| A | 0 | 40 | 0 |
| B | 0 | 41 | 0 |
| C | 0 | 41 | 0 |
| D | 0 | 41 | 0 |
| Quadrant | Total seconds | Saturated seconds | Saturation percentage |
|---|---|---|---|
| A | 4915 | 435 | 8.850458% |
| B | 4915 | 15 | 0.305188% |
| C | 4915 | 3 | 0.061038% |
| D | 4915 | 274 | 5.574771% |
Noise dominated data is calculated using 1-second bins in cleaned event files. If a bin has >2000 counts, and if more than 50% of those come from <1% of pixels, then it is considered to be noise-dominated and hence unusable.
| Quadrant | # 1 sec bins | Bins with >0 counts | Bins with >2000 counts | High rate bins dominated by noise | Noise dominated (total time) | Noise dominated (detector-on time) | Marked lightcurve |
|---|---|---|---|---|---|---|---|
| A | 7039 | 4916 | 392 | 392 | 5.57% | 7.97% | 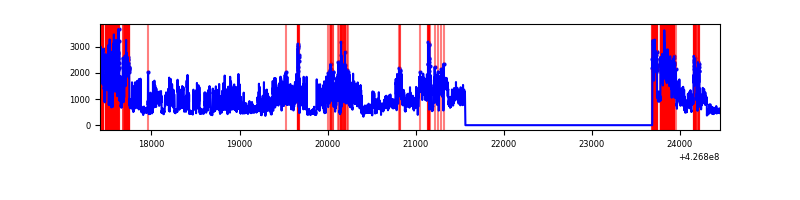 |
| B | 7039 | 4916 | 8 | 8 | 0.11% | 0.16% | 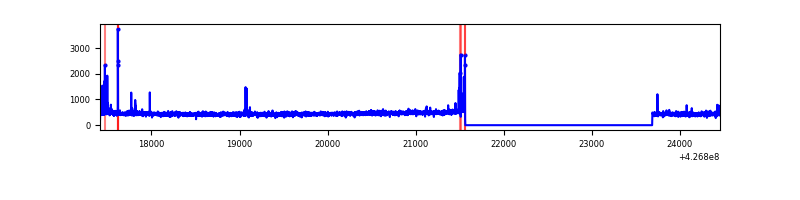 |
| C | 7039 | 4916 | 0 | 0 | 0.00% | 0.00% | 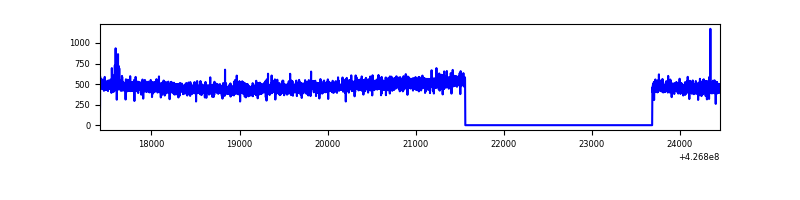 |
| D | 7039 | 4916 | 219 | 219 | 3.11% | 4.45% | 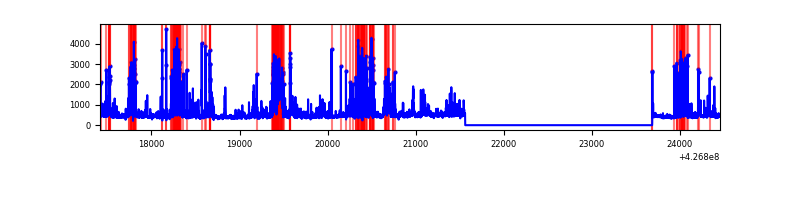 |
Top three noisy pixels from each quadrant. If the there are fewer than three noisy pixels in the level2.evt file, extra rows are filled as -1
| Pixel properties | Quadrant properties | ||||||
|---|---|---|---|---|---|---|---|
| Quadrant | DetID | PixID | Counts | Sigma | Mean | Median | Sigma |
| A | 15 | 222 | 2821534 | 25683.22 | 533 | 523 | 109.8 |
| A | 10 | 83 | 472064 | 4293.03 | 533 | 523 | 109.8 |
| A | 7 | 16 | 16053 | 141.39 | 533 | 523 | 109.8 |
| B | 5 | 255 | 61461 | 579.42 | 546 | 531 | 105.2 |
| B | 0 | 229 | 17809 | 164.31 | 546 | 531 | 105.2 |
| B | 12 | 111 | 13277 | 121.21 | 546 | 531 | 105.2 |
| C | 15 | 214 | 204784 | 1631.95 | 536 | 542 | 125.2 |
| C | 15 | 111 | 5438 | 39.12 | 536 | 542 | 125.2 |
| C | 13 | 61 | 3629 | 24.67 | 536 | 542 | 125.2 |
| D | 13 | 249 | 512290 | 4025.04 | 516 | 501 | 127.2 |
| D | 12 | 6 | 447591 | 3516.2 | 516 | 501 | 127.2 |
| D | 2 | 249 | 181393 | 1422.65 | 516 | 501 | 127.2 |
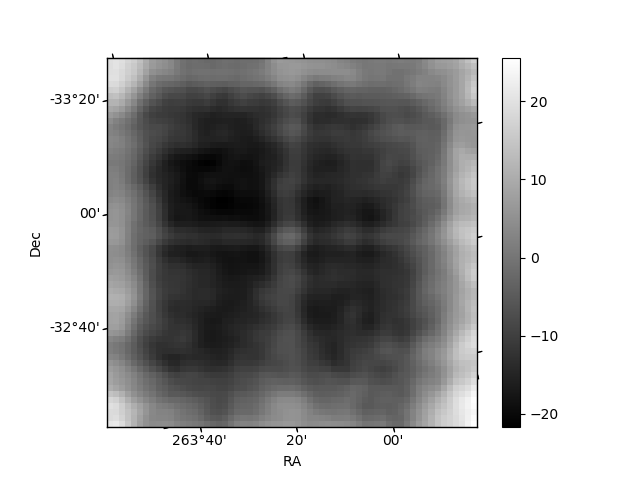
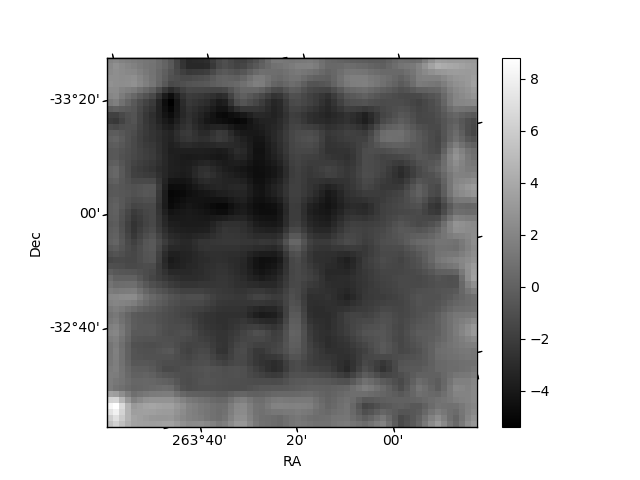
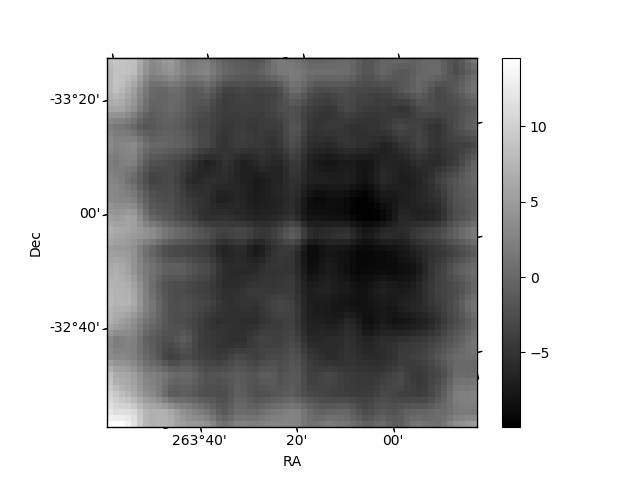
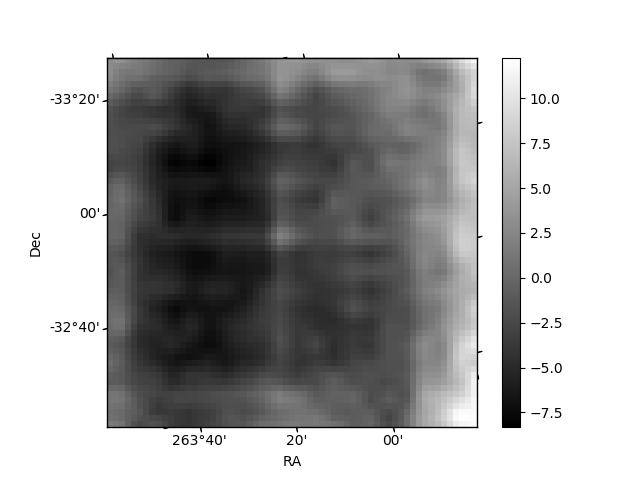
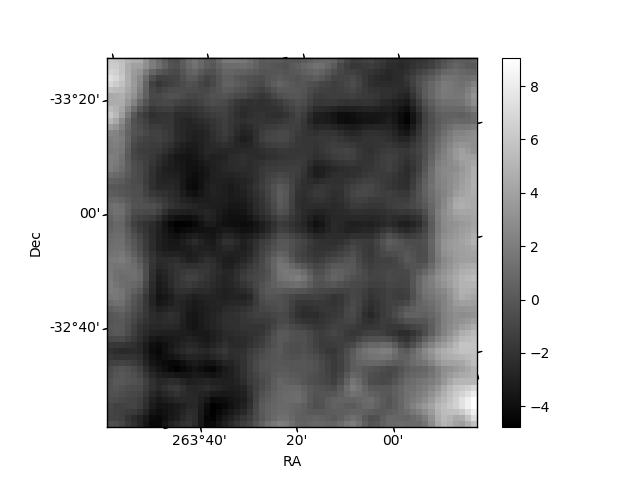
Histogram calculated using DETX and DETY for each event in the final _common_clean file
| Quadrant A | 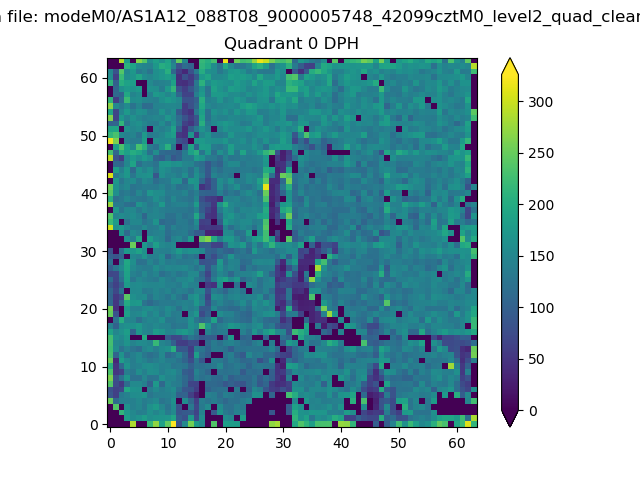 |
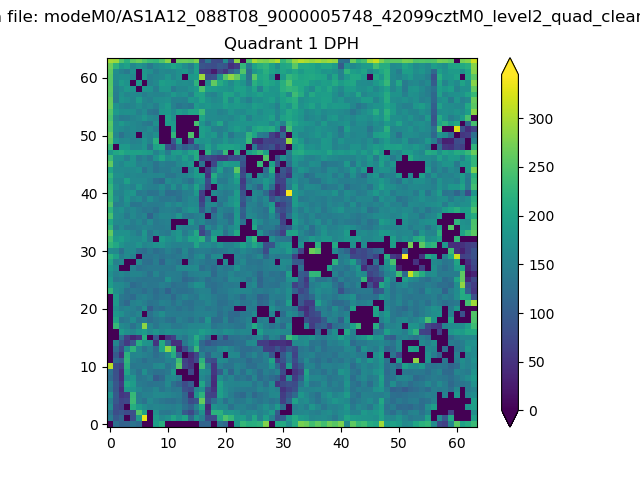 |
Quadrant B |
|---|---|---|---|
| Quadrant D | 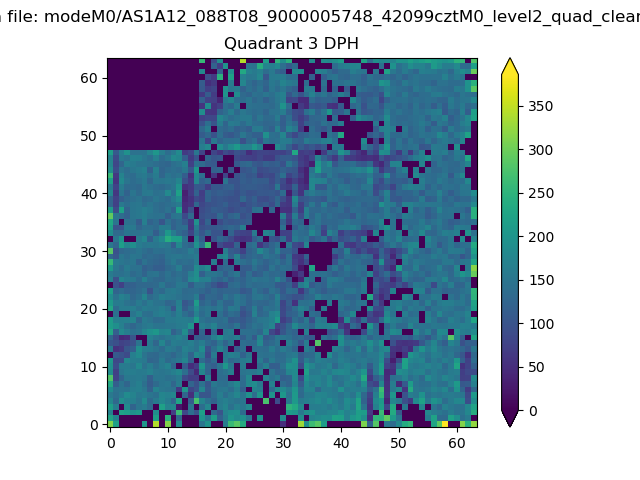 |
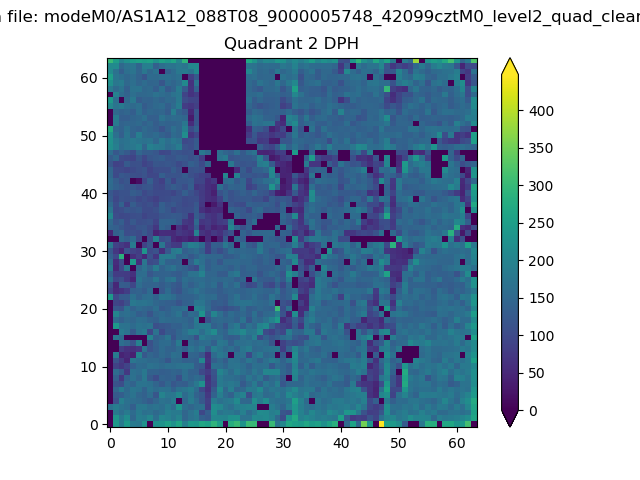 |
Quadrant C |
| Plot type | Count rate plots | Images |
|---|---|---|
| Comparison with Poisson distribution Blue bars denote a histogram of data divided into 1 sec bins. Red curve is a Poisson curve with rate = median count rate of data. |
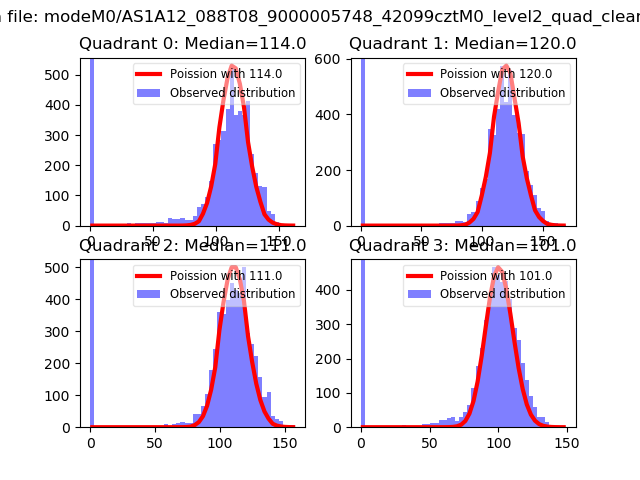 |
 |
| Quadrant-wise count rates Data is divided into 100 sec bins |
 |
|
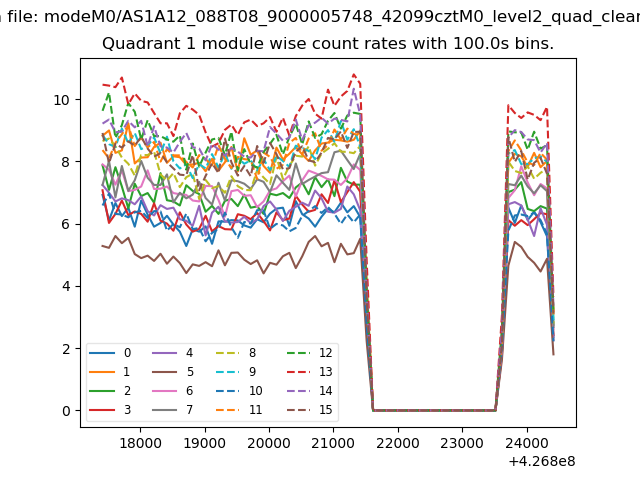
| Module-wise count rates for Quadrant A Data is divided into 100 sec bins |
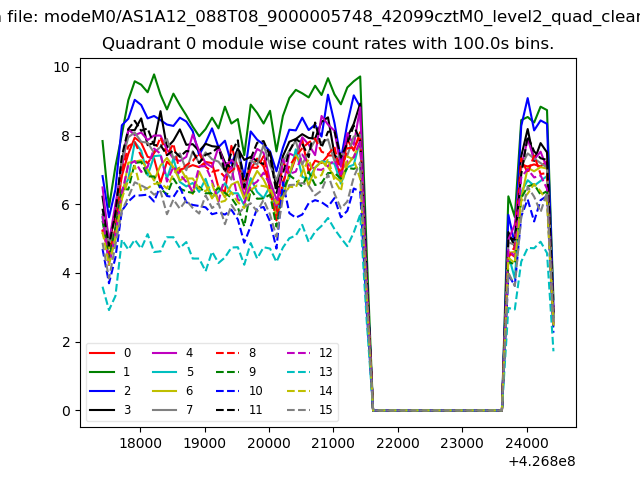 |
 |
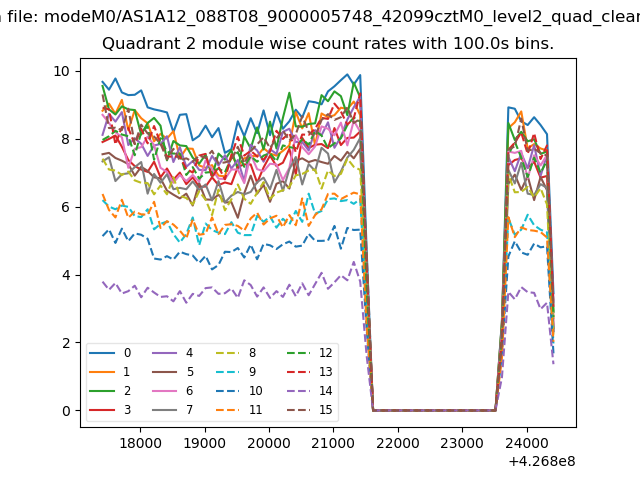
| Module-wise count rates for Quadrant B Data is divided into 100 sec bins |
 |
 |
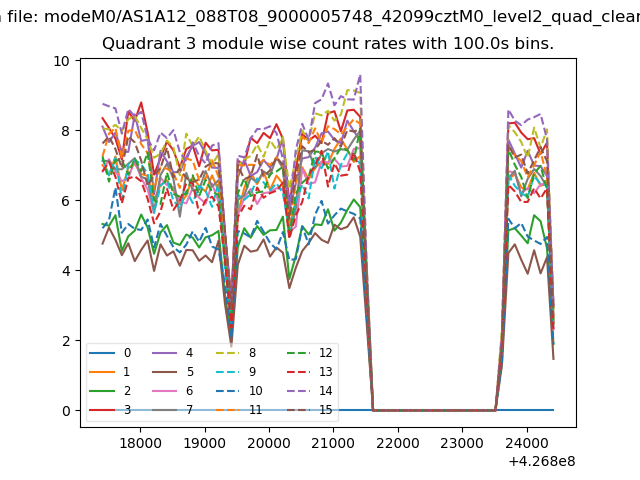
| Module-wise count rates for Quadrant C Data is divided into 100 sec bins |
 |
 |
| Module-wise count rates for Quadrant D Data is divided into 100 sec bins |
 |
 |
| Parameter | Plot |
|---|---|
| CZT HV Monitor | 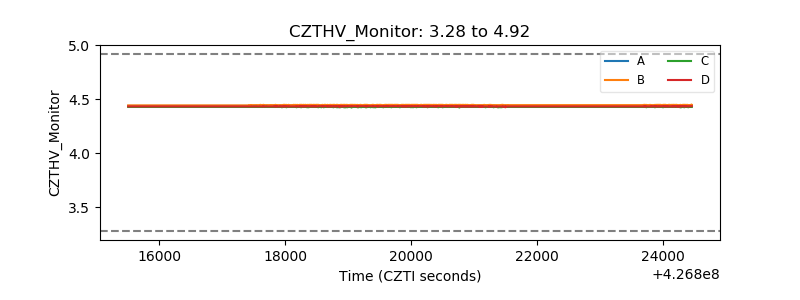 |
| D_VDD | 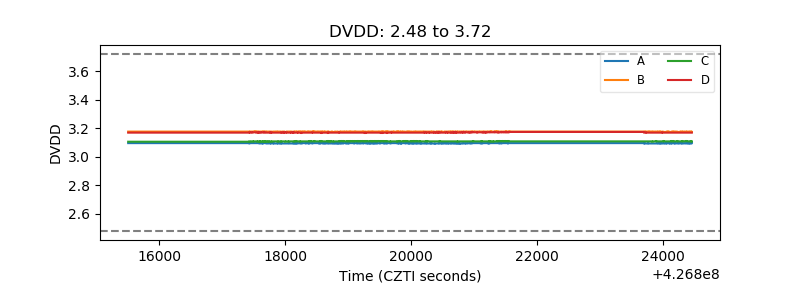 |
| Temperature 1 | 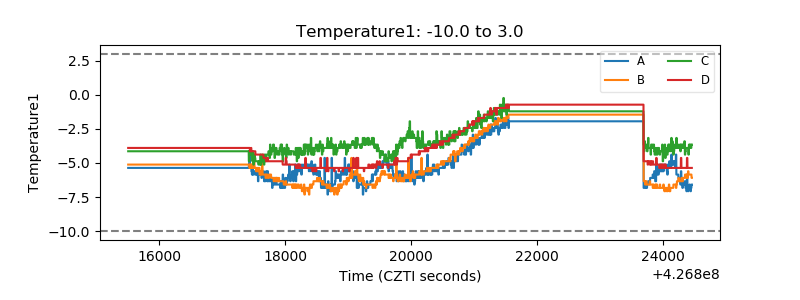 |
| Veto HV Monitor | 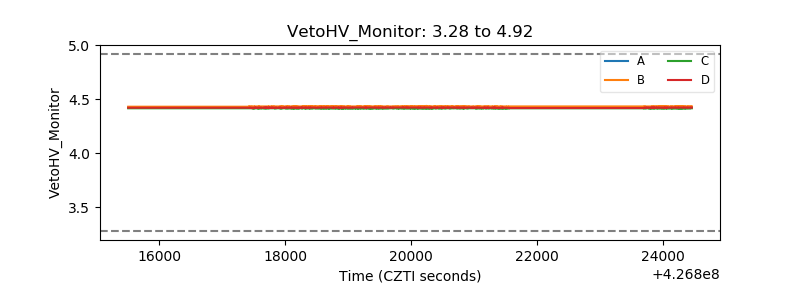 |
| Veto LLD | 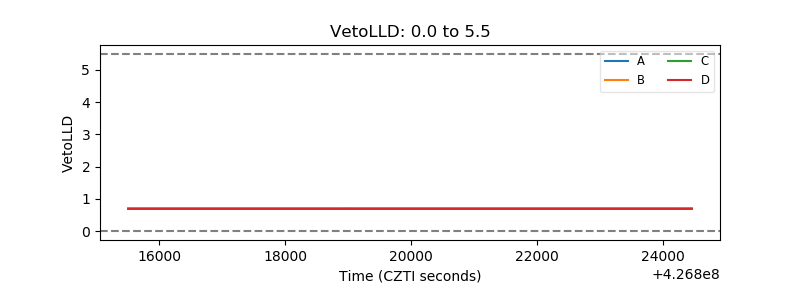 |
| Alpha Counter | 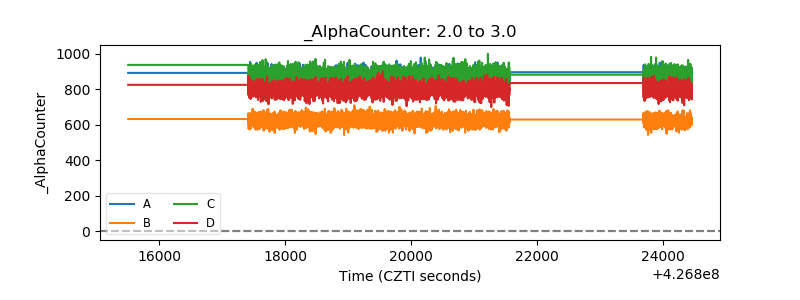 |
| _CPM_Rate | 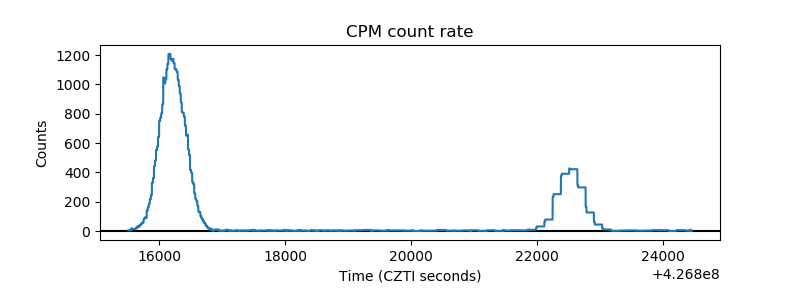 |
| CZT Counter | 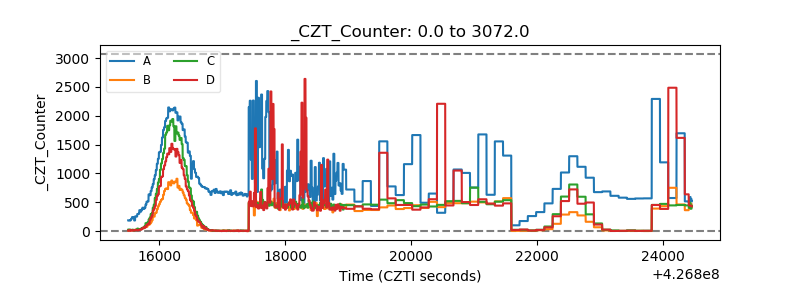 |
| +2.5 Volts monitor | 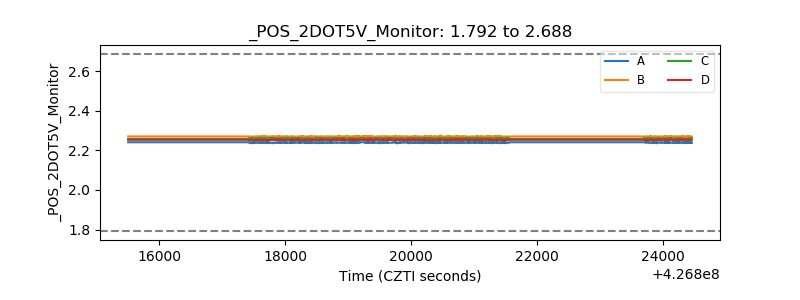 |
| +5 Volts monitor | 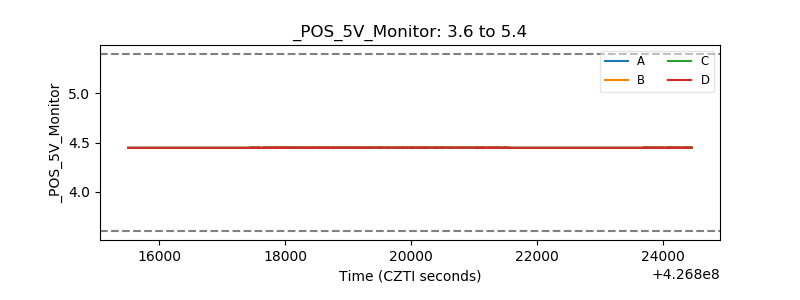 |
| _ROLL_ROT | 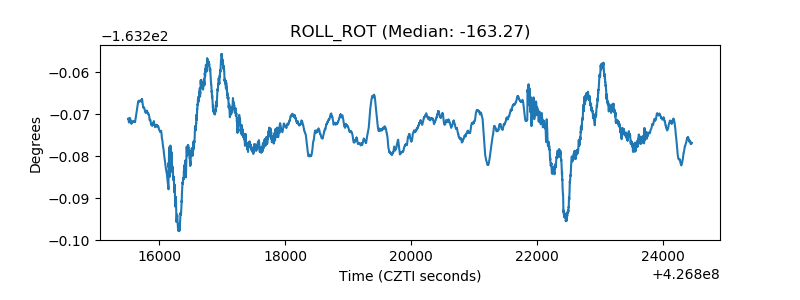 |
| _Roll_DEC | 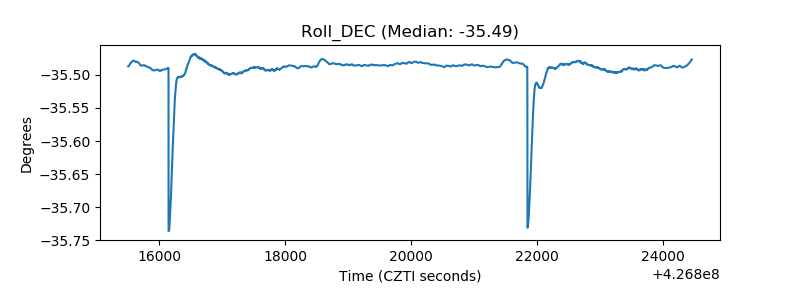 |
| _Roll_RA | 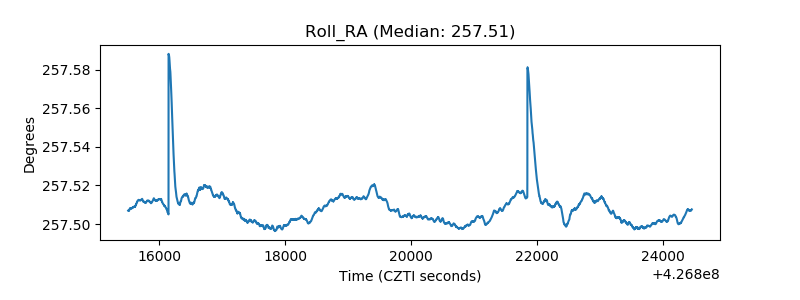 |
| Veto Counter | 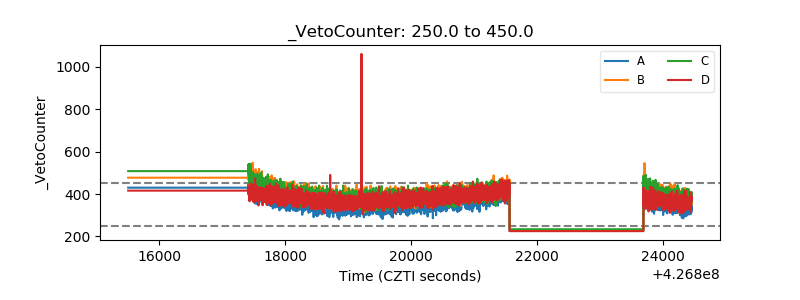 |