| Param | Original file | Final file |
|---|---|---|
| Filename | modeM0/AS1A12_088T08_9000005748_42100cztM0_level2.fits | modeM0/AS1A12_088T08_9000005748_42100cztM0_level2_quad_clean.evt |
| Size (bytes) | 404,942,400 | 83,952,000 |
| Size | 386.2 MB | 80.1 MB |
| Events in quadrant A | 5,596,619 | 550,058 |
| Events in quadrant B | 2,318,660 | 600,146 |
| Events in quadrant C | 2,408,754 | 559,513 |
| Events in quadrant D | 4,259,266 | 465,957 |
| Mode SS | |||
|---|---|---|---|
| Quadrant | BADHDUFLAG | Total packets | Discarded packets |
| A | 0 | 108 | 0 |
| B | 0 | 108 | 0 |
| C | 0 | 108 | 0 |
| D | 0 | 108 | 0 |
| Mode M0 | |||
|---|---|---|---|
| Quadrant | BADHDUFLAG | Total packets | Discarded packets |
| A | 0 | 20237 | 3 |
| B | 0 | 10610 | 2 |
| C | 0 | 10485 | 2 |
| D | 0 | 16358 | 2 |
| Mode M9 | |||
|---|---|---|---|
| Quadrant | BADHDUFLAG | Total packets | Discarded packets |
| A | 0 | 31 | 0 |
| B | 0 | 31 | 0 |
| C | 0 | 31 | 0 |
| D | 0 | 32 | 0 |
| Quadrant | Total seconds | Saturated seconds | Saturation percentage |
|---|---|---|---|
| A | 5224 | 382 | 7.312404% |
| B | 5224 | 11 | 0.210567% |
| C | 5224 | 6 | 0.114855% |
| D | 5224 | 595 | 11.389740% |
Noise dominated data is calculated using 1-second bins in cleaned event files. If a bin has >2000 counts, and if more than 50% of those come from <1% of pixels, then it is considered to be noise-dominated and hence unusable.
| Quadrant | # 1 sec bins | Bins with >0 counts | Bins with >2000 counts | High rate bins dominated by noise | Noise dominated (total time) | Noise dominated (detector-on time) | Marked lightcurve |
|---|---|---|---|---|---|---|---|
| A | 7226 | 5225 | 333 | 333 | 4.61% | 6.37% | 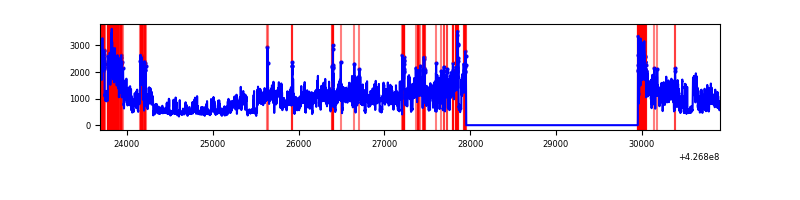 |
| B | 7226 | 5225 | 1 | 1 | 0.01% | 0.02% | 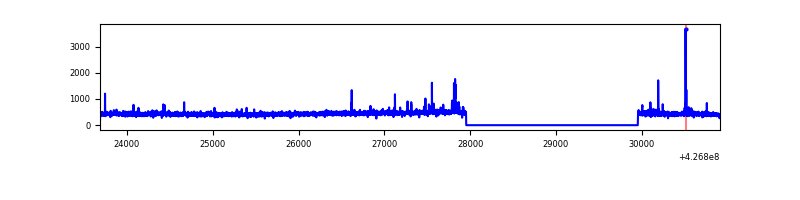 |
| C | 7226 | 5225 | 0 | 0 | 0.00% | 0.00% | 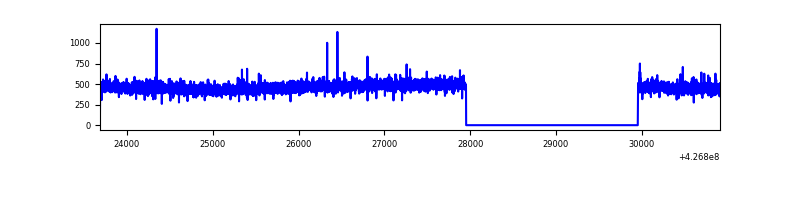 |
| D | 7226 | 5225 | 525 | 525 | 7.27% | 10.05% | 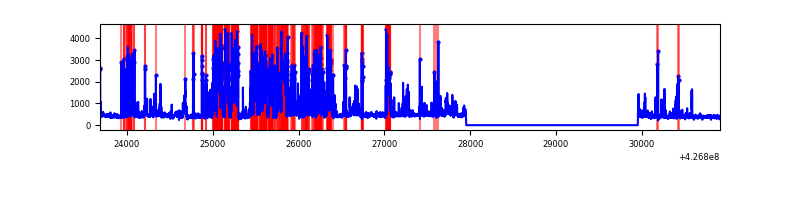 |
Top three noisy pixels from each quadrant. If the there are fewer than three noisy pixels in the level2.evt file, extra rows are filled as -1
| Pixel properties | Quadrant properties | ||||||
|---|---|---|---|---|---|---|---|
| Quadrant | DetID | PixID | Counts | Sigma | Mean | Median | Sigma |
| A | 15 | 222 | 2882598 | 25118.53 | 560 | 550 | 114.7 |
| A | 10 | 83 | 501421 | 4365.35 | 560 | 550 | 114.7 |
| A | 15 | 223 | 25290 | 215.62 | 560 | 550 | 114.7 |
| B | 5 | 255 | 29022 | 255.87 | 571 | 556 | 111.3 |
| B | 15 | 85 | 18124 | 157.91 | 571 | 556 | 111.3 |
| B | 0 | 229 | 15009 | 129.91 | 571 | 556 | 111.3 |
| C | 15 | 214 | 216196 | 1629.03 | 560 | 561 | 132.4 |
| C | 12 | 249 | 4498 | 29.74 | 560 | 561 | 132.4 |
| C | 15 | 159 | 4458 | 29.44 | 560 | 561 | 132.4 |
| D | 13 | 249 | 1587124 | 12273.8 | 524 | 509 | 129.3 |
| D | 12 | 6 | 302376 | 2335.2 | 524 | 509 | 129.3 |
| D | 1 | 52 | 223117 | 1722.06 | 524 | 509 | 129.3 |
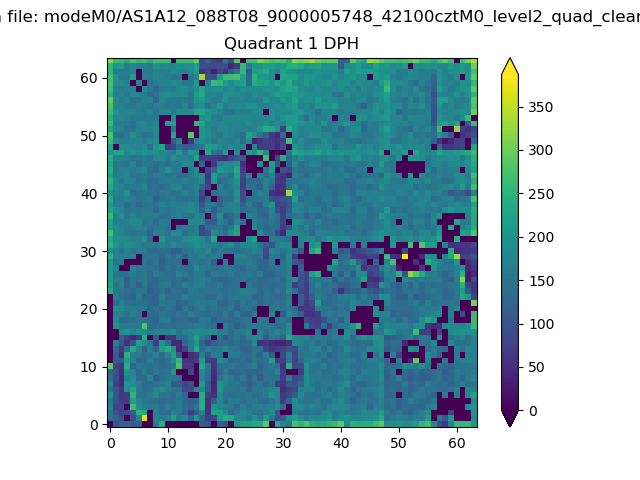
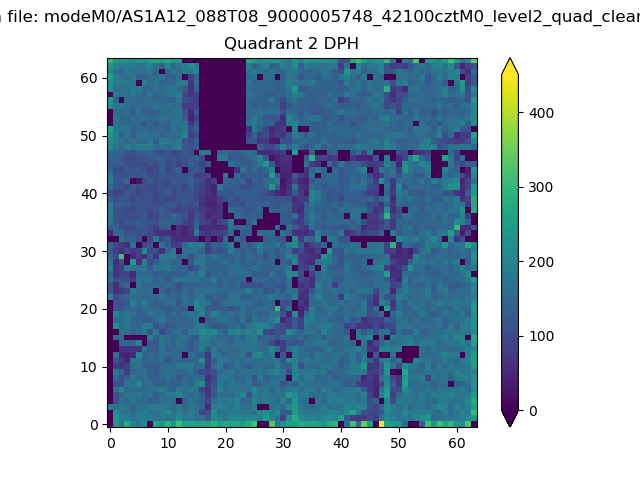
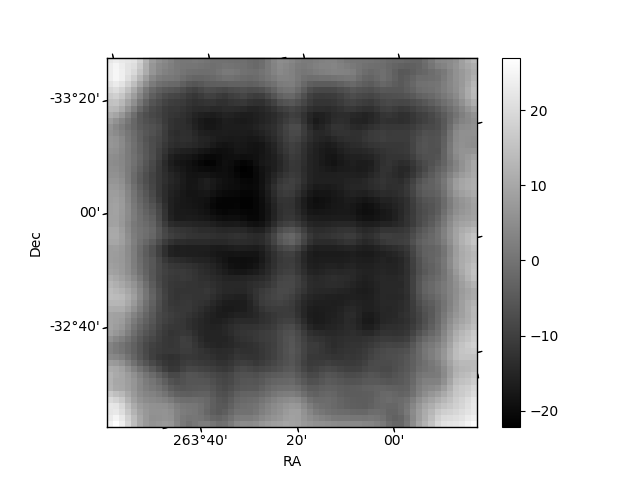
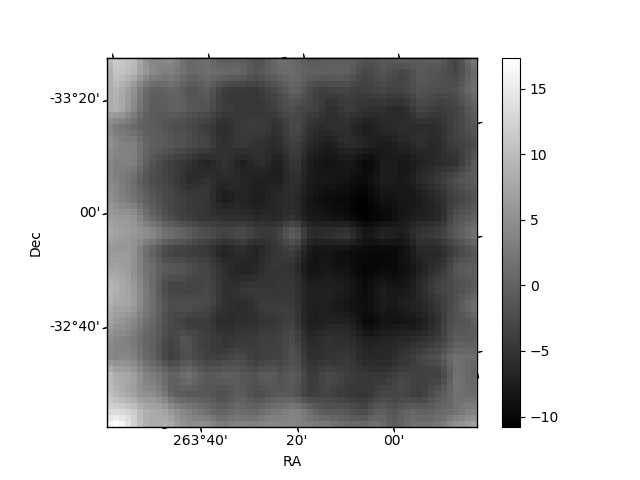
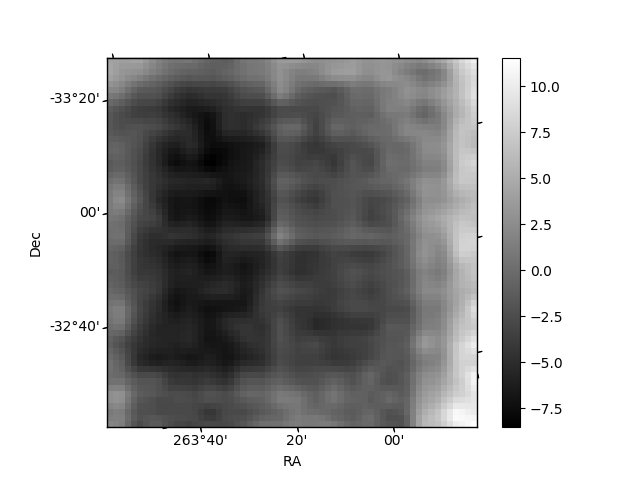
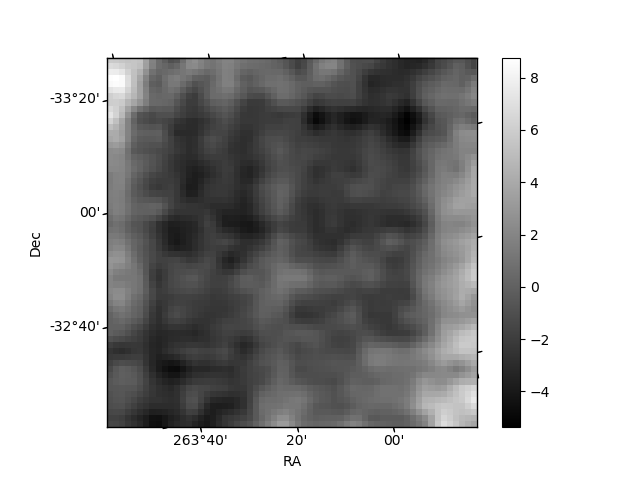
Histogram calculated using DETX and DETY for each event in the final _common_clean file
| Quadrant A | 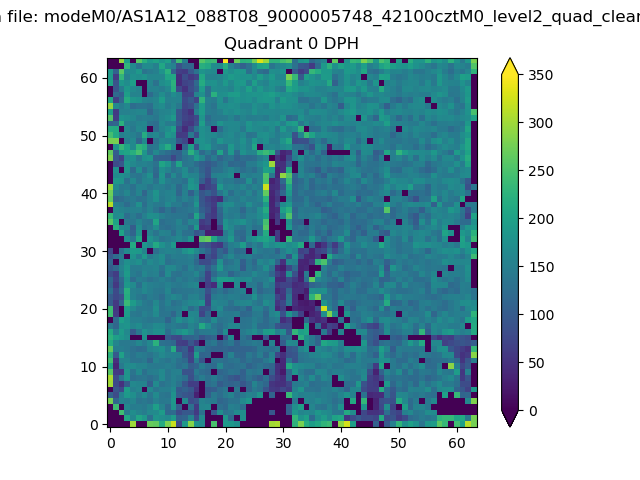 |
 |
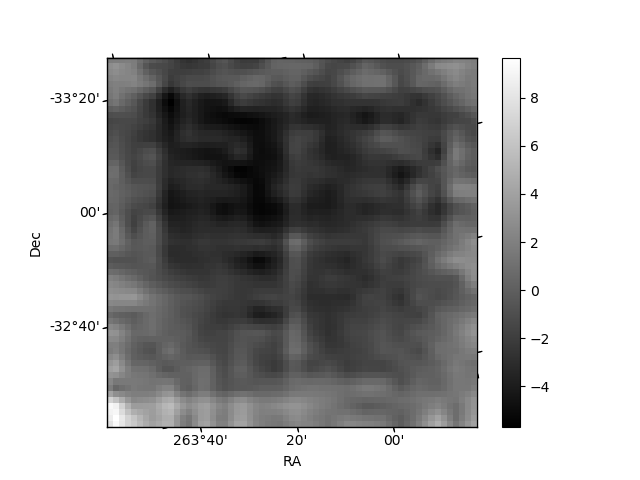
Quadrant B |
|---|---|---|---|
| Quadrant D |  |
 |
Quadrant C |
| Plot type | Count rate plots | Images |
|---|---|---|
| Comparison with Poisson distribution Blue bars denote a histogram of data divided into 1 sec bins. Red curve is a Poisson curve with rate = median count rate of data. |
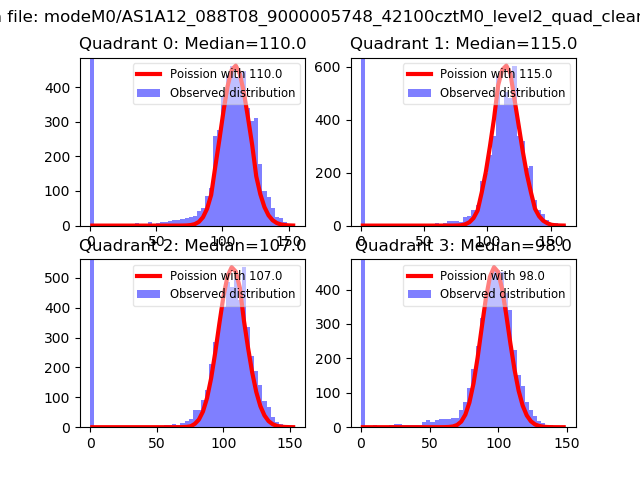 |
 |
| Quadrant-wise count rates Data is divided into 100 sec bins |
 |
|
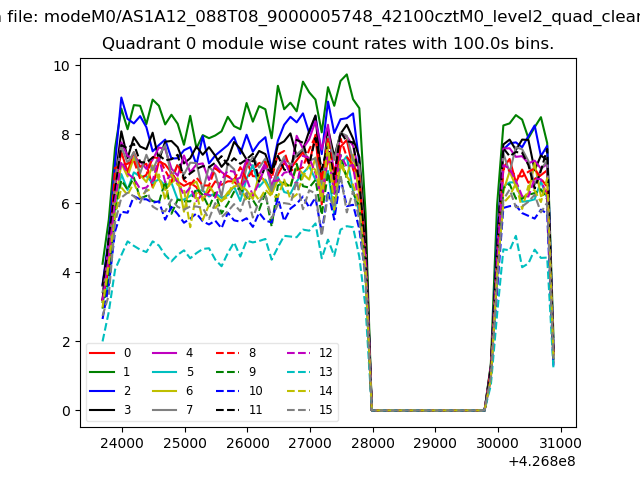
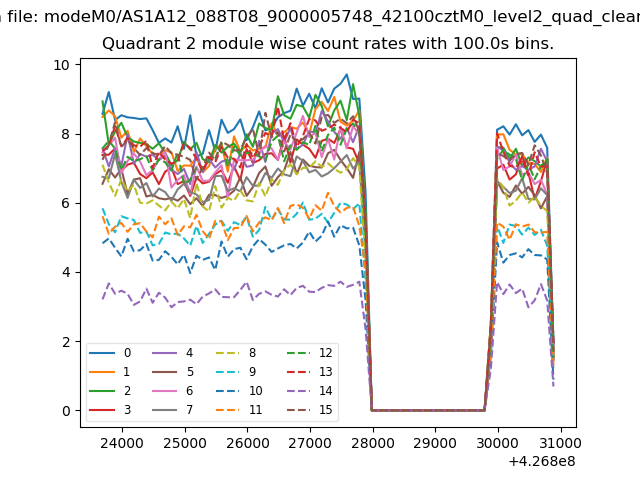
| Module-wise count rates for Quadrant A Data is divided into 100 sec bins |
 |
 |
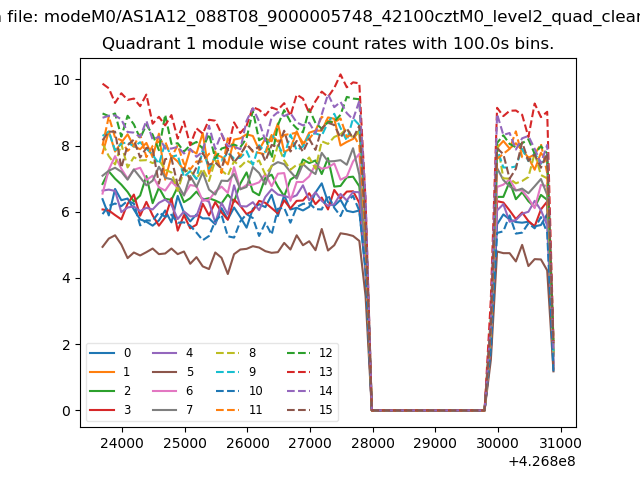
| Module-wise count rates for Quadrant B Data is divided into 100 sec bins |
 |
 |
| Module-wise count rates for Quadrant C Data is divided into 100 sec bins |
 |
 |
| Module-wise count rates for Quadrant D Data is divided into 100 sec bins |
 |
 |
| Parameter | Plot |
|---|---|
| CZT HV Monitor | 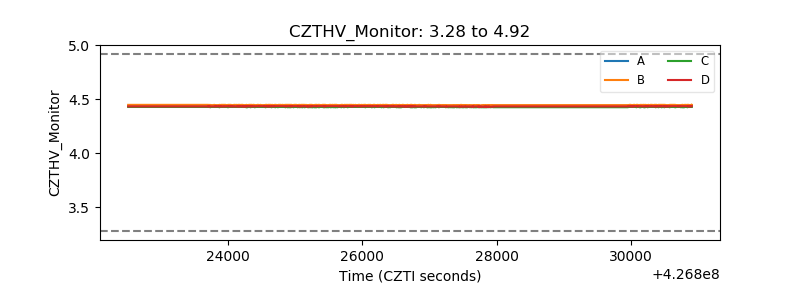 |
| D_VDD | 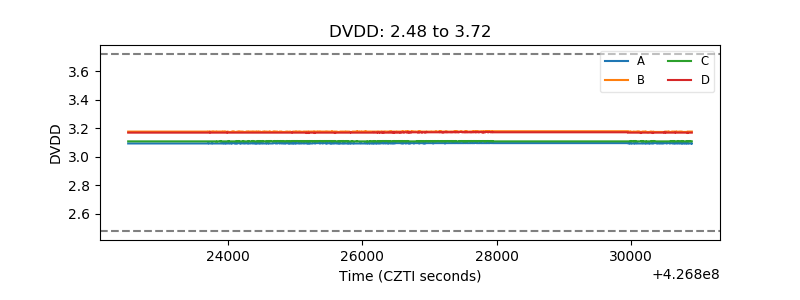 |
| Temperature 1 | 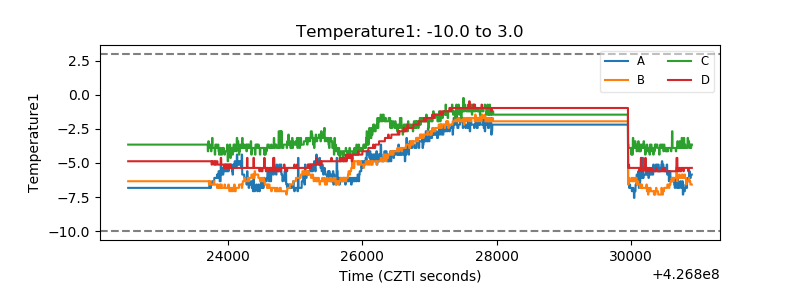 |
| Veto HV Monitor | 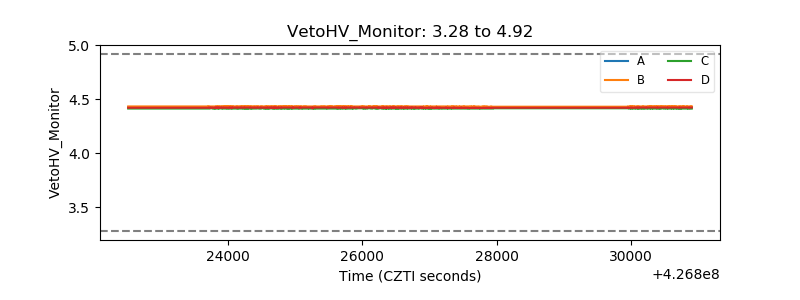 |
| Veto LLD | 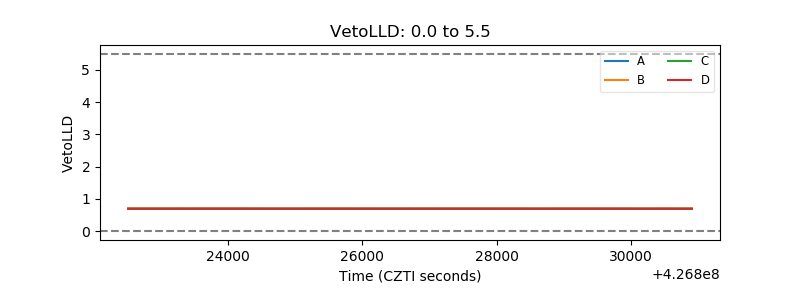 |
| Alpha Counter | 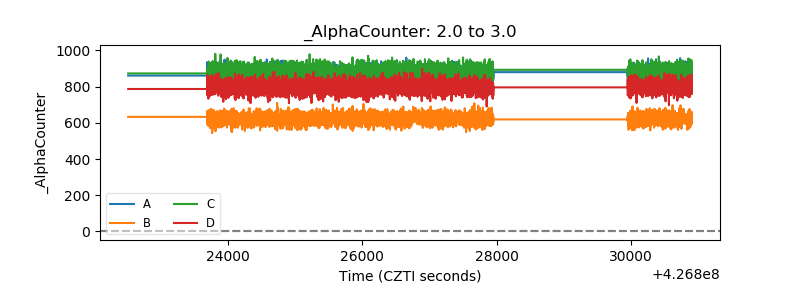 |
| _CPM_Rate | 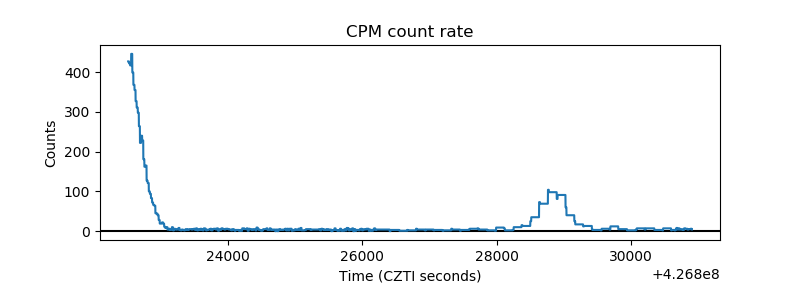 |
| CZT Counter | 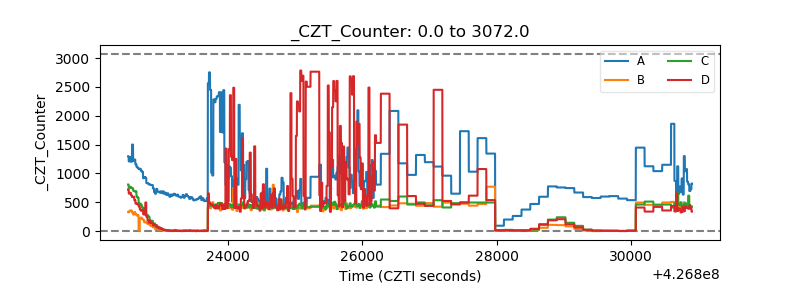 |
| +2.5 Volts monitor | 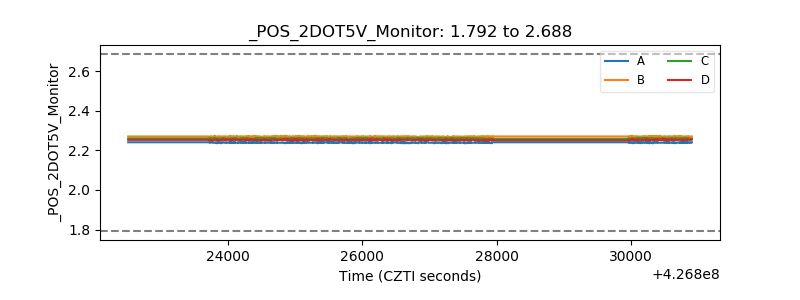 |
| +5 Volts monitor | 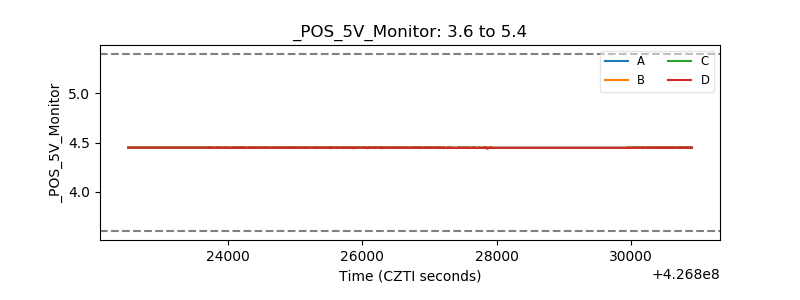 |
| _ROLL_ROT | 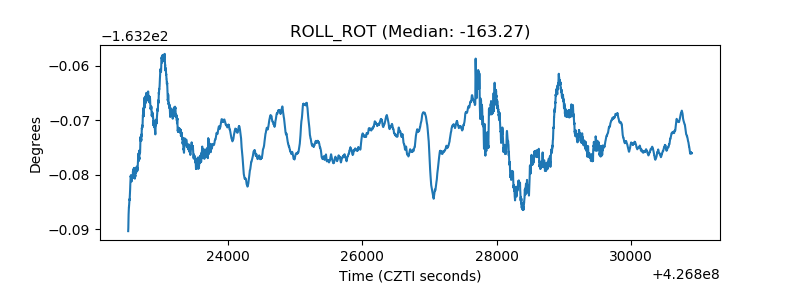 |
| _Roll_DEC | 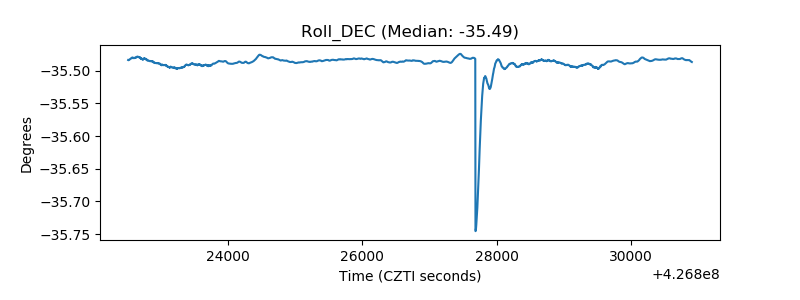 |
| _Roll_RA | 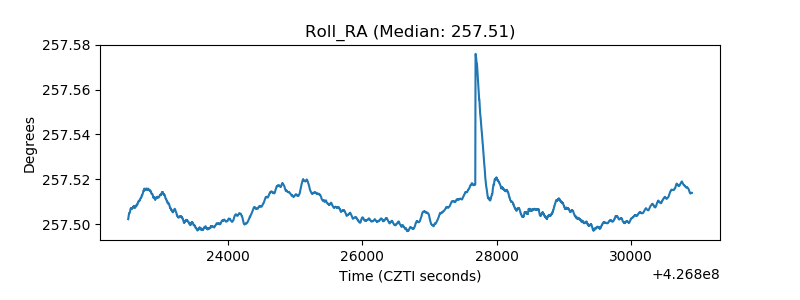 |
| Veto Counter | 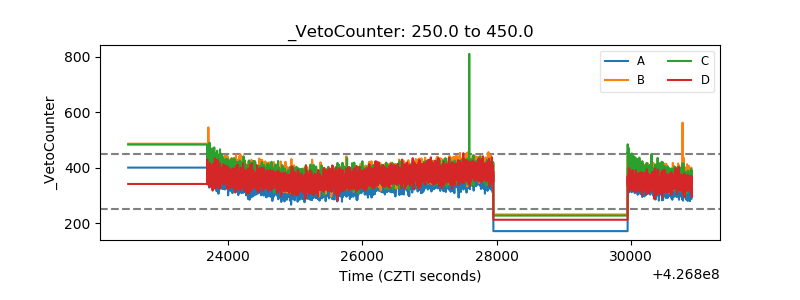 |