| Param | Original file | Final file |
|---|---|---|
| Filename | modeM0/AS1A12_088T08_9000005748_42101cztM0_level2.fits | modeM0/AS1A12_088T08_9000005748_42101cztM0_level2_quad_clean.evt |
| Size (bytes) | 476,064,000 | 90,501,120 |
| Size | 454.0 MB | 86.3 MB |
| Events in quadrant A | 8,131,317 | 510,932 |
| Events in quadrant B | 2,779,080 | 655,368 |
| Events in quadrant C | 2,718,915 | 617,160 |
| Events in quadrant D | 3,540,722 | 549,628 |
| Mode SS | |||
|---|---|---|---|
| Quadrant | BADHDUFLAG | Total packets | Discarded packets |
| A | 0 | 122 | 0 |
| B | 0 | 122 | 0 |
| C | 0 | 122 | 0 |
| D | 0 | 122 | 0 |
| Mode M0 | |||
|---|---|---|---|
| Quadrant | BADHDUFLAG | Total packets | Discarded packets |
| A | 0 | 28242 | 2 |
| B | 0 | 12372 | 2 |
| C | 0 | 11793 | 2 |
| D | 0 | 14792 | 2 |
| Mode M9 | |||
|---|---|---|---|
| Quadrant | BADHDUFLAG | Total packets | Discarded packets |
| A | 0 | 36 | 0 |
| B | 0 | 36 | 0 |
| C | 0 | 36 | 0 |
| D | 0 | 36 | 0 |
| Quadrant | Total seconds | Saturated seconds | Saturation percentage |
|---|---|---|---|
| A | 5819 | 1404 | 24.127857% |
| B | 5819 | 45 | 0.773329% |
| C | 5819 | 13 | 0.223406% |
| D | 5820 | 244 | 4.192440% |
Noise dominated data is calculated using 1-second bins in cleaned event files. If a bin has >2000 counts, and if more than 50% of those come from <1% of pixels, then it is considered to be noise-dominated and hence unusable.
| Quadrant | # 1 sec bins | Bins with >0 counts | Bins with >2000 counts | High rate bins dominated by noise | Noise dominated (total time) | Noise dominated (detector-on time) | Marked lightcurve |
|---|---|---|---|---|---|---|---|
| A | 9494 | 5821 | 1273 | 1273 | 13.41% | 21.87% | 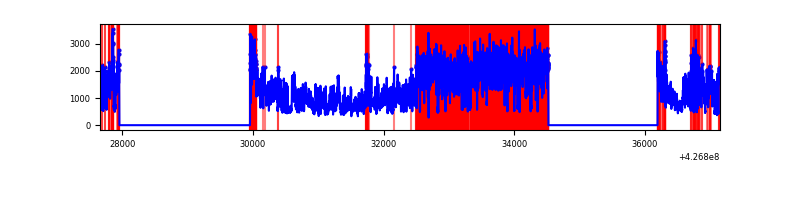 |
| B | 9494 | 5821 | 26 | 26 | 0.27% | 0.45% | 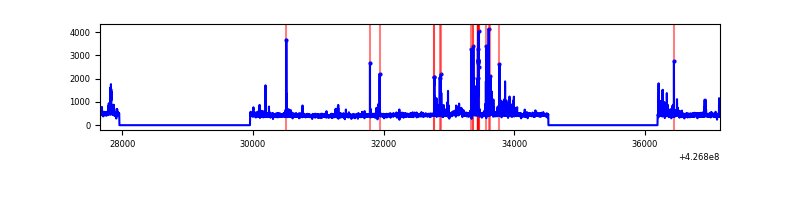 |
| C | 9494 | 5821 | 8 | 8 | 0.08% | 0.14% | 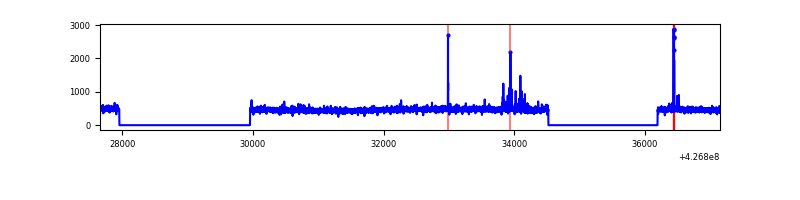 |
| D | 9495 | 5822 | 188 | 188 | 1.98% | 3.23% | 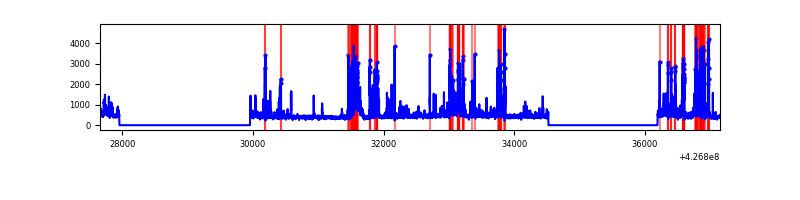 |
Top three noisy pixels from each quadrant. If the there are fewer than three noisy pixels in the level2.evt file, extra rows are filled as -1
| Pixel properties | Quadrant properties | ||||||
|---|---|---|---|---|---|---|---|
| Quadrant | DetID | PixID | Counts | Sigma | Mean | Median | Sigma |
| A | 15 | 222 | 5232473 | 41659.52 | 605 | 591 | 125.6 |
| A | 10 | 83 | 550432 | 4378.18 | 605 | 591 | 125.6 |
| A | 3 | 137 | 6846 | 49.81 | 605 | 591 | 125.6 |
| B | 5 | 255 | 221848 | 1795.65 | 634 | 616 | 123.2 |
| B | 4 | 81 | 25816 | 204.54 | 634 | 616 | 123.2 |
| B | 3 | 112 | 22695 | 179.21 | 634 | 616 | 123.2 |
| C | 15 | 214 | 241837 | 1652.99 | 621 | 623 | 145.9 |
| C | 15 | 159 | 43548 | 294.16 | 621 | 623 | 145.9 |
| C | 15 | 111 | 7702 | 48.51 | 621 | 623 | 145.9 |
| D | 12 | 6 | 716081 | 4821.91 | 607 | 589 | 148.4 |
| D | 2 | 249 | 217460 | 1461.56 | 607 | 589 | 148.4 |
| D | 13 | 249 | 144767 | 971.66 | 607 | 589 | 148.4 |
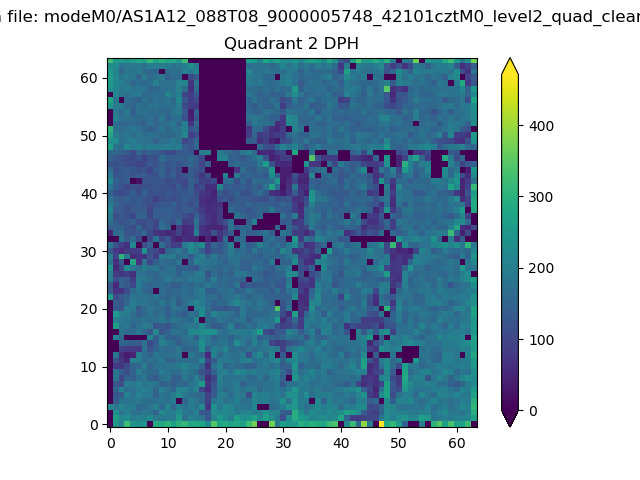
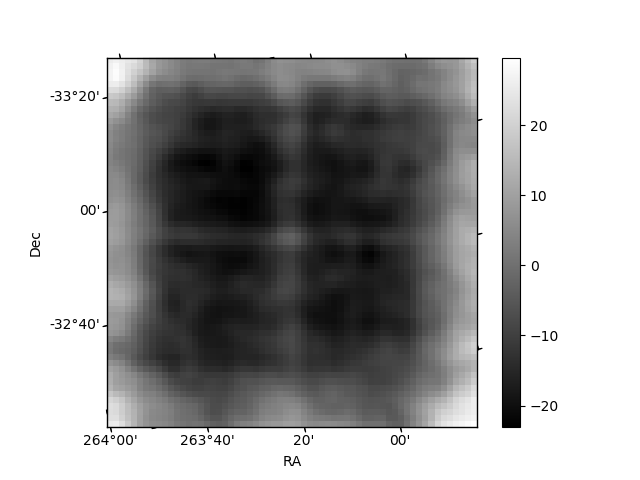
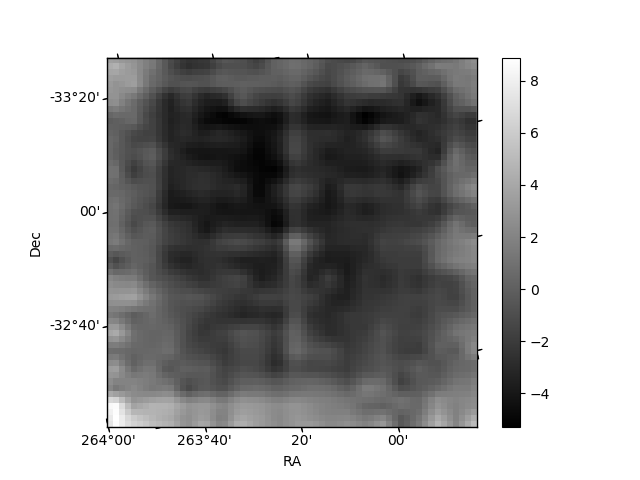
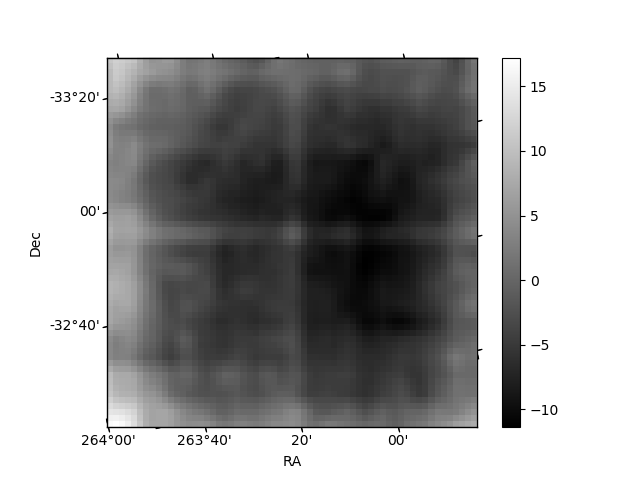
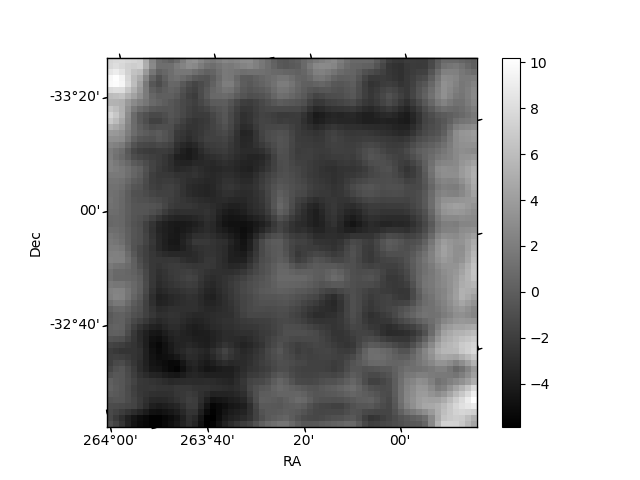
Histogram calculated using DETX and DETY for each event in the final _common_clean file
| Quadrant A | 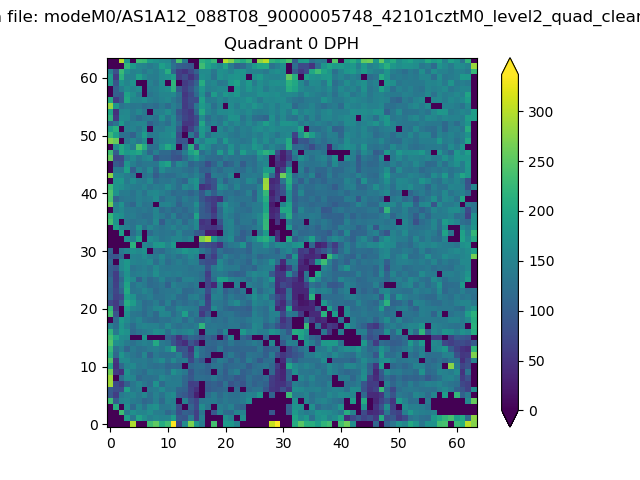 |
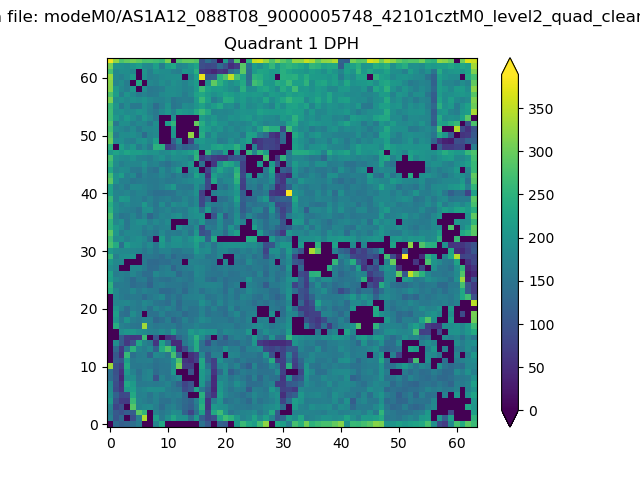 |
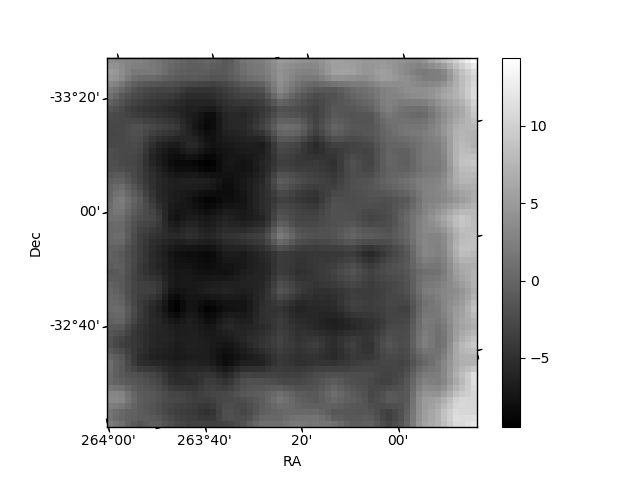
Quadrant B |
|---|---|---|---|
| Quadrant D | 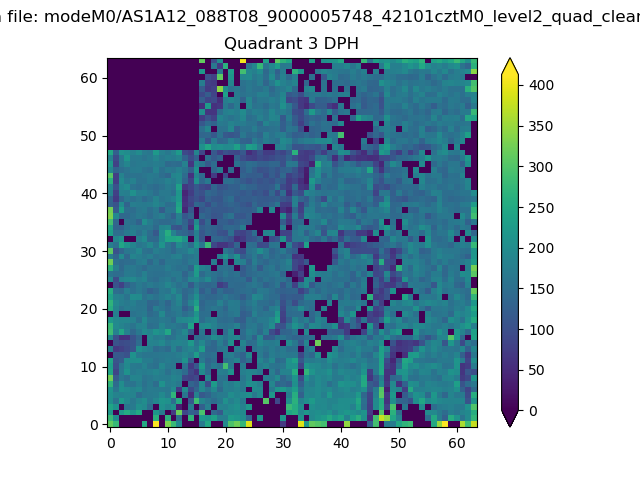 |
 |
Quadrant C |
| Plot type | Count rate plots | Images |
|---|---|---|
| Comparison with Poisson distribution Blue bars denote a histogram of data divided into 1 sec bins. Red curve is a Poisson curve with rate = median count rate of data. |
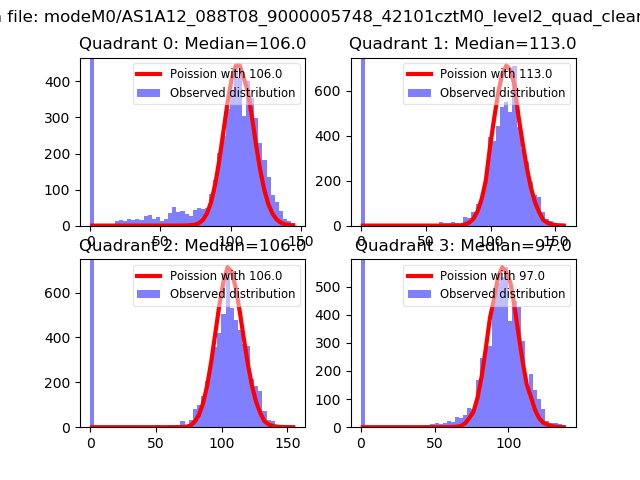 |
 |
| Quadrant-wise count rates Data is divided into 100 sec bins |
 |
|
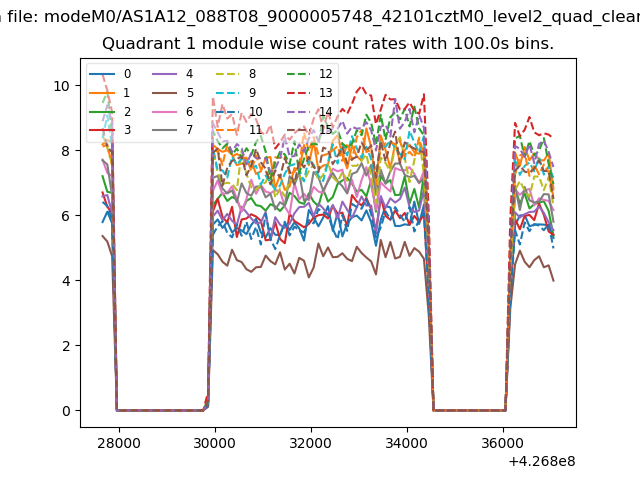
| Module-wise count rates for Quadrant A Data is divided into 100 sec bins |
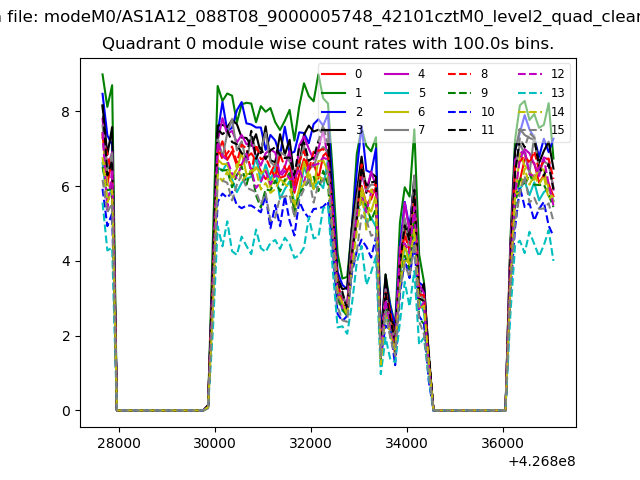 |
 |
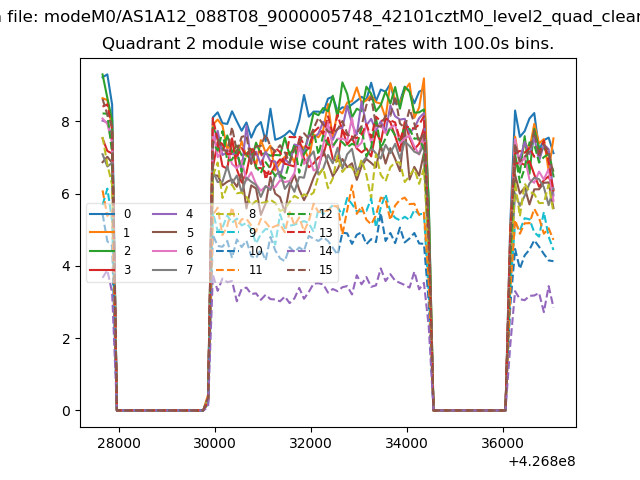
| Module-wise count rates for Quadrant B Data is divided into 100 sec bins |
 |
 |
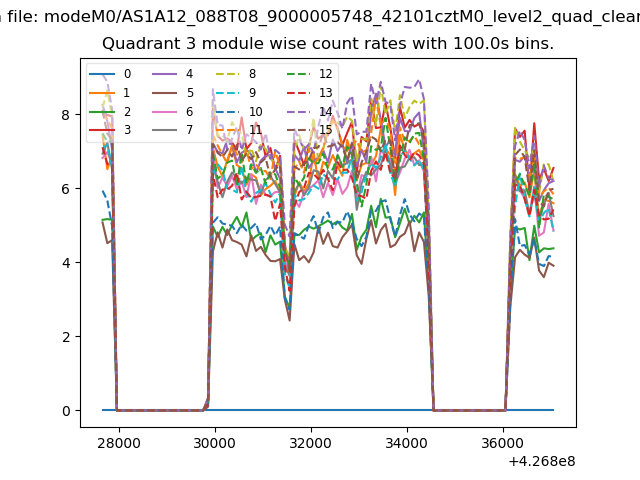
| Module-wise count rates for Quadrant C Data is divided into 100 sec bins |
 |
 |
| Module-wise count rates for Quadrant D Data is divided into 100 sec bins |
 |
 |
| Parameter | Plot |
|---|---|
| CZT HV Monitor | 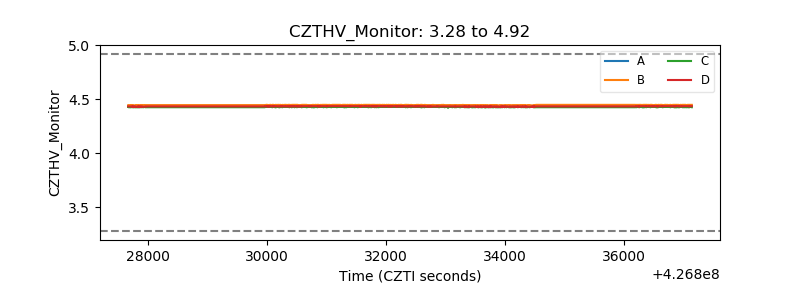 |
| D_VDD | 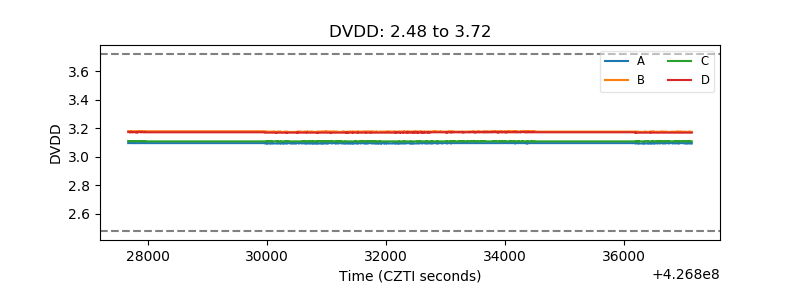 |
| Temperature 1 | 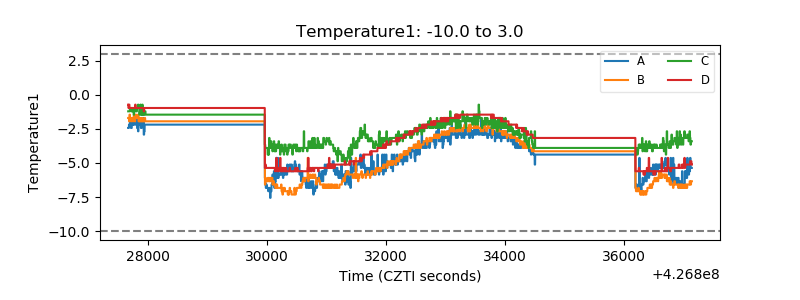 |
| Veto HV Monitor | 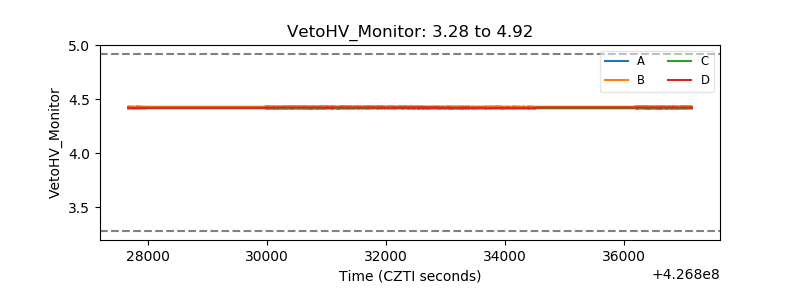 |
| Veto LLD | 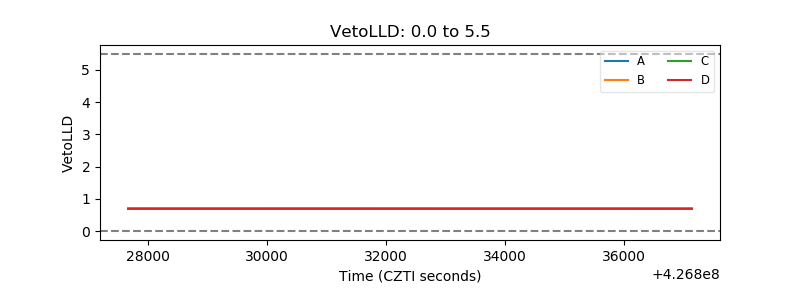 |
| Alpha Counter | 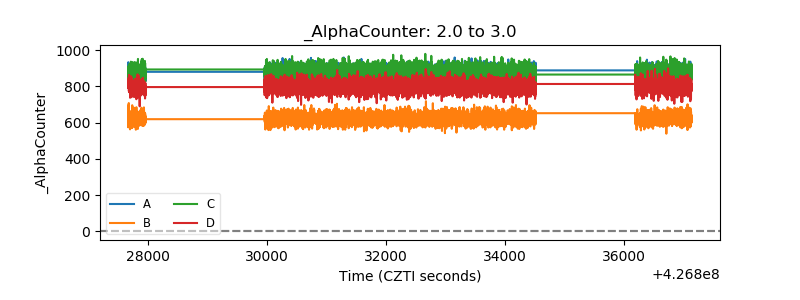 |
| _CPM_Rate | 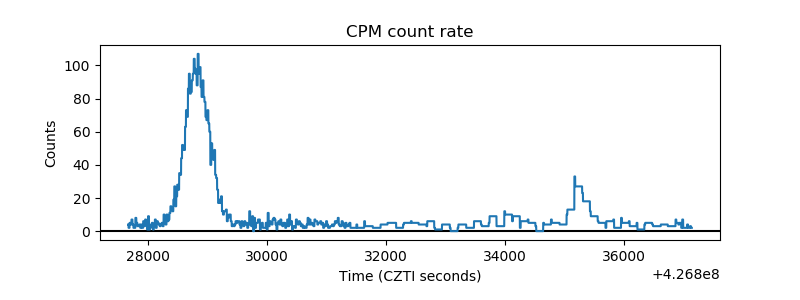 |
| CZT Counter | 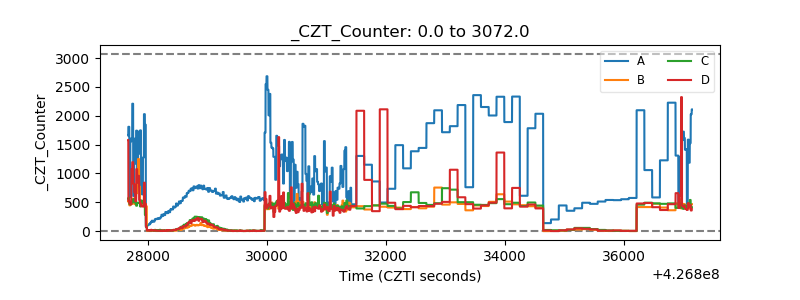 |
| +2.5 Volts monitor | 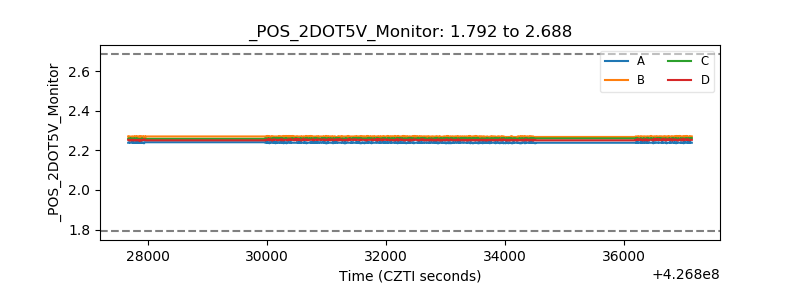 |
| +5 Volts monitor | 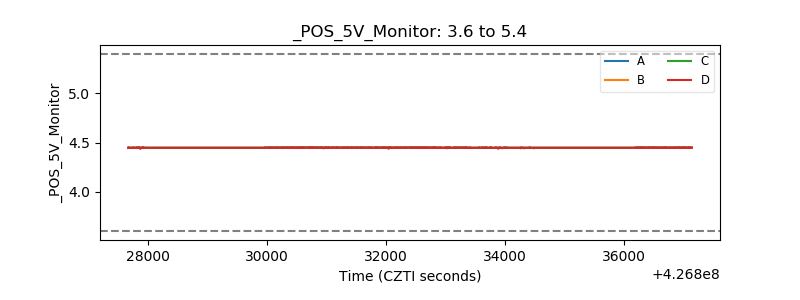 |
| _ROLL_ROT | 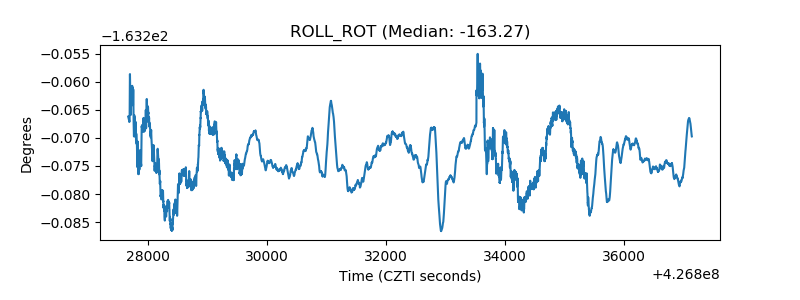 |
| _Roll_DEC | 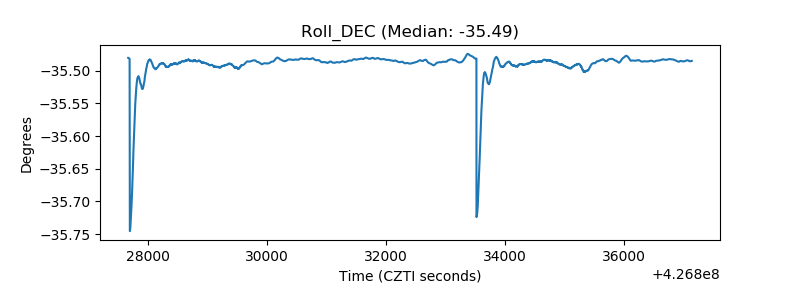 |
| _Roll_RA | 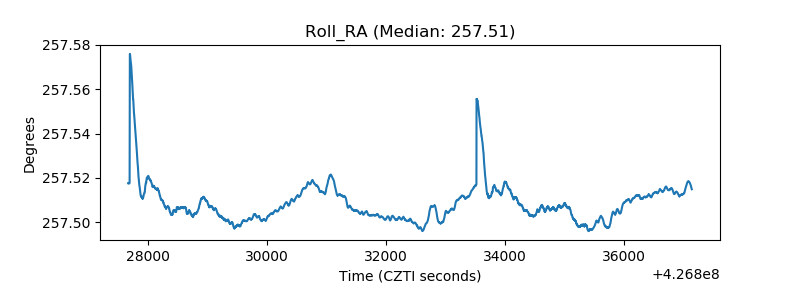 |
| Veto Counter | 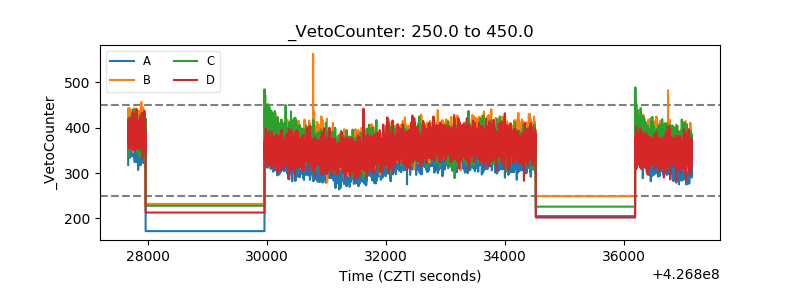 |