| Param | Original file | Final file |
|---|---|---|
| Filename | modeM0/AS1A12_088T08_9000005748_42102cztM0_level2.fits | modeM0/AS1A12_088T08_9000005748_42102cztM0_level2_quad_clean.evt |
| Size (bytes) | 283,527,360 | 62,651,520 |
| Size | 270.4 MB | 59.7 MB |
| Events in quadrant A | 4,328,930 | 411,227 |
| Events in quadrant B | 1,710,113 | 435,017 |
| Events in quadrant C | 1,811,538 | 408,990 |
| Events in quadrant D | 2,340,496 | 366,670 |
| Mode SS | |||
|---|---|---|---|
| Quadrant | BADHDUFLAG | Total packets | Discarded packets |
| A | 0 | 80 | 0 |
| B | 0 | 80 | 0 |
| C | 0 | 80 | 0 |
| D | 0 | 80 | 0 |
| Mode M0 | |||
|---|---|---|---|
| Quadrant | BADHDUFLAG | Total packets | Discarded packets |
| A | 0 | 15482 | 1 |
| B | 0 | 7913 | 1 |
| C | 0 | 7892 | 1 |
| D | 0 | 9798 | 1 |
| Mode M9 | |||
|---|---|---|---|
| Quadrant | BADHDUFLAG | Total packets | Discarded packets |
| A | 0 | 15 | 0 |
| B | 0 | 16 | 0 |
| C | 0 | 16 | 0 |
| D | 0 | 16 | 0 |
| Quadrant | Total seconds | Saturated seconds | Saturation percentage |
|---|---|---|---|
| A | 3898 | 200 | 5.130836% |
| B | 3898 | 7 | 0.179579% |
| C | 3898 | 11 | 0.282196% |
| D | 3898 | 143 | 3.668548% |
Noise dominated data is calculated using 1-second bins in cleaned event files. If a bin has >2000 counts, and if more than 50% of those come from <1% of pixels, then it is considered to be noise-dominated and hence unusable.
| Quadrant | # 1 sec bins | Bins with >0 counts | Bins with >2000 counts | High rate bins dominated by noise | Noise dominated (total time) | Noise dominated (detector-on time) | Marked lightcurve |
|---|---|---|---|---|---|---|---|
| A | 3898 | 3898 | 136 | 136 | 3.49% | 3.49% | 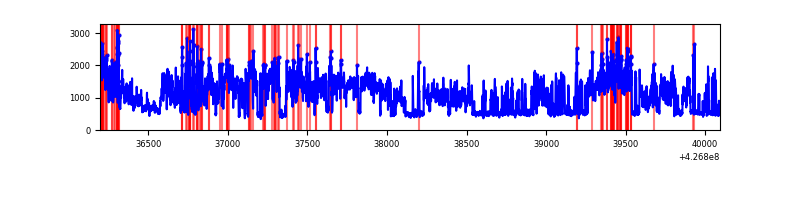 |
| B | 3898 | 3898 | 1 | 1 | 0.03% | 0.03% | 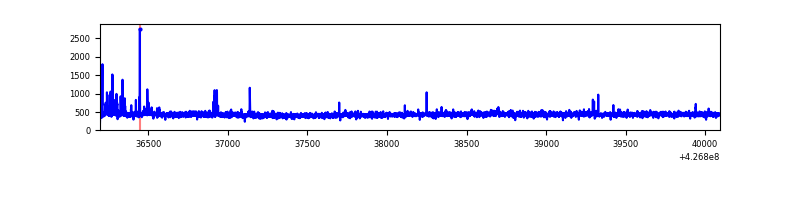 |
| C | 3898 | 3898 | 6 | 6 | 0.15% | 0.15% |  |
| D | 3898 | 3898 | 111 | 111 | 2.85% | 2.85% | 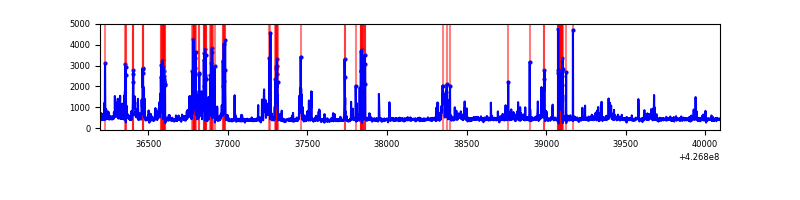 |
Top three noisy pixels from each quadrant. If the there are fewer than three noisy pixels in the level2.evt file, extra rows are filled as -1
| Pixel properties | Quadrant properties | ||||||
|---|---|---|---|---|---|---|---|
| Quadrant | DetID | PixID | Counts | Sigma | Mean | Median | Sigma |
| A | 15 | 222 | 2356523 | 26753.57 | 419 | 410 | 88.1 |
| A | 10 | 83 | 351196 | 3983.16 | 419 | 410 | 88.1 |
| A | 3 | 137 | 4776 | 49.58 | 419 | 410 | 88.1 |
| B | 5 | 255 | 45477 | 540.45 | 421 | 409 | 83.4 |
| B | 12 | 111 | 10570 | 121.85 | 421 | 409 | 83.4 |
| B | 11 | 111 | 9794 | 112.54 | 421 | 409 | 83.4 |
| C | 15 | 214 | 159409 | 1644.36 | 413 | 414 | 96.7 |
| C | 15 | 159 | 30678 | 312.99 | 413 | 414 | 96.7 |
| C | 12 | 249 | 5774 | 55.43 | 413 | 414 | 96.7 |
| D | 12 | 6 | 486195 | 4870.91 | 404 | 392 | 99.7 |
| D | 10 | 199 | 102637 | 1025.16 | 404 | 392 | 99.7 |
| D | 13 | 249 | 84954 | 847.86 | 404 | 392 | 99.7 |
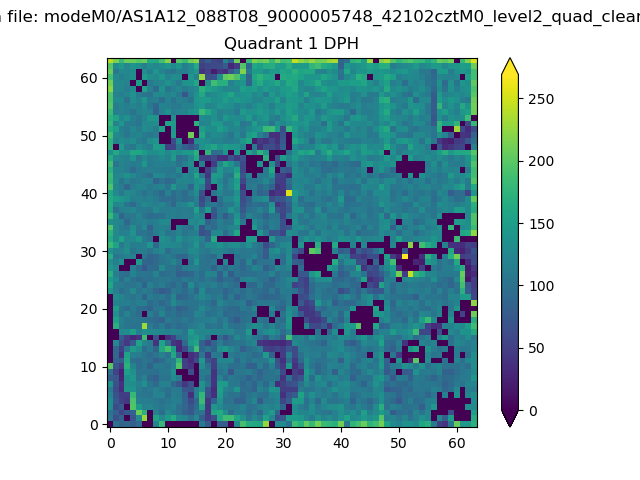
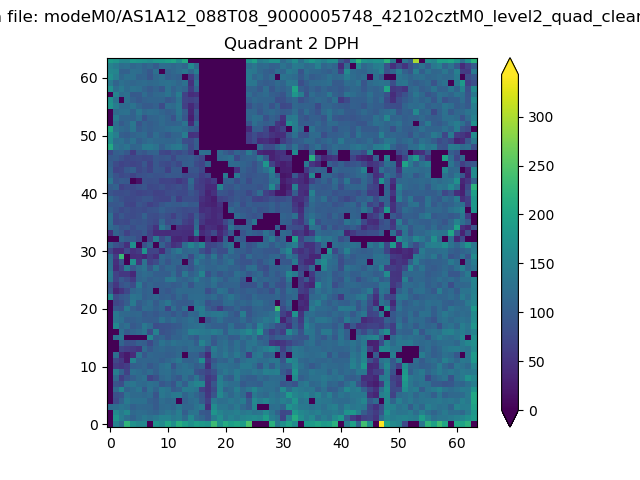
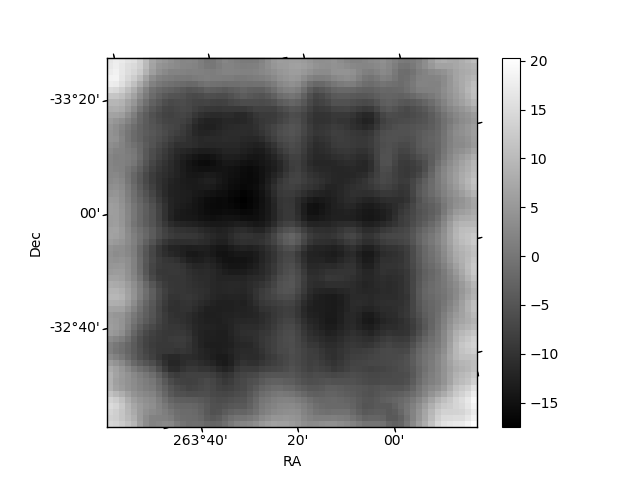
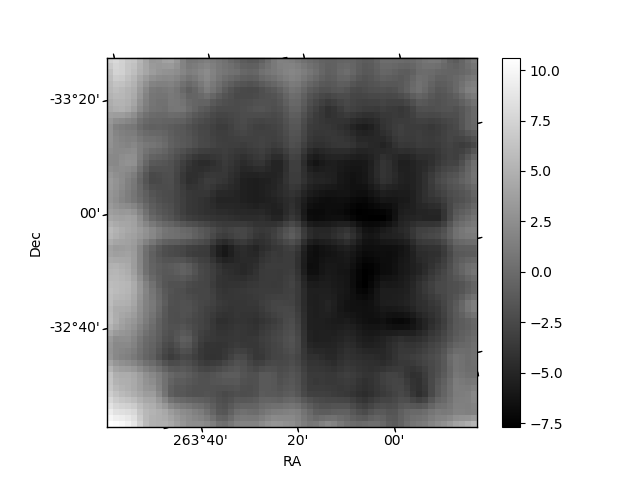
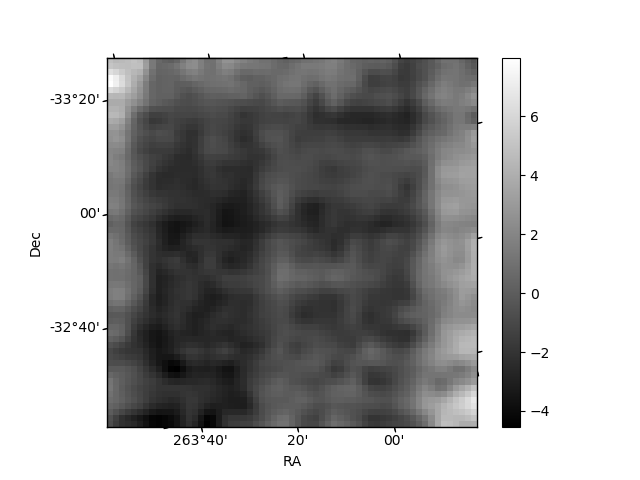
Histogram calculated using DETX and DETY for each event in the final _common_clean file
| Quadrant A | 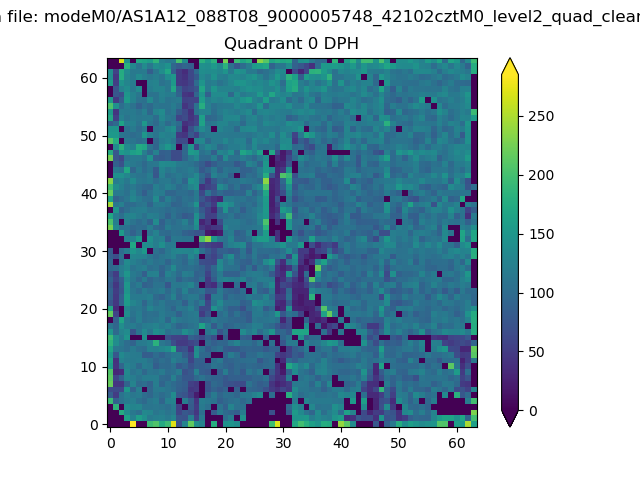 |
 |
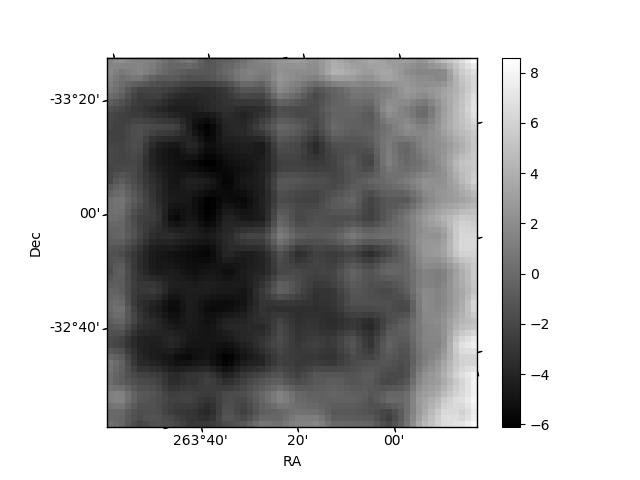
Quadrant B |
|---|---|---|---|
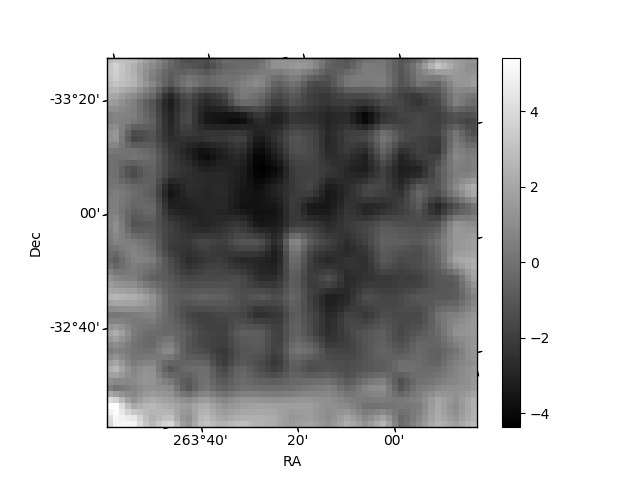
| Quadrant D | 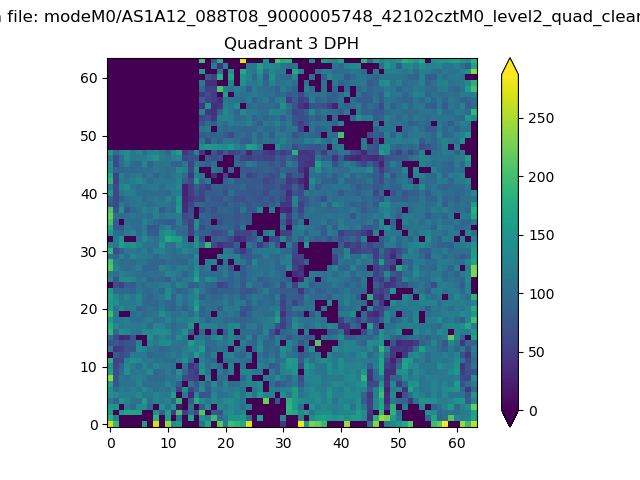 |
 |
Quadrant C |
| Plot type | Count rate plots | Images |
|---|---|---|
| Comparison with Poisson distribution Blue bars denote a histogram of data divided into 1 sec bins. Red curve is a Poisson curve with rate = median count rate of data. |
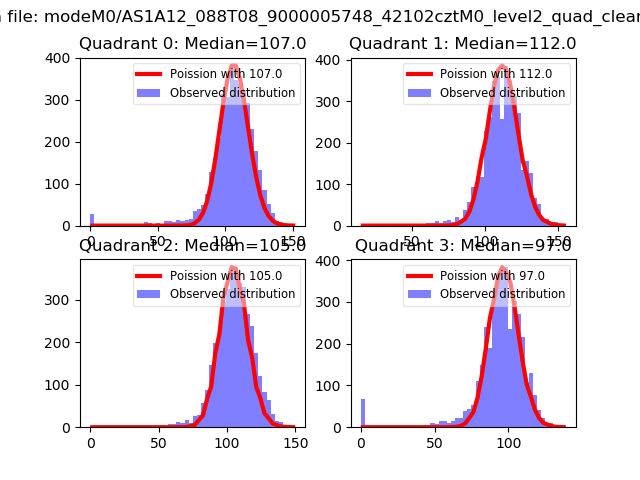 |
 |
| Quadrant-wise count rates Data is divided into 100 sec bins |
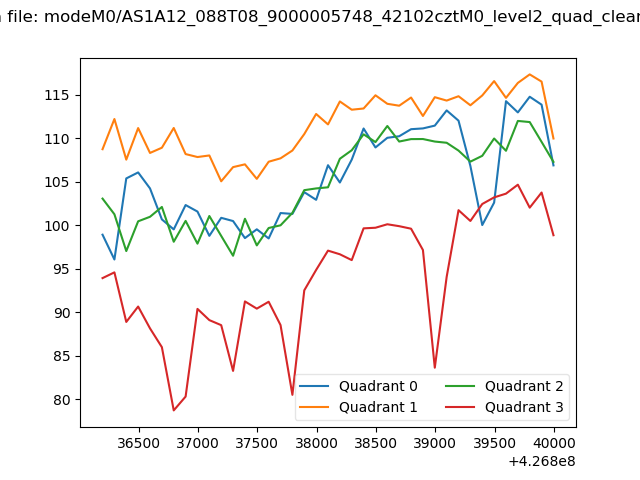 |
|
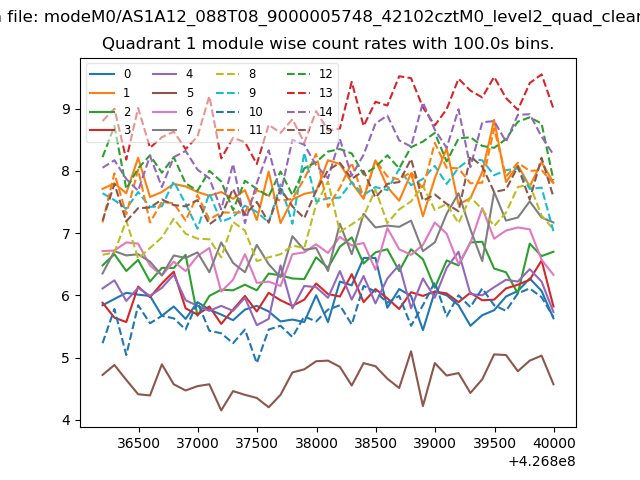
| Module-wise count rates for Quadrant A Data is divided into 100 sec bins |
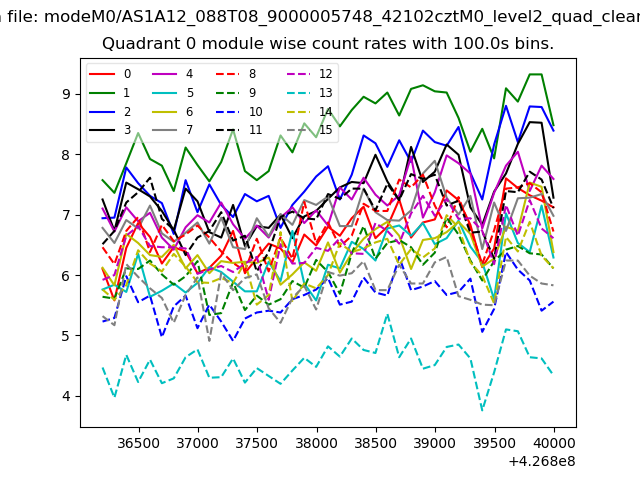 |
 |
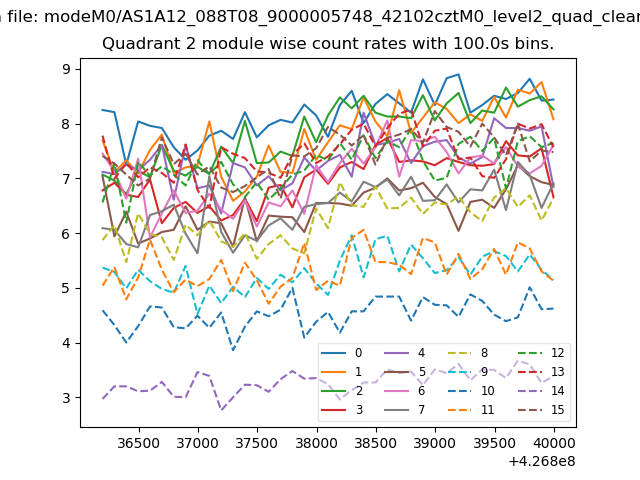
| Module-wise count rates for Quadrant B Data is divided into 100 sec bins |
 |
 |
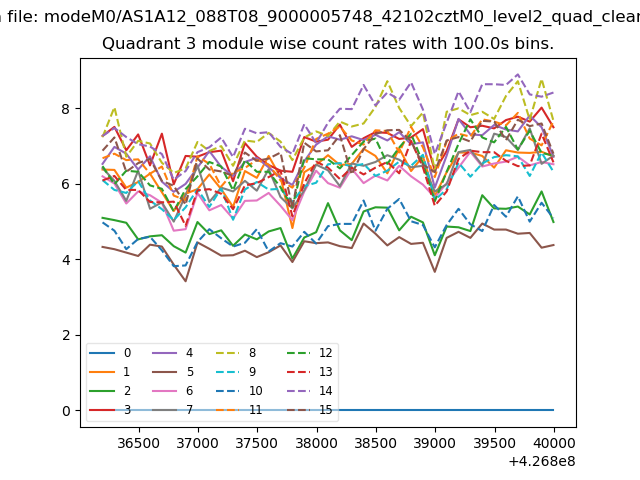
| Module-wise count rates for Quadrant C Data is divided into 100 sec bins |
 |
 |
| Module-wise count rates for Quadrant D Data is divided into 100 sec bins |
 |
 |
| Parameter | Plot |
|---|---|
| CZT HV Monitor | 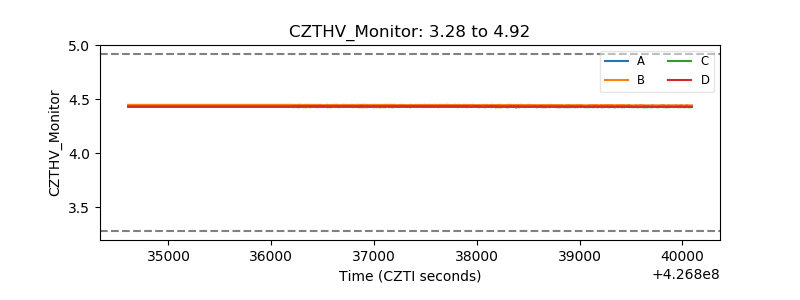 |
| D_VDD | 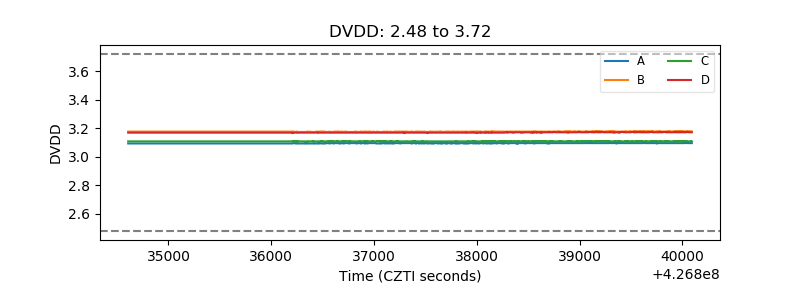 |
| Temperature 1 | 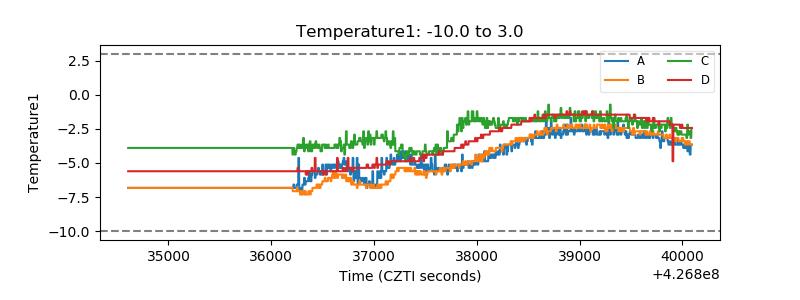 |
| Veto HV Monitor |  |
| Veto LLD | 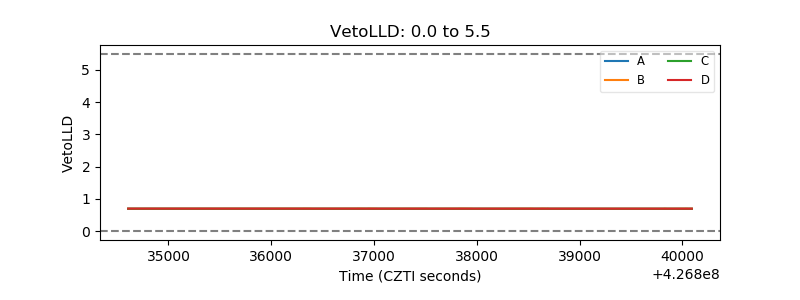 |
| Alpha Counter | 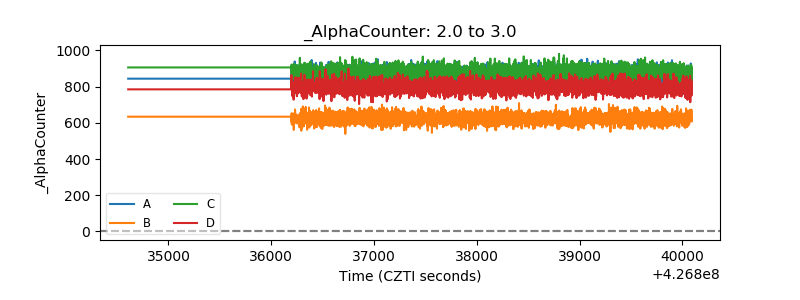 |
| _CPM_Rate | 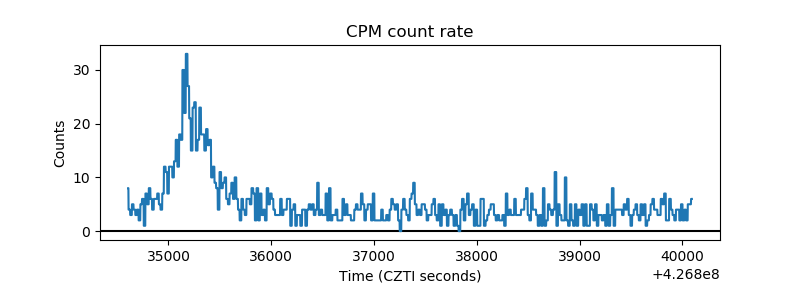 |
| CZT Counter | 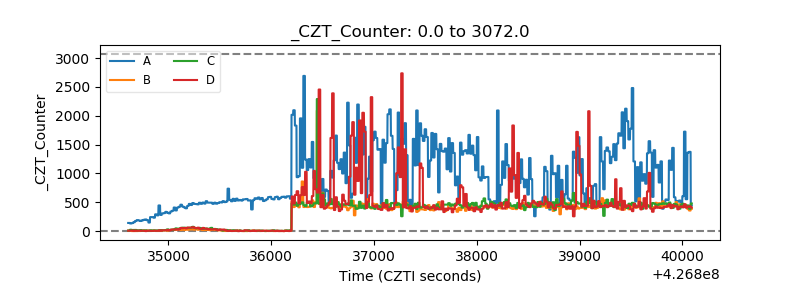 |
| +2.5 Volts monitor |  |
| +5 Volts monitor |  |
| _ROLL_ROT | 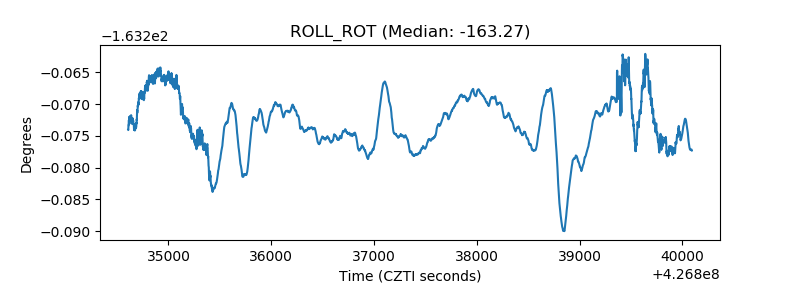 |
| _Roll_DEC | 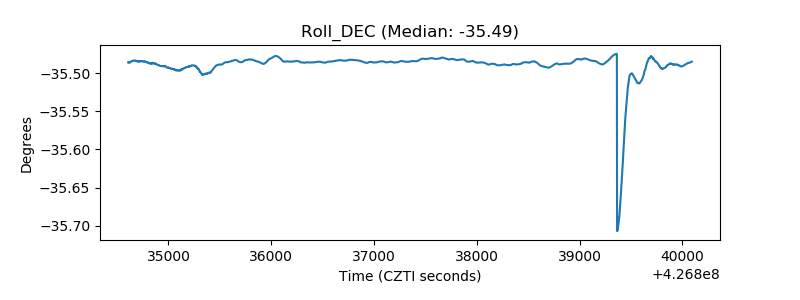 |
| _Roll_RA | 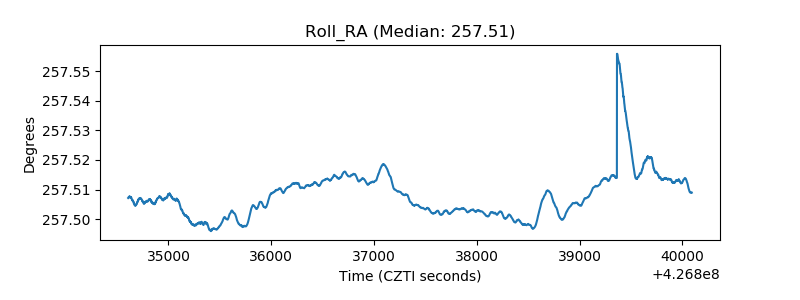 |
| Veto Counter | 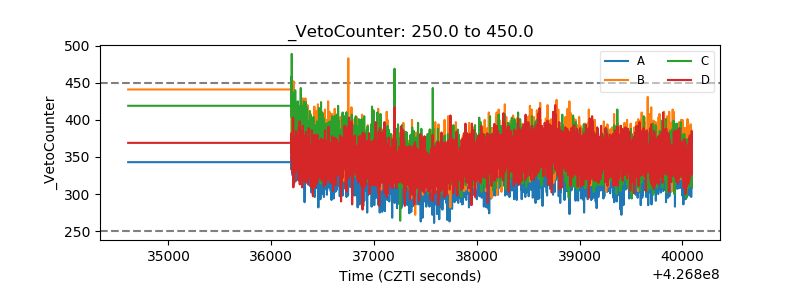 |