| Param | Original file | Final file |
|---|---|---|
| Filename | modeM0/AS1A12_099T03_9000005746_42096cztM0_level2.fits | modeM0/AS1A12_099T03_9000005746_42096cztM0_level2_quad_clean.evt |
| Size (bytes) | 394,525,440 | 87,612,480 |
| Size | 376.2 MB | 83.6 MB |
| Events in quadrant A | 6,654,847 | 553,520 |
| Events in quadrant B | 2,340,561 | 625,322 |
| Events in quadrant C | 2,450,772 | 585,682 |
| Events in quadrant D | 2,762,731 | 531,749 |
| Mode M0 | |||
|---|---|---|---|
| Quadrant | BADHDUFLAG | Total packets | Discarded packets |
| A | 0 | 23323 | 2 |
| B | 0 | 10352 | 2 |
| C | 0 | 10282 | 2 |
| D | 0 | 11826 | 2 |
| Mode M9 | |||
|---|---|---|---|
| Quadrant | BADHDUFLAG | Total packets | Discarded packets |
| A | 0 | 29 | 0 |
| B | 0 | 30 | 0 |
| C | 0 | 30 | 0 |
| D | 0 | 30 | 0 |
| Mode SS | |||
|---|---|---|---|
| Quadrant | BADHDUFLAG | Total packets | Discarded packets |
| A | 0 | 106 | 0 |
| B | 0 | 106 | 0 |
| C | 0 | 106 | 0 |
| D | 0 | 106 | 0 |
| Quadrant | Total seconds | Saturated seconds | Saturation percentage |
|---|---|---|---|
| A | 5084 | 649 | 12.765539% |
| B | 5084 | 14 | 0.275374% |
| C | 5084 | 5 | 0.098348% |
| D | 5084 | 117 | 2.301338% |
Noise dominated data is calculated using 1-second bins in cleaned event files. If a bin has >2000 counts, and if more than 50% of those come from <1% of pixels, then it is considered to be noise-dominated and hence unusable.
| Quadrant | # 1 sec bins | Bins with >0 counts | Bins with >2000 counts | High rate bins dominated by noise | Noise dominated (total time) | Noise dominated (detector-on time) | Marked lightcurve |
|---|---|---|---|---|---|---|---|
| A | 7027 | 5085 | 578 | 578 | 8.23% | 11.37% | 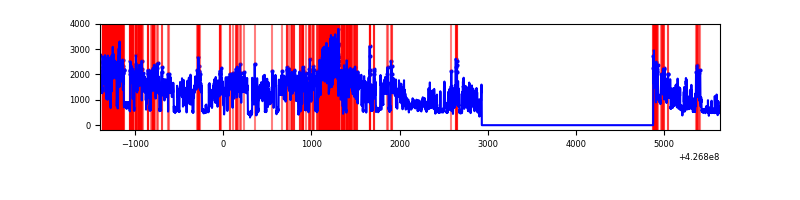 |
| B | 7027 | 5085 | 5 | 5 | 0.07% | 0.10% | 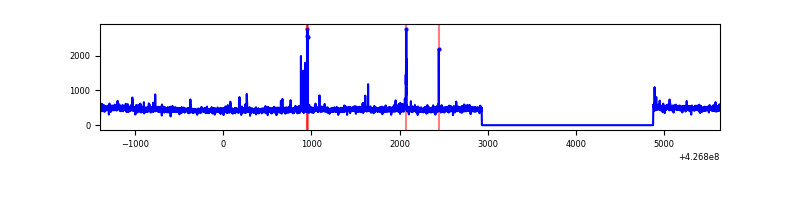 |
| C | 7027 | 5085 | 0 | 0 | 0.00% | 0.00% | 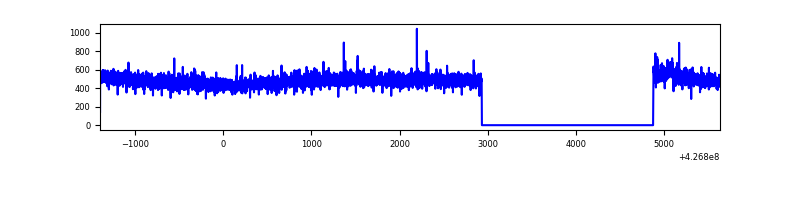 |
| D | 7027 | 5085 | 92 | 92 | 1.31% | 1.81% | 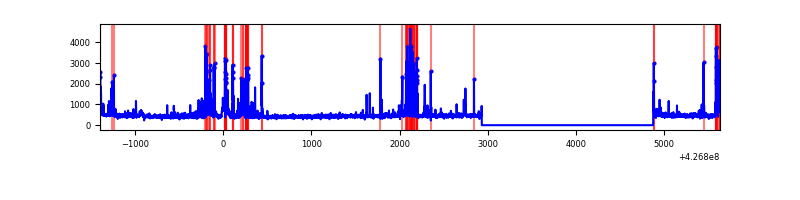 |
Top three noisy pixels from each quadrant. If the there are fewer than three noisy pixels in the level2.evt file, extra rows are filled as -1
| Pixel properties | Quadrant properties | ||||||
|---|---|---|---|---|---|---|---|
| Quadrant | DetID | PixID | Counts | Sigma | Mean | Median | Sigma |
| A | 15 | 222 | 3968941 | 34790.98 | 563 | 553 | 114.1 |
| A | 10 | 83 | 483326 | 4232.49 | 563 | 553 | 114.1 |
| A | 15 | 223 | 21371 | 182.51 | 563 | 553 | 114.1 |
| B | 5 | 255 | 42984 | 385.24 | 578 | 563 | 110.1 |
| B | 3 | 112 | 26089 | 231.81 | 578 | 563 | 110.1 |
| B | 12 | 111 | 14150 | 123.39 | 578 | 563 | 110.1 |
| C | 15 | 214 | 212212 | 1623.1 | 566 | 570 | 130.4 |
| C | 15 | 159 | 16893 | 125.18 | 566 | 570 | 130.4 |
| C | 8 | 79 | 13576 | 99.74 | 566 | 570 | 130.4 |
| D | 12 | 6 | 325521 | 2382.97 | 558 | 542 | 136.4 |
| D | 13 | 249 | 109810 | 801.23 | 558 | 542 | 136.4 |
| D | 1 | 52 | 96486 | 703.53 | 558 | 542 | 136.4 |
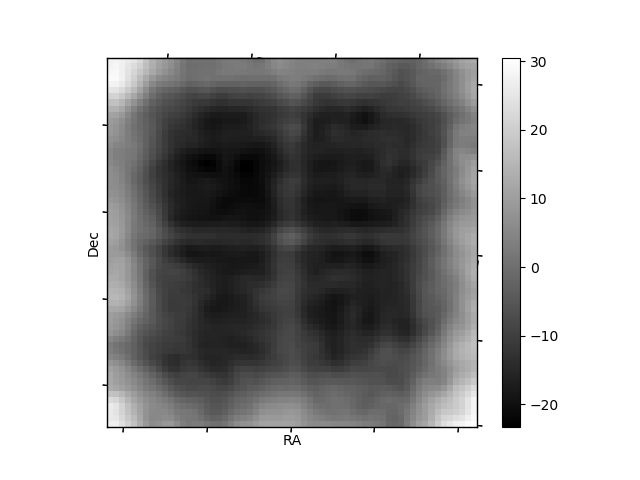
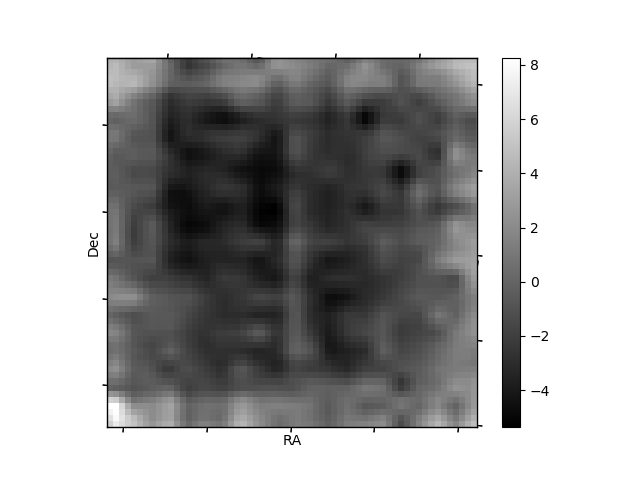
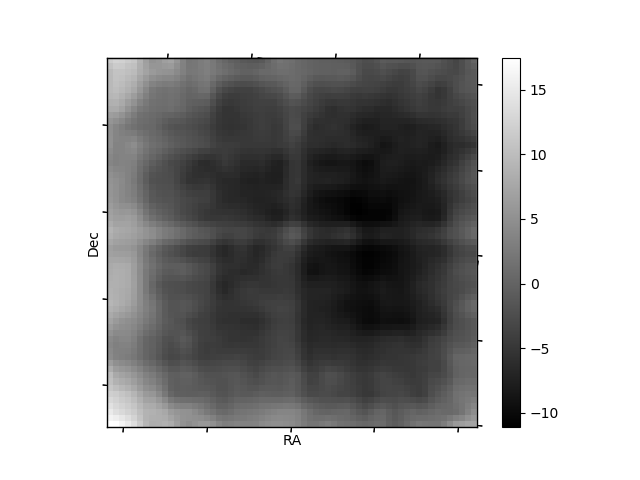
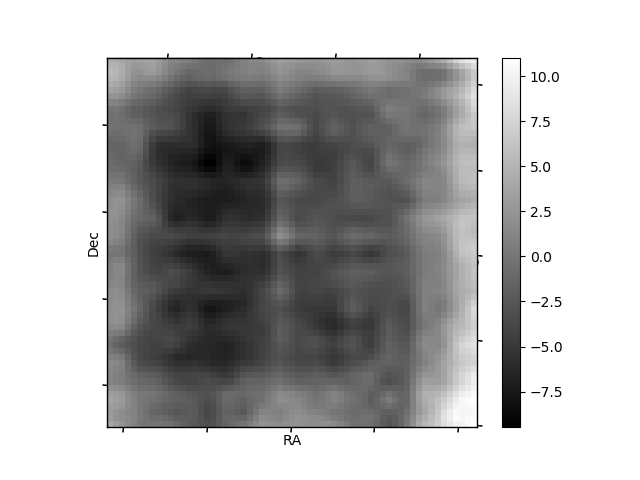
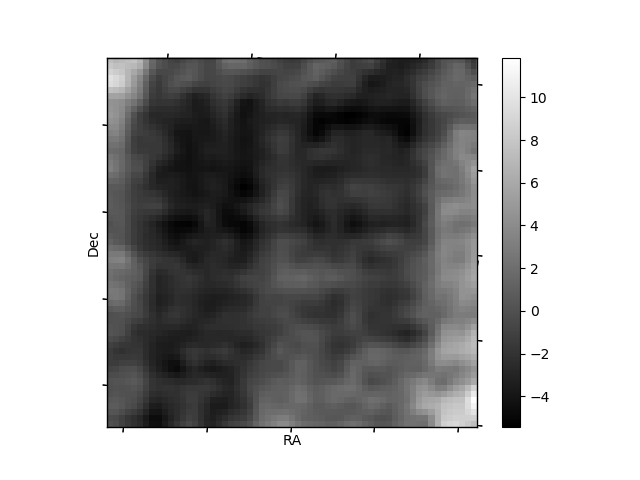
Histogram calculated using DETX and DETY for each event in the final _common_clean file
| Quadrant A | 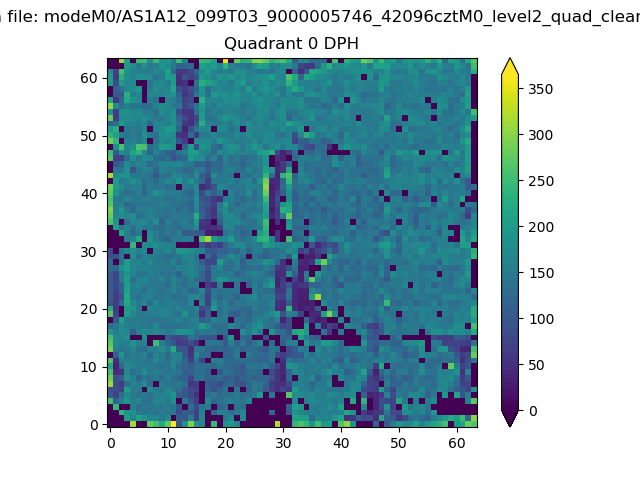 |
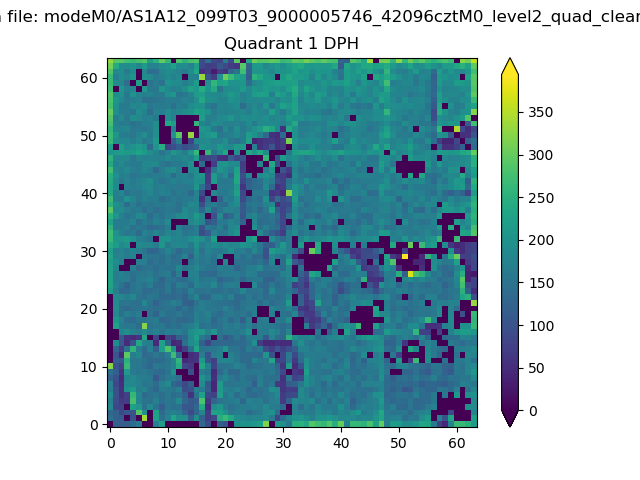 |
Quadrant B |
|---|---|---|---|
| Quadrant D | 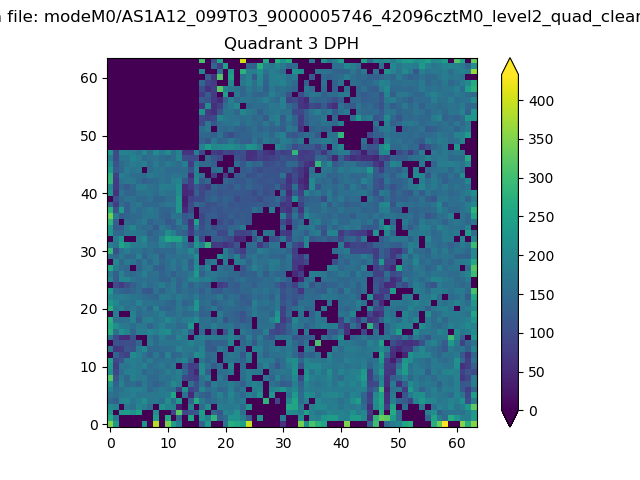 |
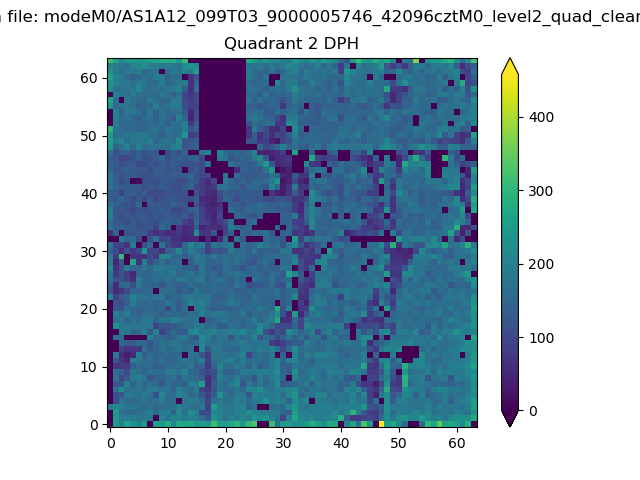 |
Quadrant C |
| Plot type | Count rate plots | Images |
|---|---|---|
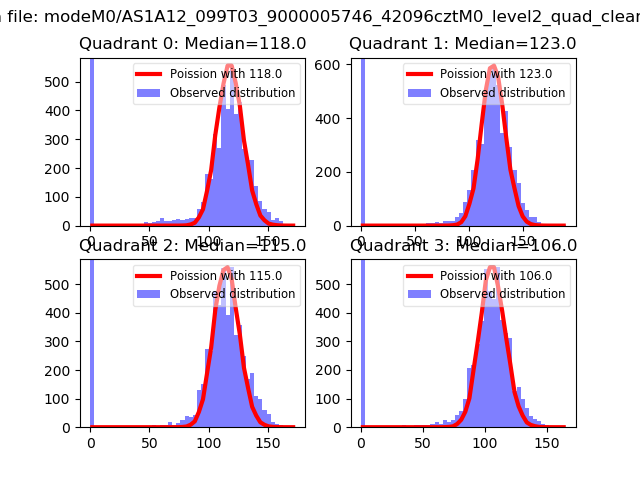
| Comparison with Poisson distribution Blue bars denote a histogram of data divided into 1 sec bins. Red curve is a Poisson curve with rate = median count rate of data. |
 |
 |
| Quadrant-wise count rates Data is divided into 100 sec bins |
 |
|
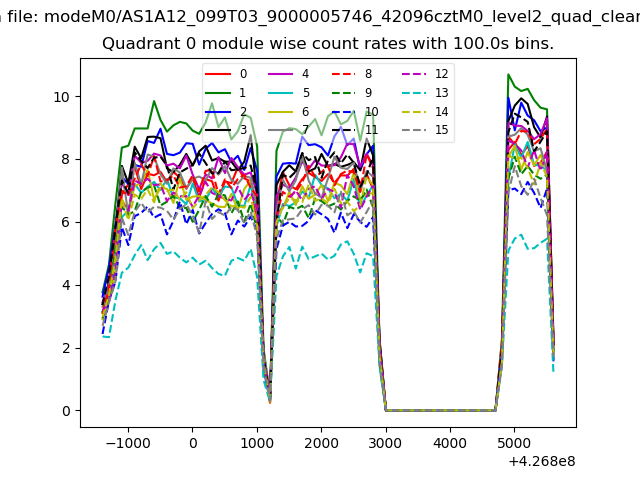
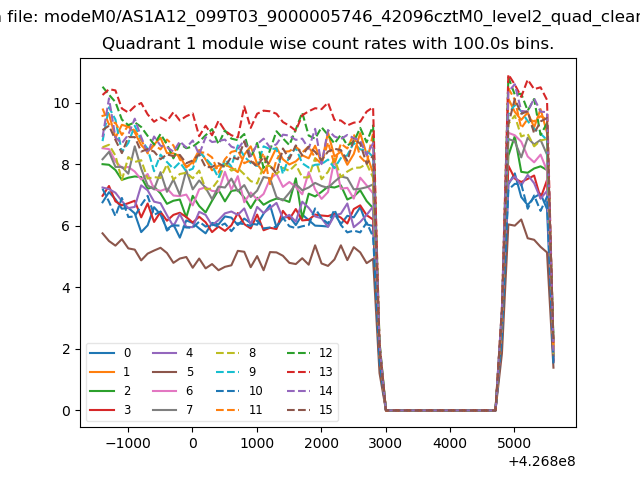
| Module-wise count rates for Quadrant A Data is divided into 100 sec bins |
 |
 |
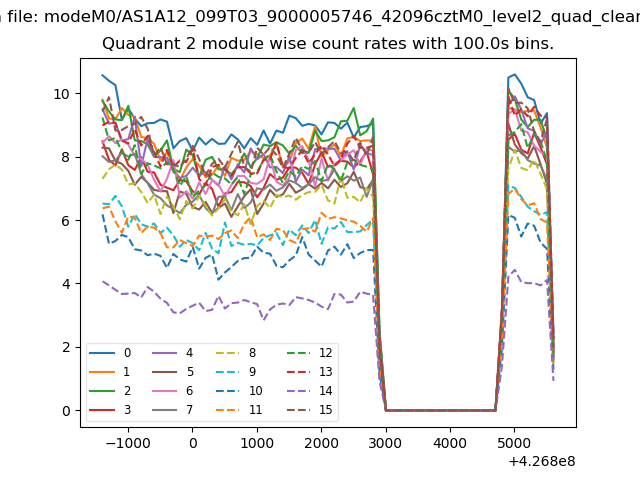
| Module-wise count rates for Quadrant B Data is divided into 100 sec bins |
 |
 |
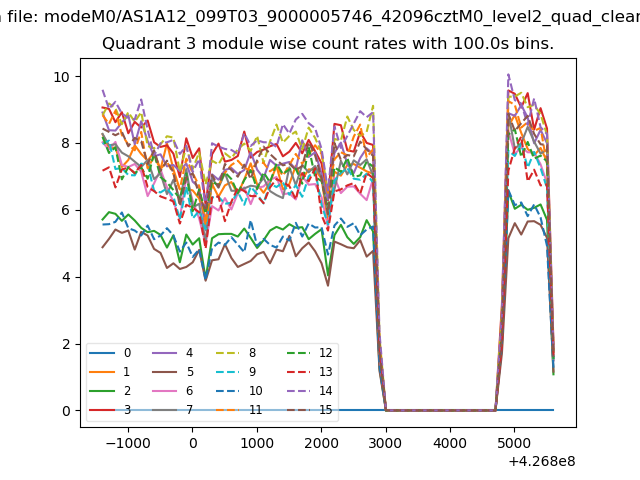
| Module-wise count rates for Quadrant C Data is divided into 100 sec bins |
 |
 |
| Module-wise count rates for Quadrant D Data is divided into 100 sec bins |
 |
 |
| Parameter | Plot |
|---|---|
| CZT HV Monitor | 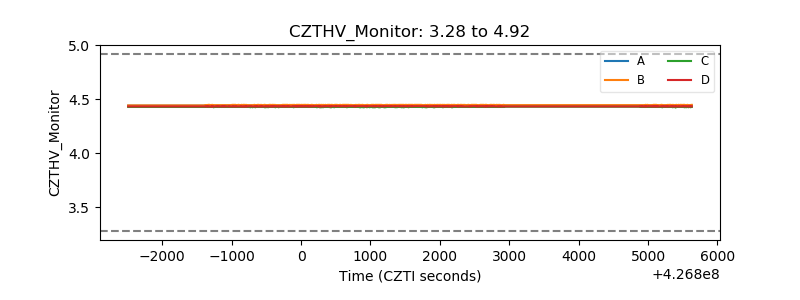 |
| D_VDD | 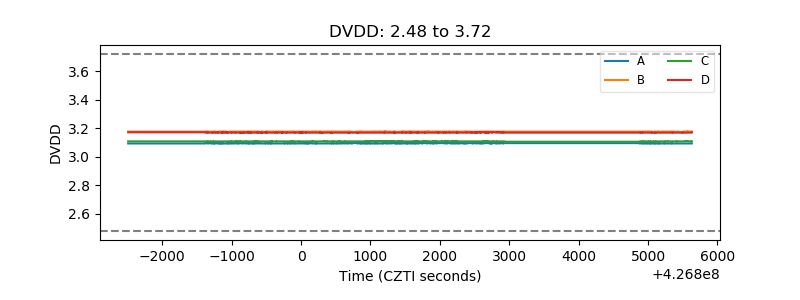 |
| Temperature 1 | 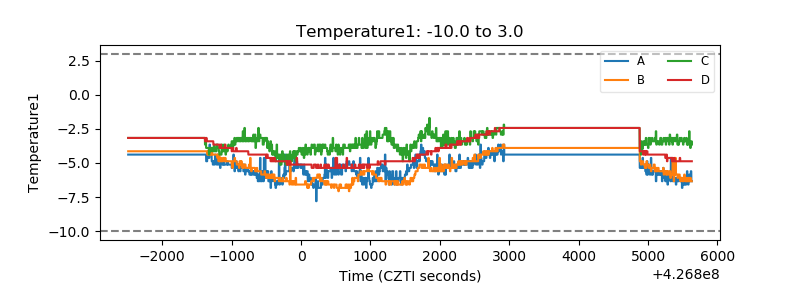 |
| Veto HV Monitor |  |
| Veto LLD | 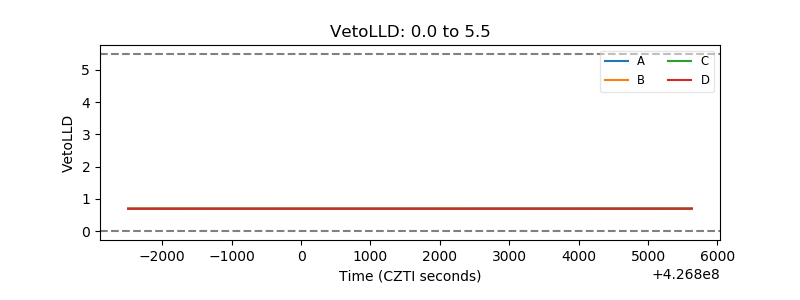 |
| Alpha Counter | 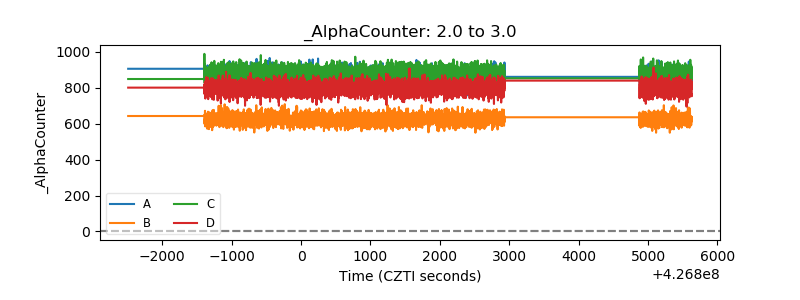 |
| _CPM_Rate | 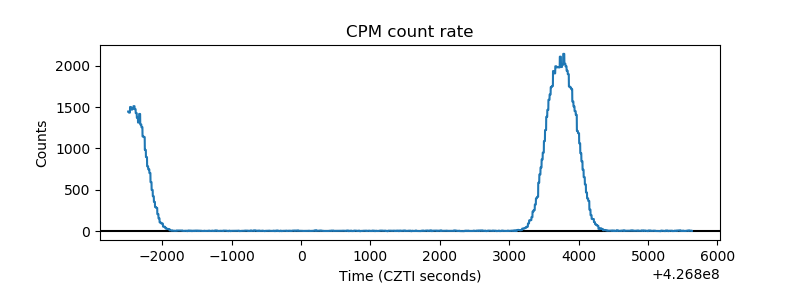 |
| CZT Counter | 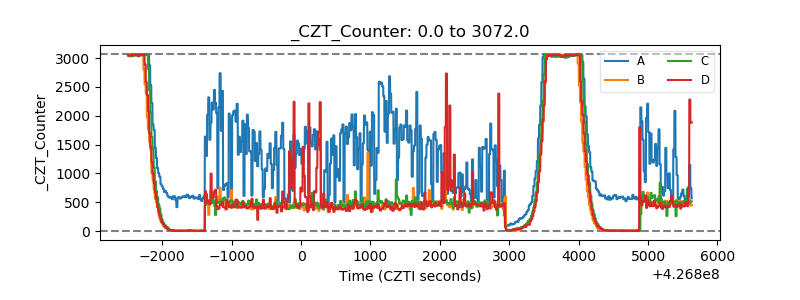 |
| +2.5 Volts monitor | 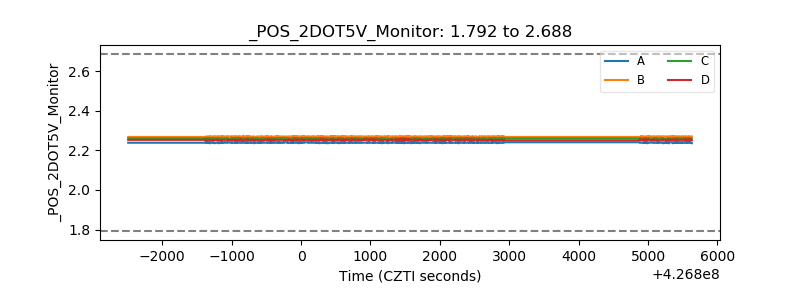 |
| +5 Volts monitor | 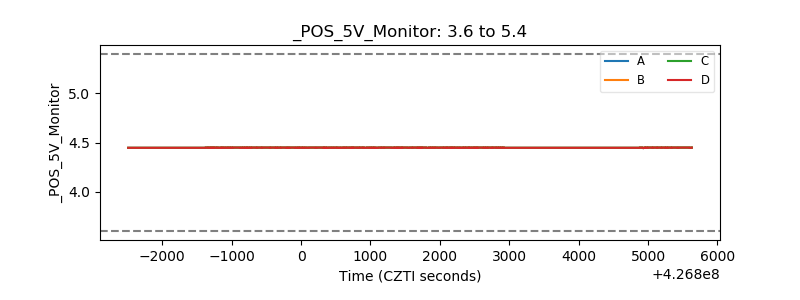 |
| _ROLL_ROT | 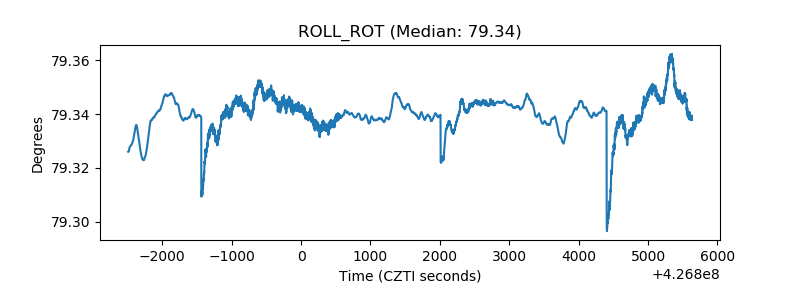 |
| _Roll_DEC | 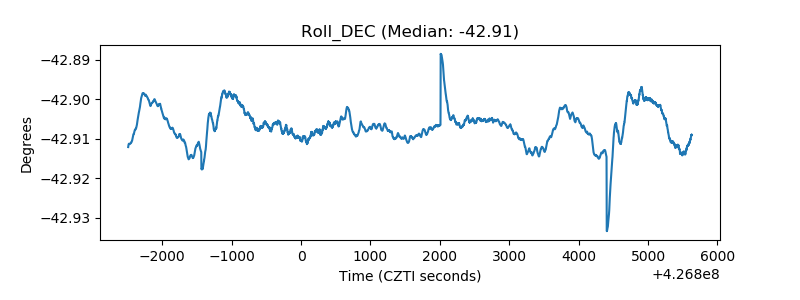 |
| _Roll_RA | 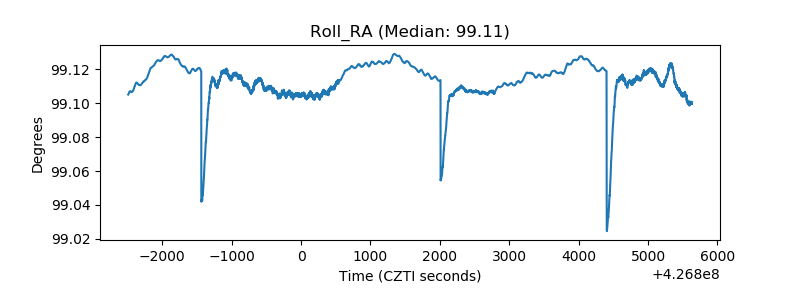 |
| Veto Counter | 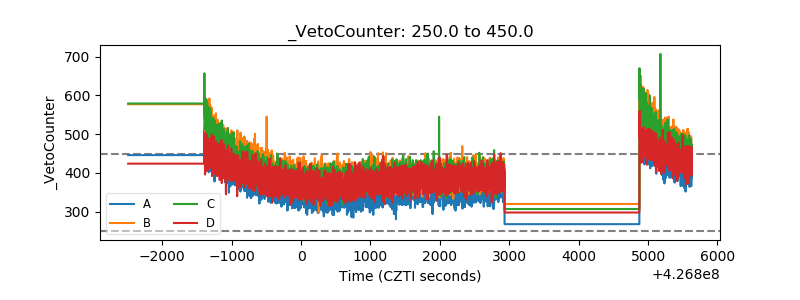 |