| Param | Original file | Final file |
|---|---|---|
| Filename | modeM0/AS1A12_099T03_9000005746_42097cztM0_level2.fits | modeM0/AS1A12_099T03_9000005746_42097cztM0_level2_quad_clean.evt |
| Size (bytes) | 268,698,240 | 72,308,160 |
| Size | 256.3 MB | 69.0 MB |
| Events in quadrant A | 3,681,189 | 489,938 |
| Events in quadrant B | 1,832,460 | 509,909 |
| Events in quadrant C | 2,020,810 | 475,336 |
| Events in quadrant D | 2,098,369 | 431,491 |
| Mode M0 | |||
|---|---|---|---|
| Quadrant | BADHDUFLAG | Total packets | Discarded packets |
| A | 0 | 13681 | 1 |
| B | 0 | 8080 | 1 |
| C | 0 | 8321 | 1 |
| D | 0 | 9010 | 1 |
| Mode M9 | |||
|---|---|---|---|
| Quadrant | BADHDUFLAG | Total packets | Discarded packets |
| A | 0 | 6 | 0 |
| B | 0 | 6 | 0 |
| C | 0 | 7 | 0 |
| D | 0 | 7 | 0 |
| Mode SS | |||
|---|---|---|---|
| Quadrant | BADHDUFLAG | Total packets | Discarded packets |
| A | 0 | 80 | 0 |
| B | 0 | 80 | 0 |
| C | 0 | 80 | 0 |
| D | 0 | 80 | 0 |
| Quadrant | Total seconds | Saturated seconds | Saturation percentage |
|---|---|---|---|
| A | 4016 | 108 | 2.689243% |
| B | 4016 | 4 | 0.099602% |
| C | 4016 | 3 | 0.074701% |
| D | 4016 | 55 | 1.369522% |
Noise dominated data is calculated using 1-second bins in cleaned event files. If a bin has >2000 counts, and if more than 50% of those come from <1% of pixels, then it is considered to be noise-dominated and hence unusable.
| Quadrant | # 1 sec bins | Bins with >0 counts | Bins with >2000 counts | High rate bins dominated by noise | Noise dominated (total time) | Noise dominated (detector-on time) | Marked lightcurve |
|---|---|---|---|---|---|---|---|
| A | 4016 | 4016 | 94 | 94 | 2.34% | 2.34% | 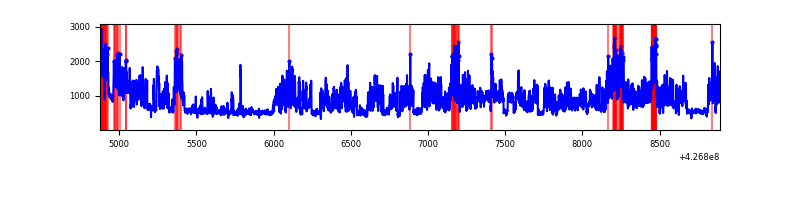 |
| B | 4016 | 4016 | 1 | 1 | 0.02% | 0.02% | 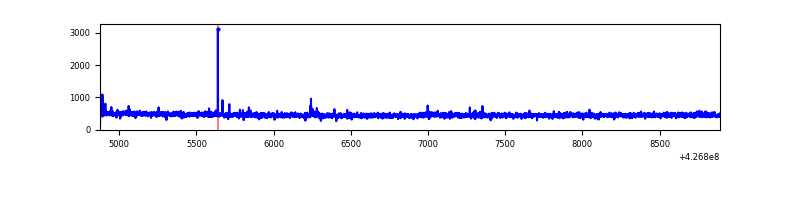 |
| C | 4016 | 4016 | 0 | 0 | 0.00% | 0.00% | 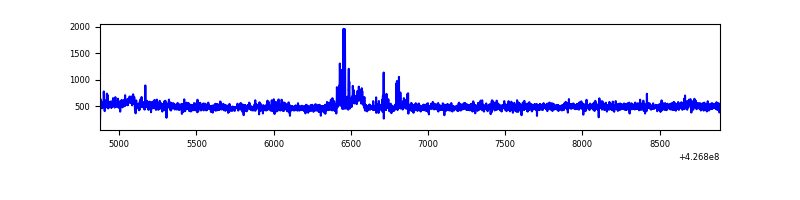 |
| D | 4016 | 4016 | 47 | 47 | 1.17% | 1.17% | 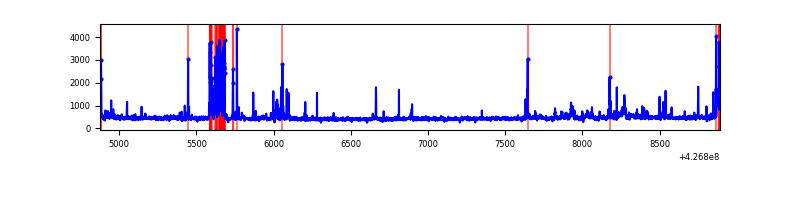 |
Top three noisy pixels from each quadrant. If the there are fewer than three noisy pixels in the level2.evt file, extra rows are filled as -1
| Pixel properties | Quadrant properties | ||||||
|---|---|---|---|---|---|---|---|
| Quadrant | DetID | PixID | Counts | Sigma | Mean | Median | Sigma |
| A | 15 | 222 | 1549817 | 16463.57 | 461 | 451 | 94.1 |
| A | 10 | 83 | 332910 | 3532.71 | 461 | 451 | 94.1 |
| A | 15 | 223 | 8774 | 88.44 | 461 | 451 | 94.1 |
| B | 5 | 255 | 11917 | 130.2 | 462 | 449 | 88.1 |
| B | 12 | 111 | 11072 | 120.6 | 462 | 449 | 88.1 |
| B | 11 | 111 | 10282 | 111.63 | 462 | 449 | 88.1 |
| C | 15 | 214 | 164957 | 1561.67 | 456 | 460 | 105.3 |
| C | 15 | 159 | 45352 | 426.19 | 456 | 460 | 105.3 |
| C | 8 | 79 | 24608 | 229.25 | 456 | 460 | 105.3 |
| D | 12 | 6 | 202066 | 1861.09 | 449 | 437 | 108.3 |
| D | 13 | 249 | 109821 | 1009.64 | 449 | 437 | 108.3 |
| D | 1 | 52 | 40222 | 367.23 | 449 | 437 | 108.3 |
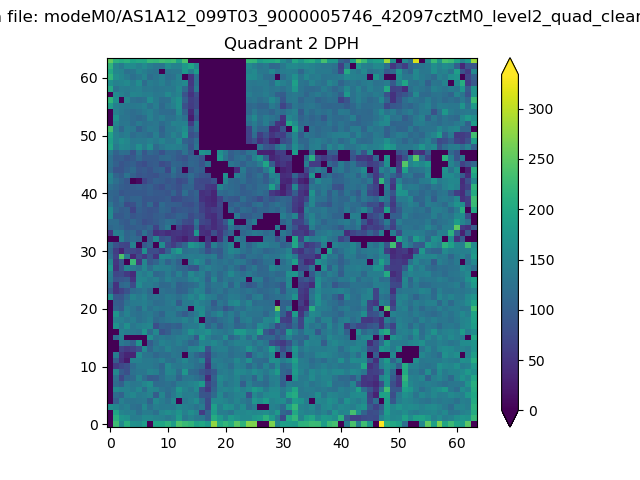
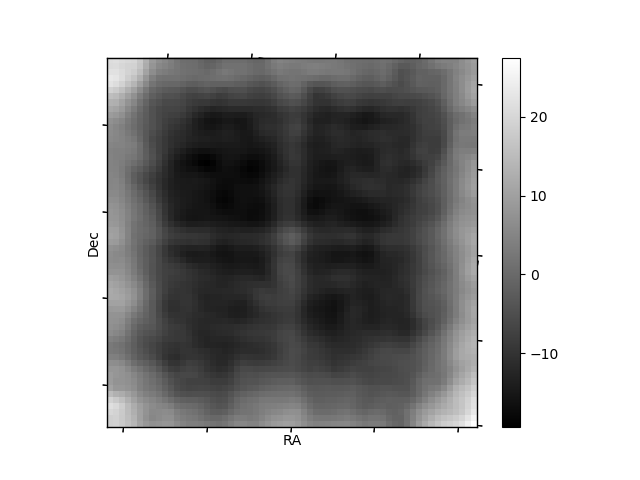
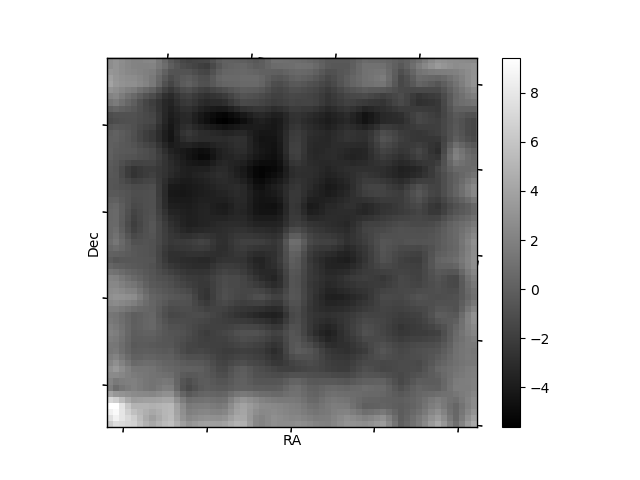
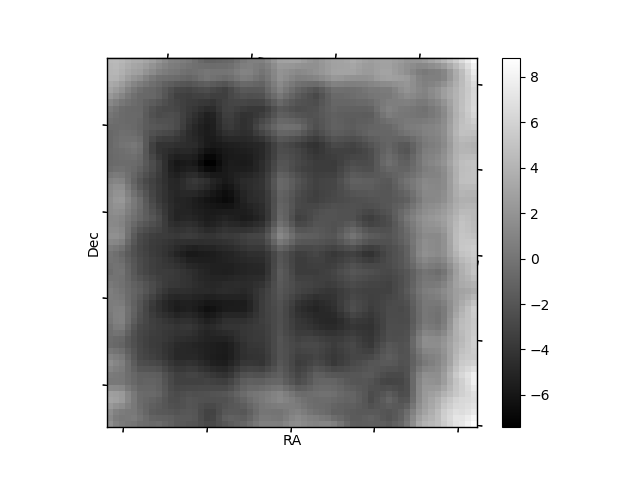
Histogram calculated using DETX and DETY for each event in the final _common_clean file
| Quadrant A | 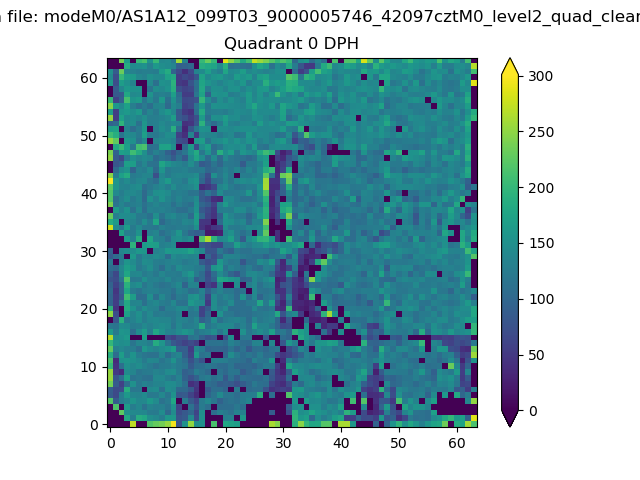 |
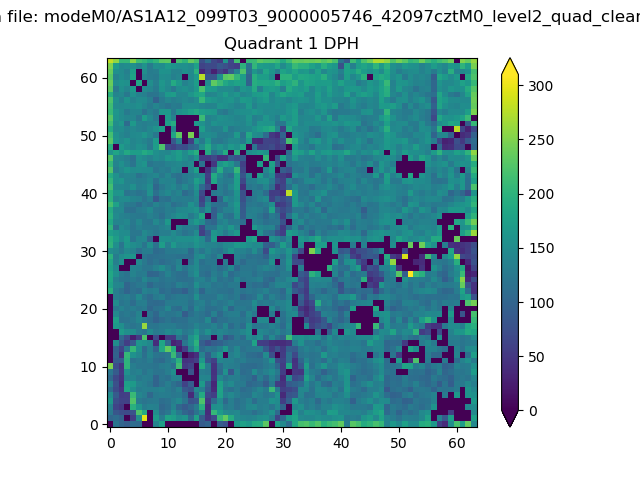 |
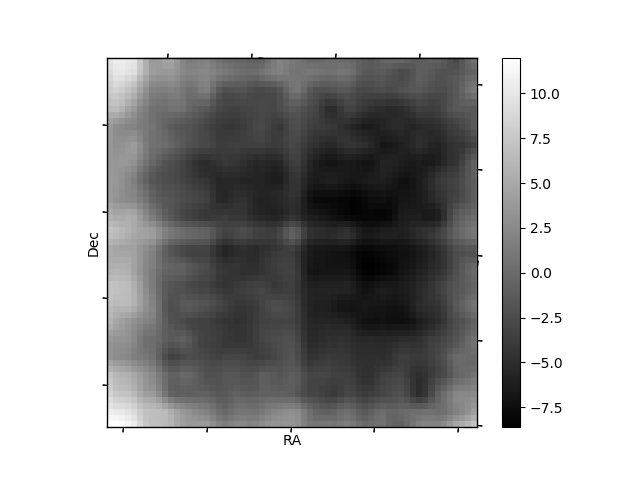
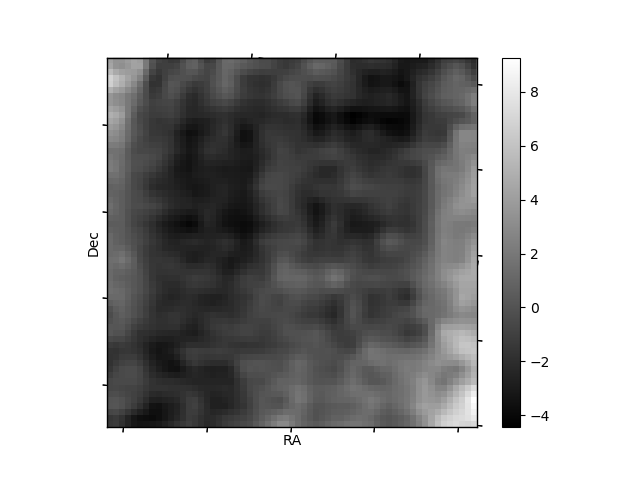
Quadrant B |
|---|---|---|---|
| Quadrant D | 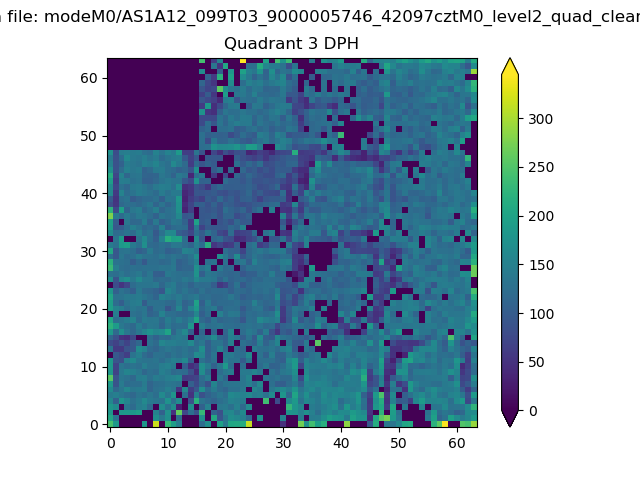 |
 |
Quadrant C |
| Plot type | Count rate plots | Images |
|---|---|---|
| Comparison with Poisson distribution Blue bars denote a histogram of data divided into 1 sec bins. Red curve is a Poisson curve with rate = median count rate of data. |
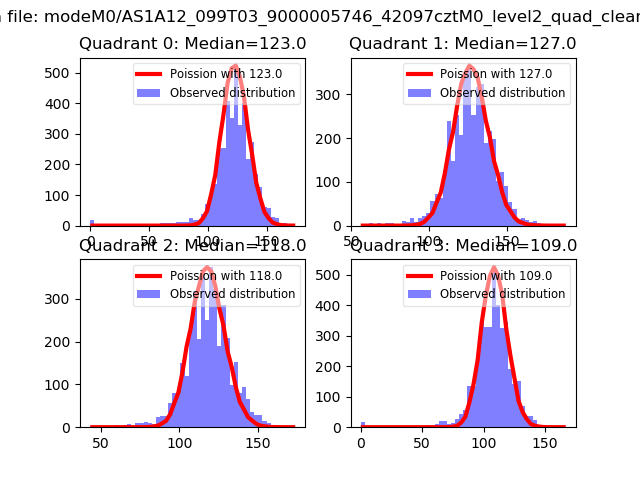 |
 |
| Quadrant-wise count rates Data is divided into 100 sec bins |
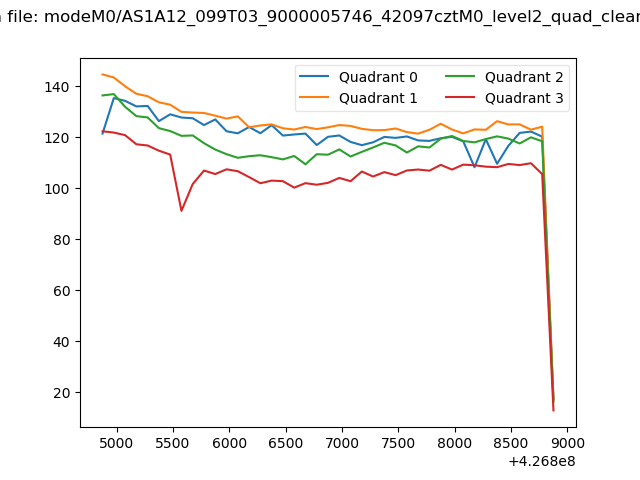 |
|
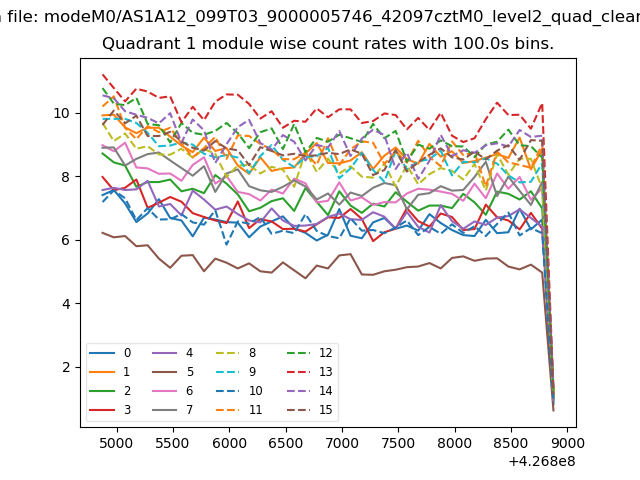
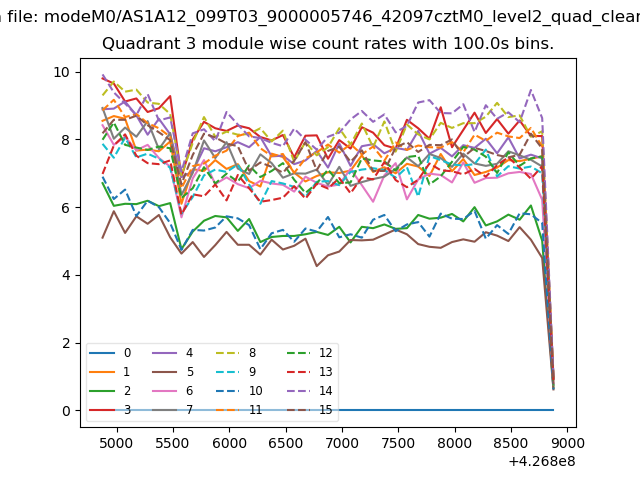
| Module-wise count rates for Quadrant A Data is divided into 100 sec bins |
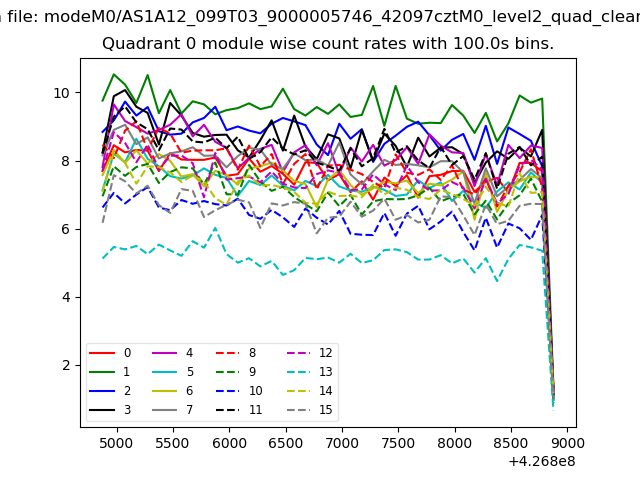 |
 |
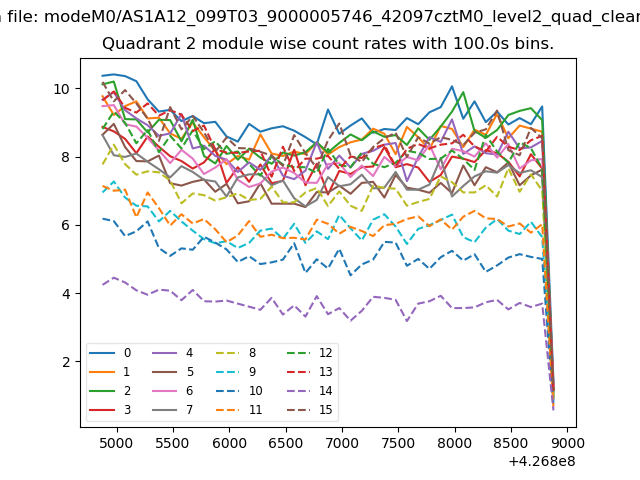
| Module-wise count rates for Quadrant B Data is divided into 100 sec bins |
 |
 |
| Module-wise count rates for Quadrant C Data is divided into 100 sec bins |
 |
 |
| Module-wise count rates for Quadrant D Data is divided into 100 sec bins |
 |
 |
| Parameter | Plot |
|---|---|
| CZT HV Monitor | 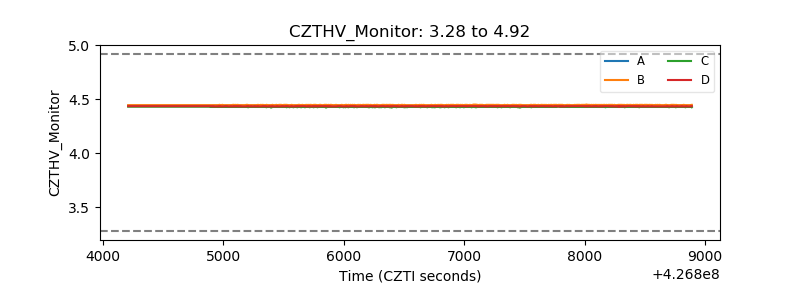 |
| D_VDD | 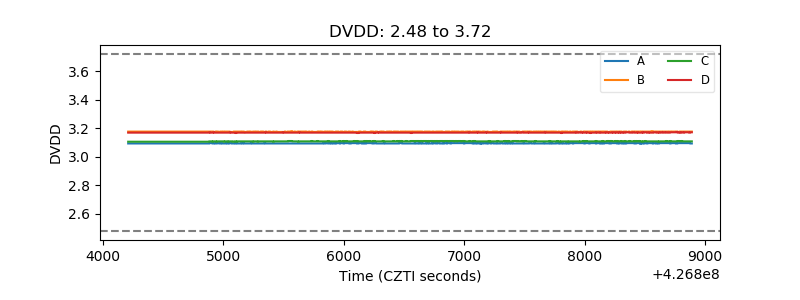 |
| Temperature 1 | 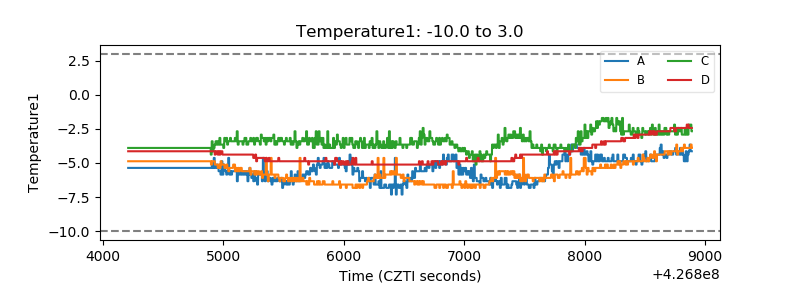 |
| Veto HV Monitor |  |
| Veto LLD | 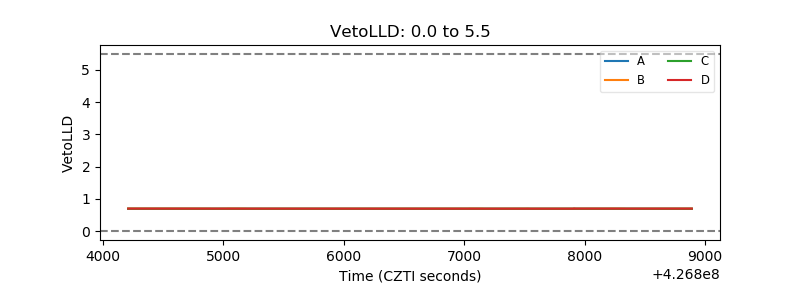 |
| Alpha Counter | 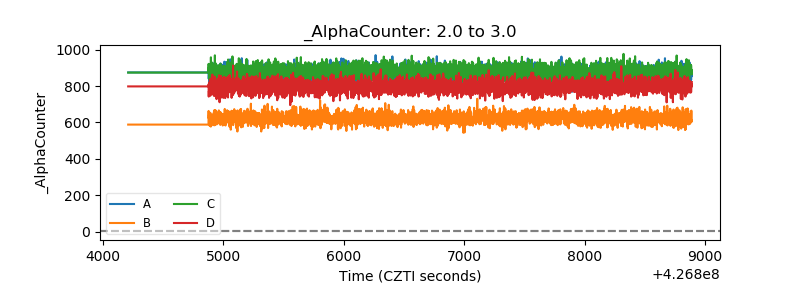 |
| _CPM_Rate | 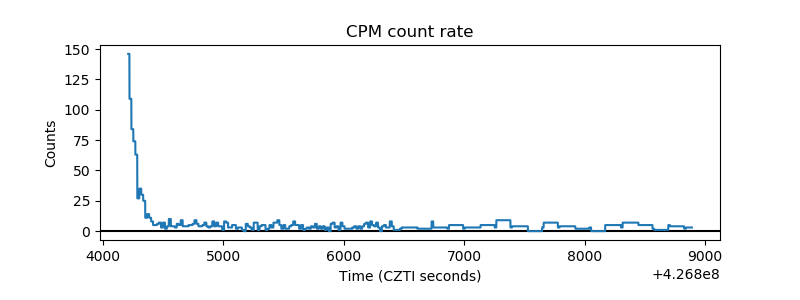 |
| CZT Counter | 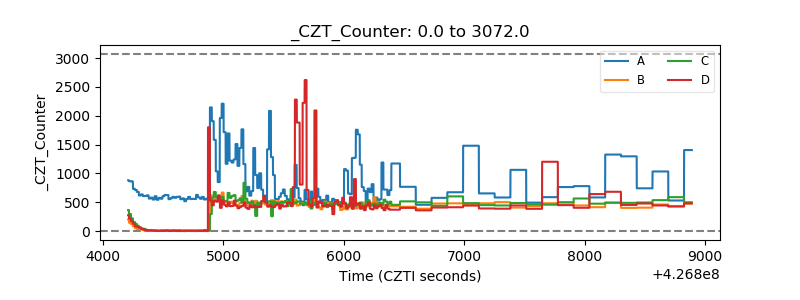 |
| +2.5 Volts monitor |  |
| +5 Volts monitor | 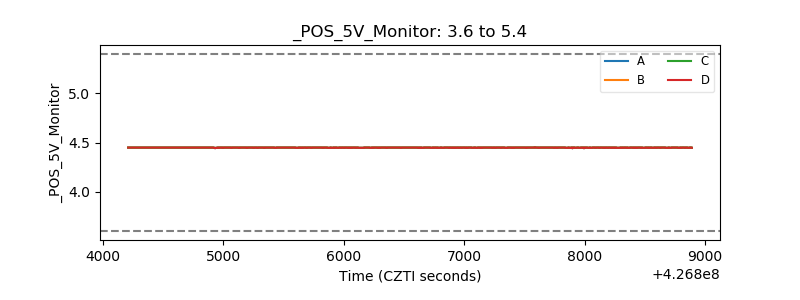 |
| _ROLL_ROT | 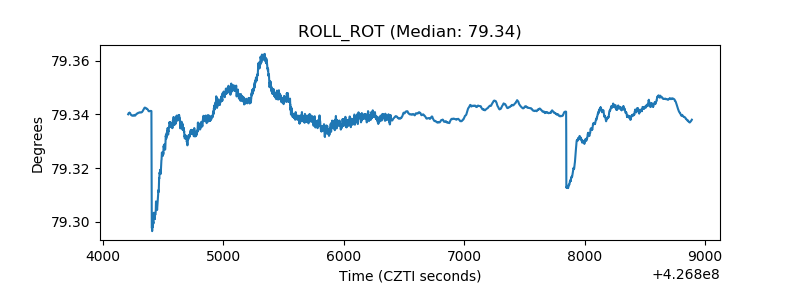 |
| _Roll_DEC | 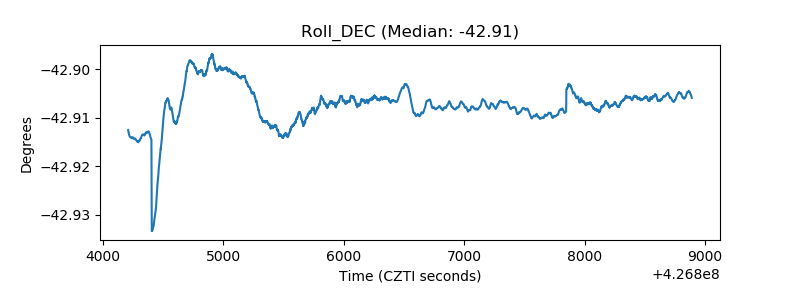 |
| _Roll_RA | 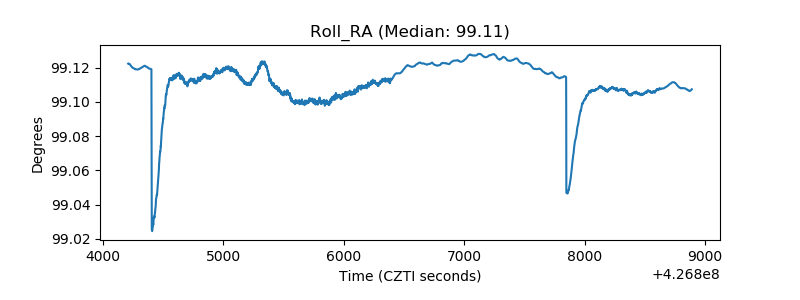 |
| Veto Counter | 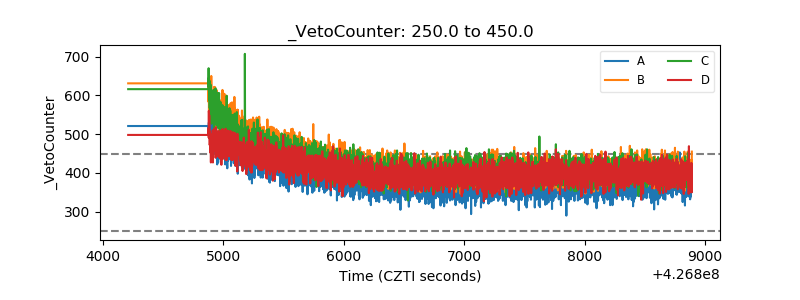 |