| Param | Original file | Final file |
|---|---|---|
| Filename | modeM0/AS1A12_044T22_9000005750_42103cztM0_level2.fits | modeM0/AS1A12_044T22_9000005750_42103cztM0_level2_quad_clean.evt |
| Size (bytes) | 505,825,920 | 90,725,760 |
| Size | 482.4 MB | 86.5 MB |
| Events in quadrant A | 6,709,093 | 593,037 |
| Events in quadrant B | 2,888,252 | 635,464 |
| Events in quadrant C | 2,723,624 | 620,379 |
| Events in quadrant D | 5,945,474 | 486,087 |
| Mode M0 | |||
|---|---|---|---|
| Quadrant | BADHDUFLAG | Total packets | Discarded packets |
| A | 0 | 23988 | 2 |
| B | 0 | 12759 | 2 |
| C | 0 | 11829 | 2 |
| D | 0 | 21778 | 2 |
| Mode M9 | |||
|---|---|---|---|
| Quadrant | BADHDUFLAG | Total packets | Discarded packets |
| A | 0 | 16 | 0 |
| B | 0 | 17 | 0 |
| C | 0 | 17 | 0 |
| D | 0 | 17 | 0 |
| Mode SS | |||
|---|---|---|---|
| Quadrant | BADHDUFLAG | Total packets | Discarded packets |
| A | 0 | 120 | 0 |
| B | 0 | 120 | 0 |
| C | 0 | 120 | 0 |
| D | 0 | 120 | 0 |
| Quadrant | Total seconds | Saturated seconds | Saturation percentage |
|---|---|---|---|
| A | 5895 | 562 | 9.533503% |
| B | 5895 | 131 | 2.222222% |
| C | 5895 | 4 | 0.067854% |
| D | 5895 | 1081 | 18.337574% |
Noise dominated data is calculated using 1-second bins in cleaned event files. If a bin has >2000 counts, and if more than 50% of those come from <1% of pixels, then it is considered to be noise-dominated and hence unusable.
| Quadrant | # 1 sec bins | Bins with >0 counts | Bins with >2000 counts | High rate bins dominated by noise | Noise dominated (total time) | Noise dominated (detector-on time) | Marked lightcurve |
|---|---|---|---|---|---|---|---|
| A | 7208 | 5896 | 479 | 479 | 6.65% | 8.12% | 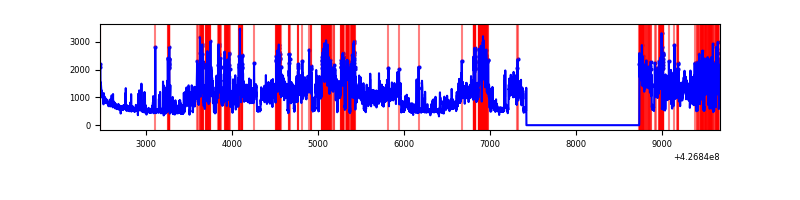 |
| B | 7208 | 5896 | 86 | 86 | 1.19% | 1.46% | 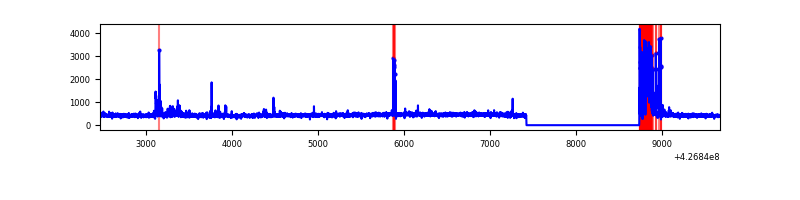 |
| C | 7208 | 5896 | 0 | 0 | 0.00% | 0.00% | 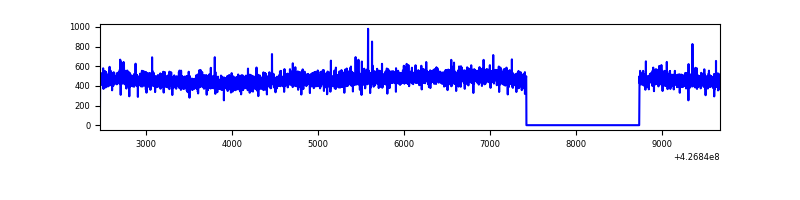 |
| D | 7208 | 5896 | 920 | 920 | 12.76% | 15.60% | 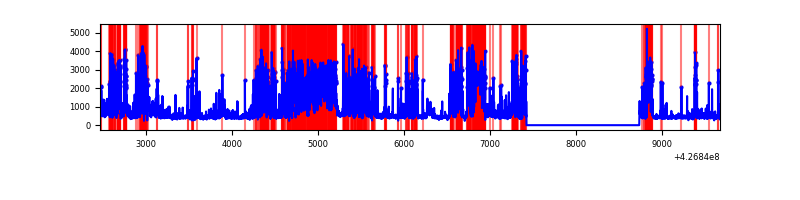 |
Top three noisy pixels from each quadrant. If the there are fewer than three noisy pixels in the level2.evt file, extra rows are filled as -1
| Pixel properties | Quadrant properties | ||||||
|---|---|---|---|---|---|---|---|
| Quadrant | DetID | PixID | Counts | Sigma | Mean | Median | Sigma |
| A | 15 | 222 | 3671729 | 28220.98 | 635 | 623 | 130.1 |
| A | 10 | 83 | 568426 | 4364.89 | 635 | 623 | 130.1 |
| A | 13 | 6 | 11967 | 87.21 | 635 | 623 | 130.1 |
| B | 5 | 255 | 371916 | 2967.34 | 637 | 618 | 125.1 |
| B | 12 | 111 | 16116 | 123.86 | 637 | 618 | 125.1 |
| B | 11 | 111 | 14966 | 114.67 | 637 | 618 | 125.1 |
| C | 15 | 214 | 243221 | 1620.76 | 634 | 637 | 149.7 |
| C | 13 | 61 | 4240 | 24.07 | 634 | 637 | 149.7 |
| C | 15 | 111 | 4038 | 22.72 | 634 | 637 | 149.7 |
| D | 2 | 249 | 2139994 | 14882.06 | 586 | 569 | 143.8 |
| D | 13 | 249 | 750725 | 5218.16 | 586 | 569 | 143.8 |
| D | 12 | 6 | 397145 | 2758.62 | 586 | 569 | 143.8 |
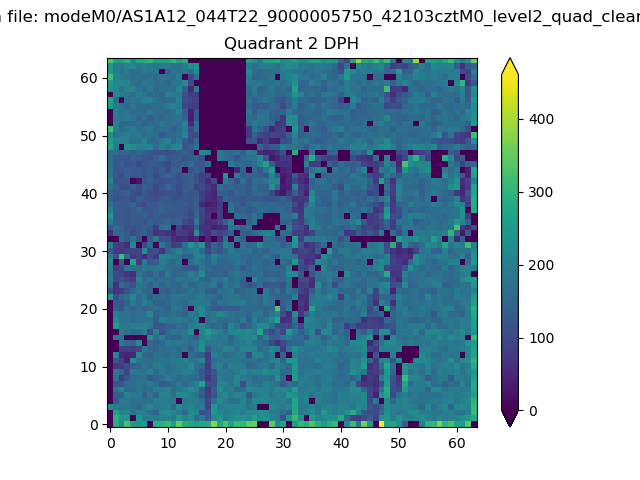
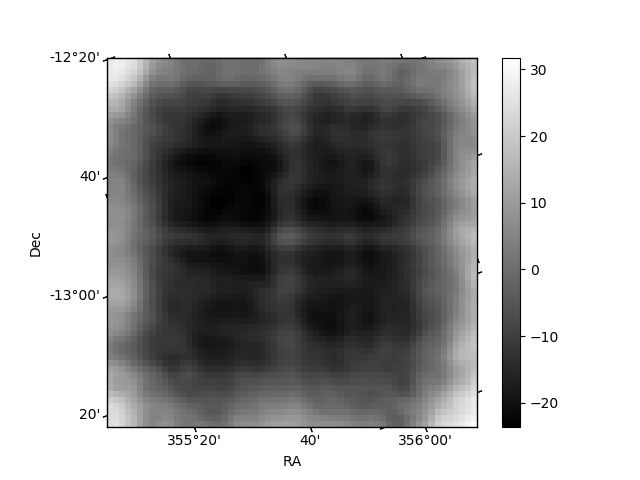
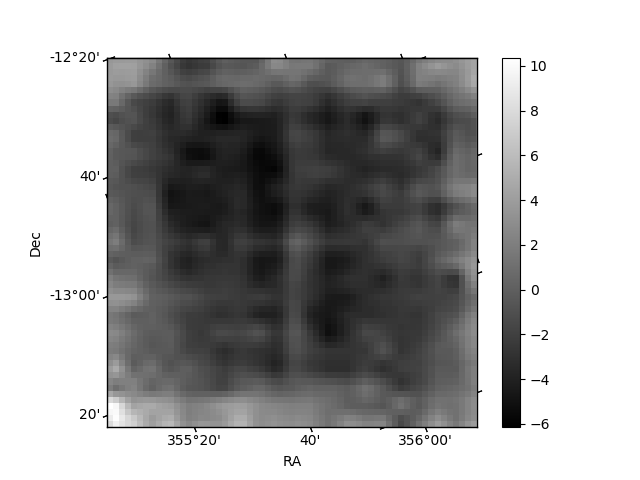
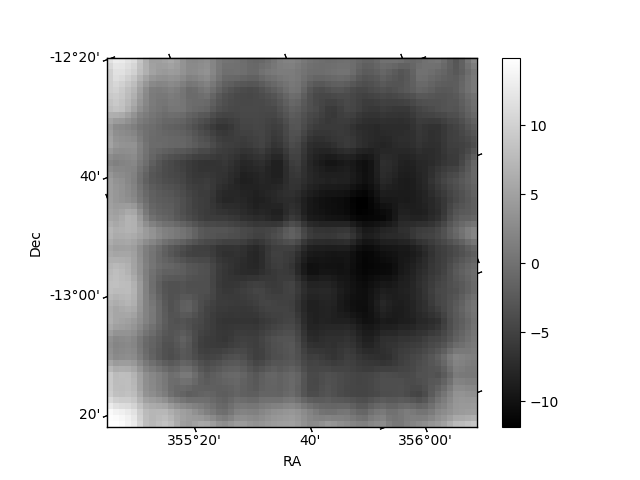
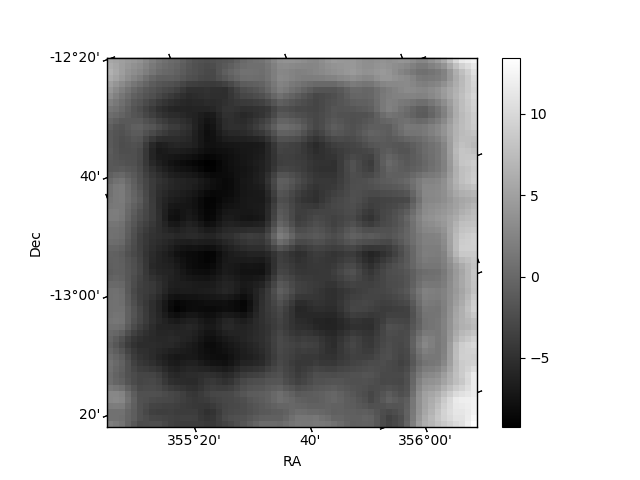
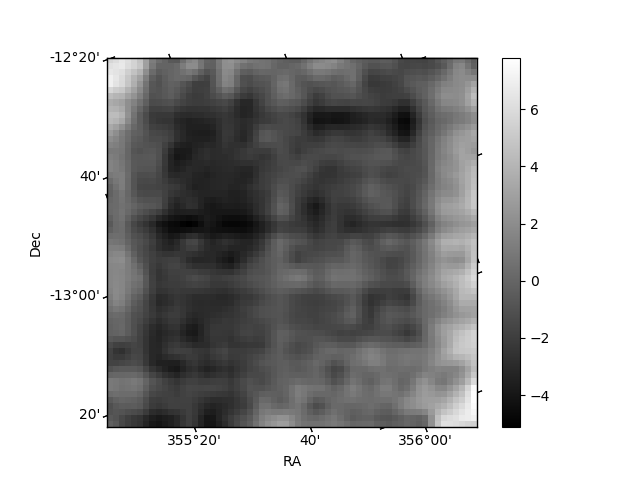
Histogram calculated using DETX and DETY for each event in the final _common_clean file
| Quadrant A | 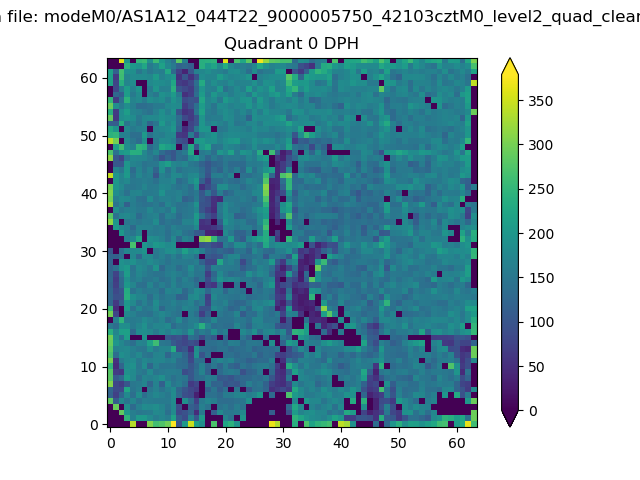 |
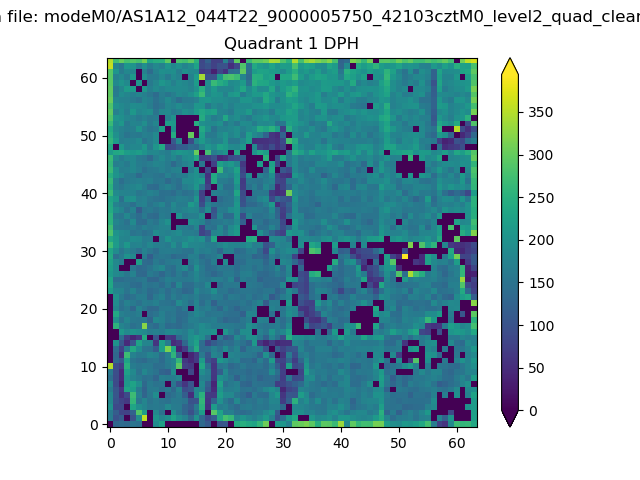 |
Quadrant B |
|---|---|---|---|
| Quadrant D | 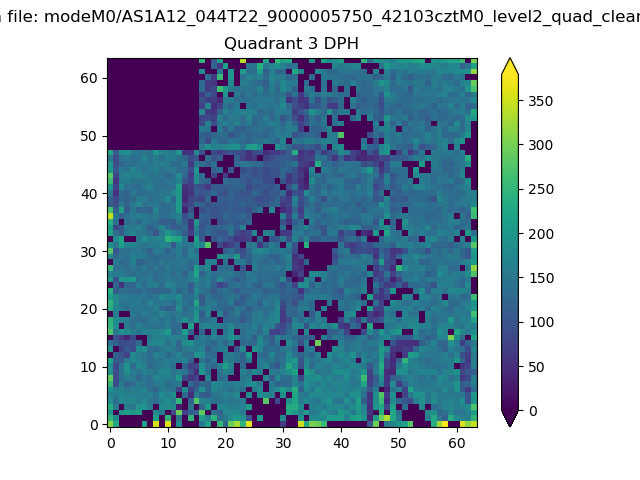 |
 |
Quadrant C |
| Plot type | Count rate plots | Images |
|---|---|---|
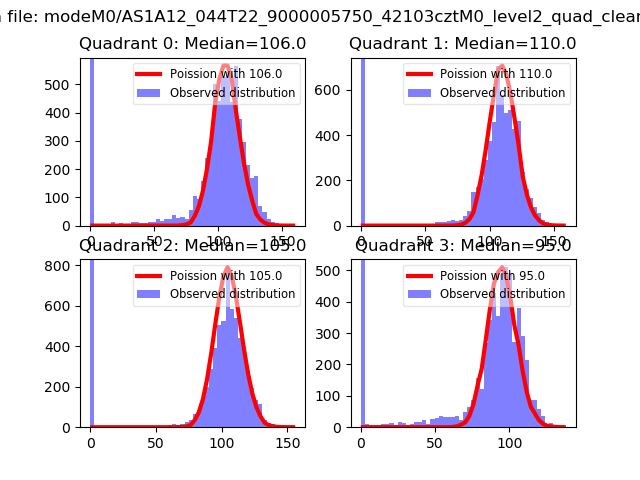
| Comparison with Poisson distribution Blue bars denote a histogram of data divided into 1 sec bins. Red curve is a Poisson curve with rate = median count rate of data. |
 |
 |
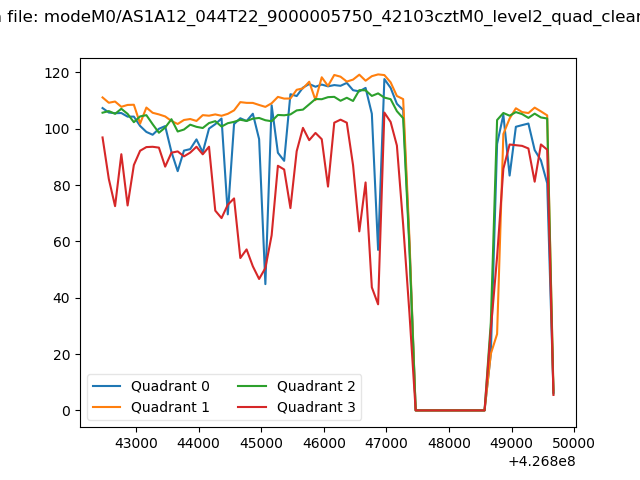
| Quadrant-wise count rates Data is divided into 100 sec bins |
 |
|
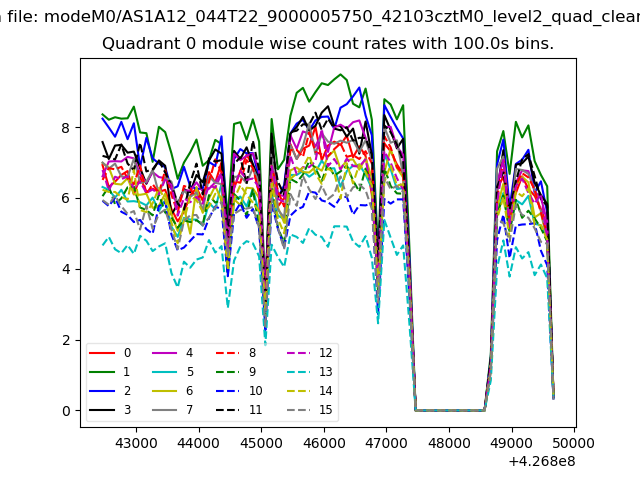
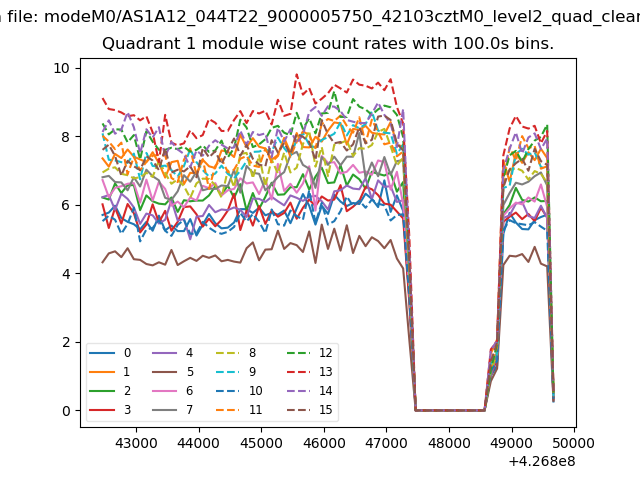
| Module-wise count rates for Quadrant A Data is divided into 100 sec bins |
 |
 |
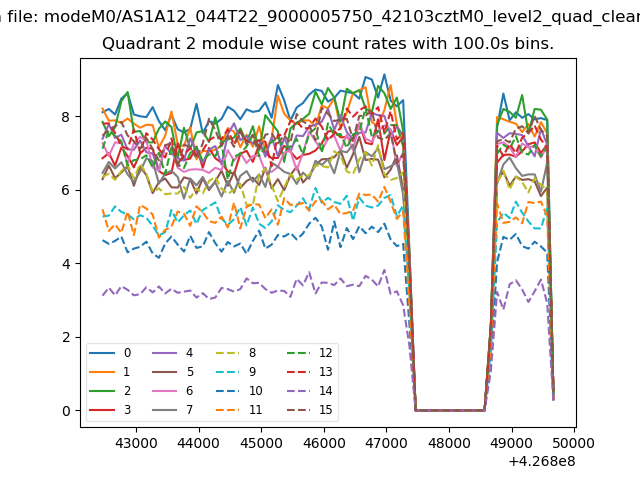
| Module-wise count rates for Quadrant B Data is divided into 100 sec bins |
 |
 |
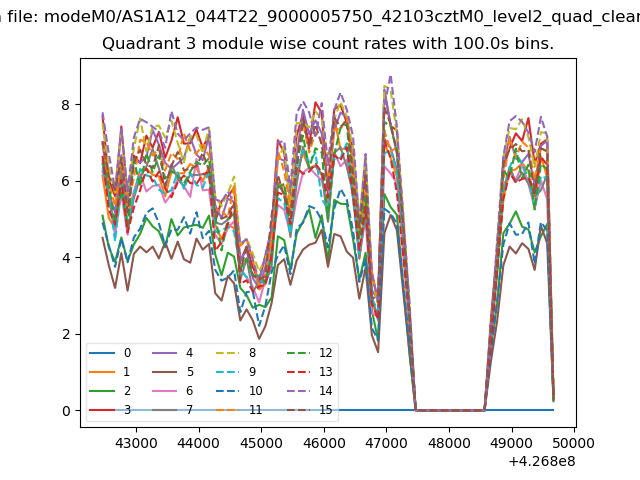
| Module-wise count rates for Quadrant C Data is divided into 100 sec bins |
 |
 |
| Module-wise count rates for Quadrant D Data is divided into 100 sec bins |
 |
 |
| Parameter | Plot |
|---|---|
| CZT HV Monitor | 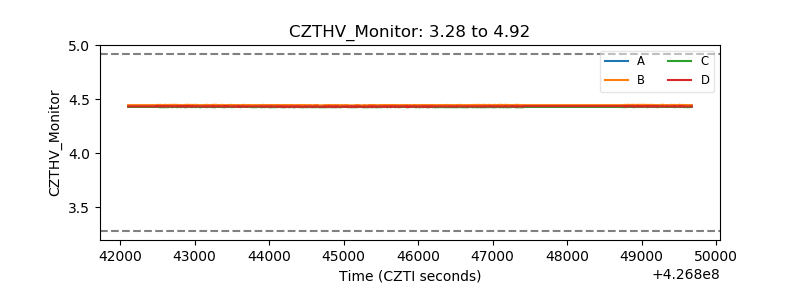 |
| D_VDD | 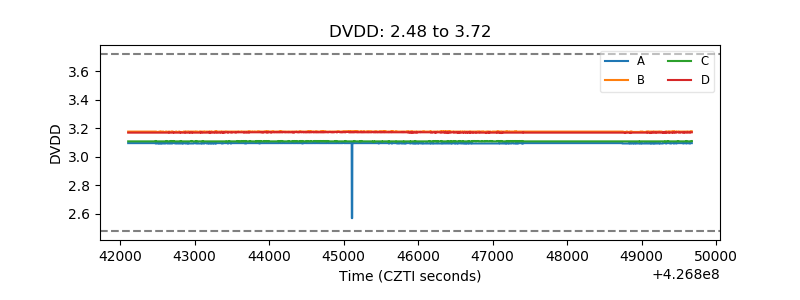 |
| Temperature 1 | 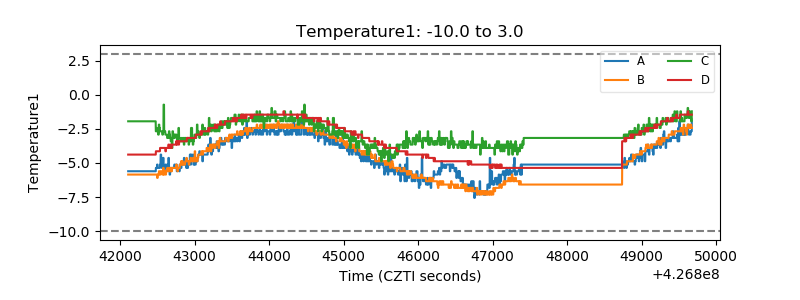 |
| Veto HV Monitor | 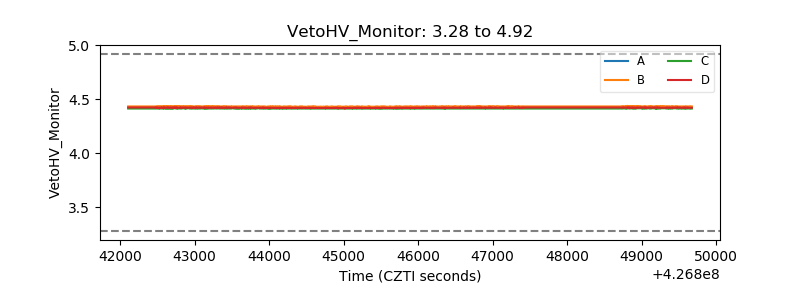 |
| Veto LLD |  |
| Alpha Counter | 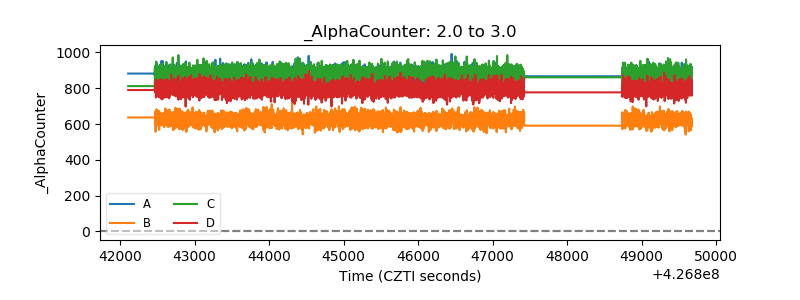 |
| _CPM_Rate | 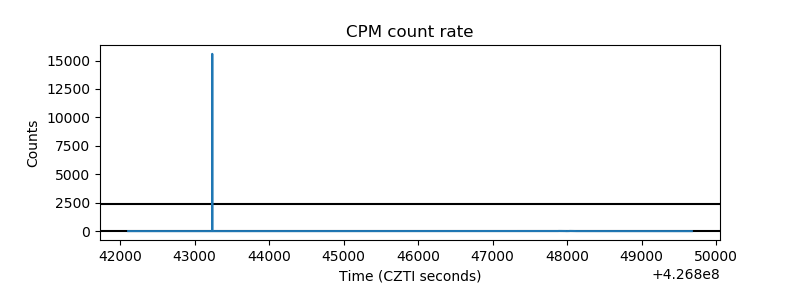 |
| CZT Counter | 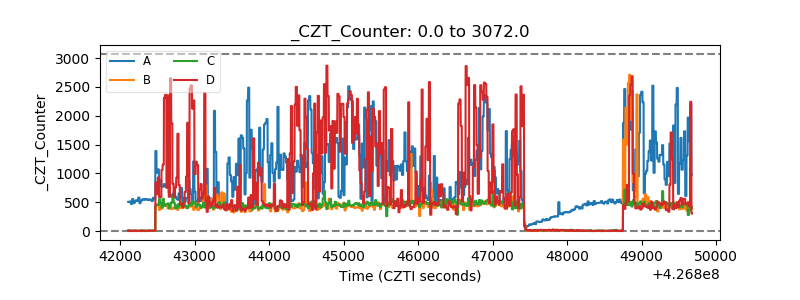 |
| +2.5 Volts monitor | 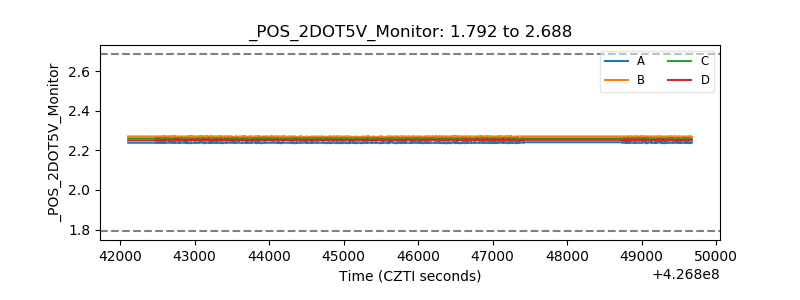 |
| +5 Volts monitor | 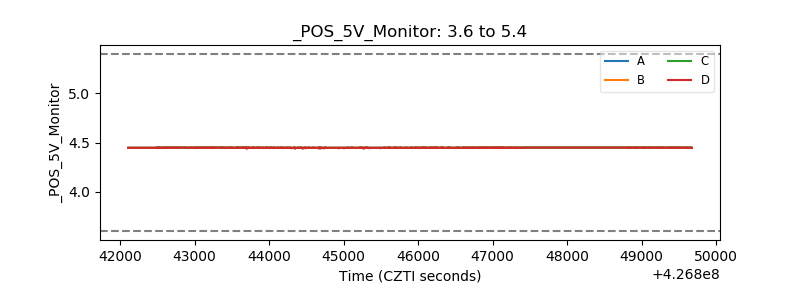 |
| _ROLL_ROT | 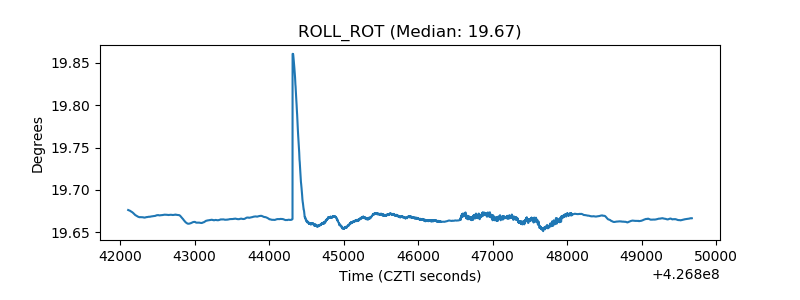 |
| _Roll_DEC | 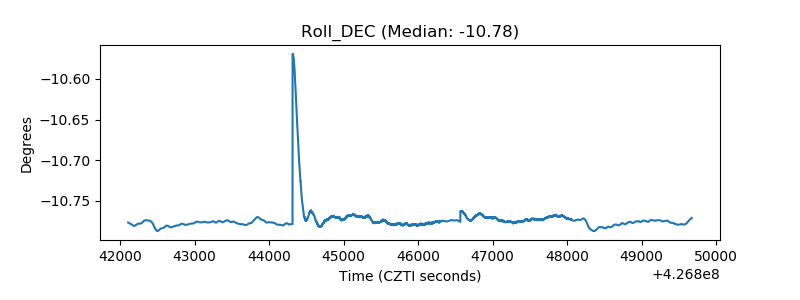 |
| _Roll_RA | 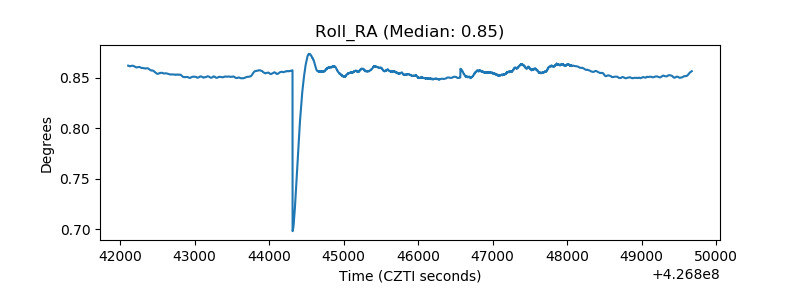 |
| Veto Counter | 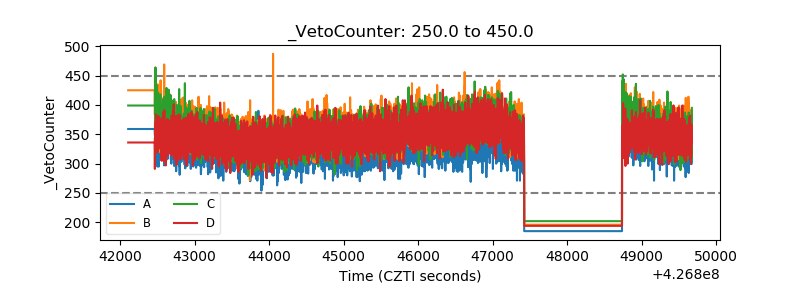 |