| Param | Original file | Final file |
|---|---|---|
| Filename | modeM0/AS1A12_044T22_9000005750_42106cztM0_level2.fits | modeM0/AS1A12_044T22_9000005750_42106cztM0_level2_quad_clean.evt |
| Size (bytes) | 1,250,187,840 | 237,931,200 |
| Size | 1.2 GB | 226.9 MB |
| Events in quadrant A | 20,748,422 | 1,358,203 |
| Events in quadrant B | 7,266,430 | 1,693,947 |
| Events in quadrant C | 7,242,384 | 1,621,624 |
| Events in quadrant D | 9,818,579 | 1,456,422 |
| Mode M0 | |||
|---|---|---|---|
| Quadrant | BADHDUFLAG | Total packets | Discarded packets |
| A | 0 | 72459 | 8 |
| B | 0 | 32632 | 4 |
| C | 0 | 31286 | 4 |
| D | 0 | 40232 | 4 |
| Mode M9 | |||
|---|---|---|---|
| Quadrant | BADHDUFLAG | Total packets | Discarded packets |
| A | 0 | 42 | 0 |
| B | 0 | 42 | 0 |
| C | 0 | 42 | 0 |
| D | 0 | 42 | 0 |
| Mode SS | |||
|---|---|---|---|
| Quadrant | BADHDUFLAG | Total packets | Discarded packets |
| A | 0 | 318 | 0 |
| B | 0 | 318 | 0 |
| C | 0 | 318 | 0 |
| D | 0 | 318 | 0 |
| Quadrant | Total seconds | Saturated seconds | Saturation percentage |
|---|---|---|---|
| A | 15550 | 3178 | 20.437299% |
| B | 15551 | 147 | 0.945277% |
| C | 15551 | 17 | 0.109318% |
| D | 15551 | 654 | 4.205517% |
Noise dominated data is calculated using 1-second bins in cleaned event files. If a bin has >2000 counts, and if more than 50% of those come from <1% of pixels, then it is considered to be noise-dominated and hence unusable.
| Quadrant | # 1 sec bins | Bins with >0 counts | Bins with >2000 counts | High rate bins dominated by noise | Noise dominated (total time) | Noise dominated (detector-on time) | Marked lightcurve |
|---|---|---|---|---|---|---|---|
| A | 19760 | 15553 | 2791 | 2791 | 14.12% | 17.95% | 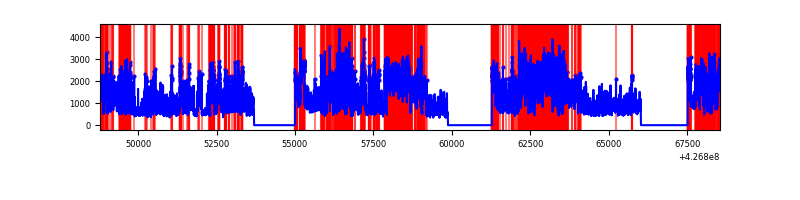 |
| B | 19761 | 15554 | 105 | 105 | 0.53% | 0.68% | 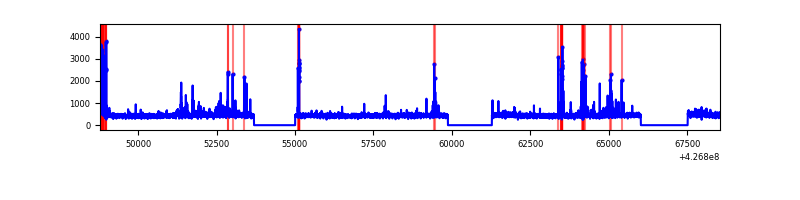 |
| C | 19761 | 15554 | 6 | 6 | 0.03% | 0.04% | 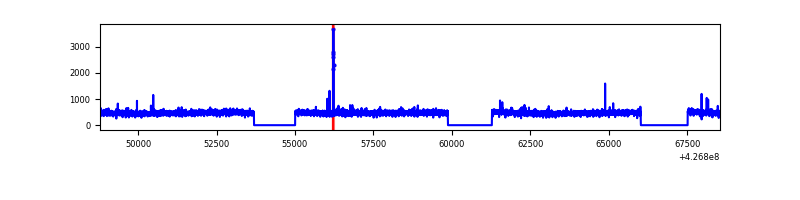 |
| D | 19761 | 15554 | 558 | 558 | 2.82% | 3.59% | 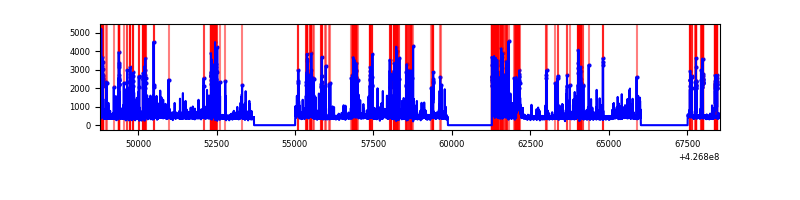 |
Top three noisy pixels from each quadrant. If the there are fewer than three noisy pixels in the level2.evt file, extra rows are filled as -1
| Pixel properties | Quadrant properties | ||||||
|---|---|---|---|---|---|---|---|
| Quadrant | DetID | PixID | Counts | Sigma | Mean | Median | Sigma |
| A | 15 | 222 | 12263272 | 36847.04 | 1625 | 1589 | 332.8 |
| A | 10 | 83 | 1309586 | 3930.6 | 1625 | 1589 | 332.8 |
| A | 15 | 223 | 847445 | 2541.84 | 1625 | 1589 | 332.8 |
| B | 5 | 255 | 574084 | 1741.84 | 1699 | 1652 | 328.6 |
| B | 12 | 111 | 42658 | 124.78 | 1699 | 1652 | 328.6 |
| B | 11 | 111 | 39517 | 115.22 | 1699 | 1652 | 328.6 |
| C | 15 | 214 | 636480 | 1618.45 | 1677 | 1685 | 392.2 |
| C | 8 | 79 | 42693 | 104.55 | 1677 | 1685 | 392.2 |
| C | 12 | 249 | 16410 | 37.54 | 1677 | 1685 | 392.2 |
| D | 12 | 233 | 1242651 | 3086.01 | 1651 | 1603 | 402.2 |
| D | 13 | 249 | 721806 | 1790.87 | 1651 | 1603 | 402.2 |
| D | 12 | 6 | 678443 | 1683.04 | 1651 | 1603 | 402.2 |
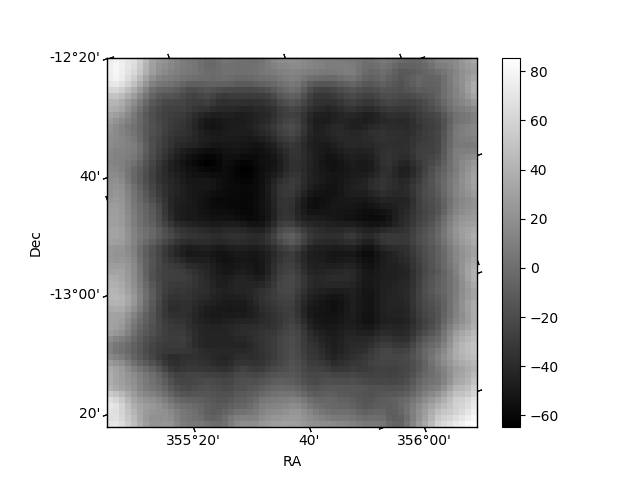
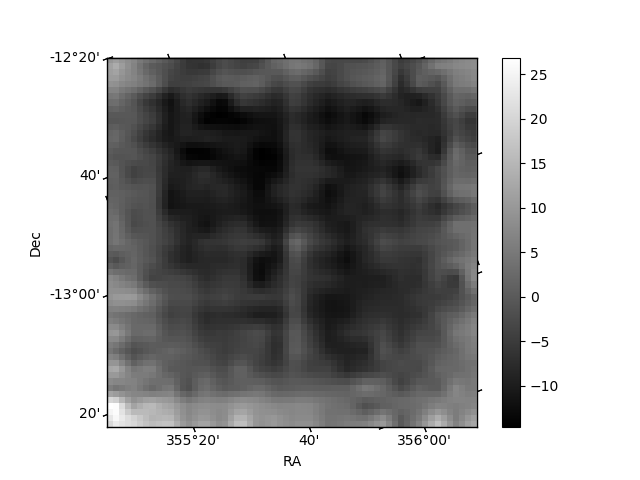
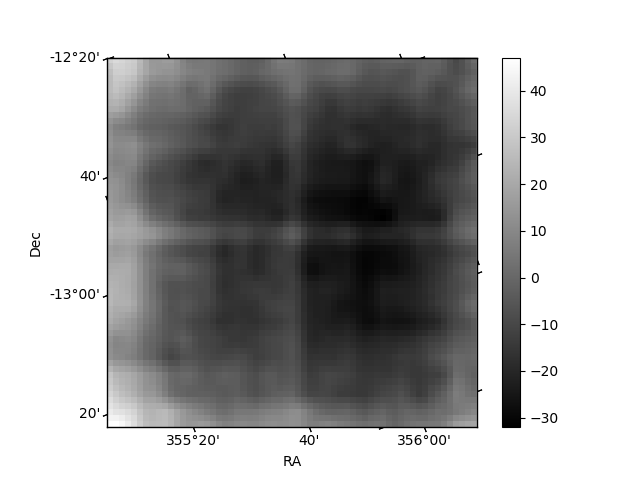
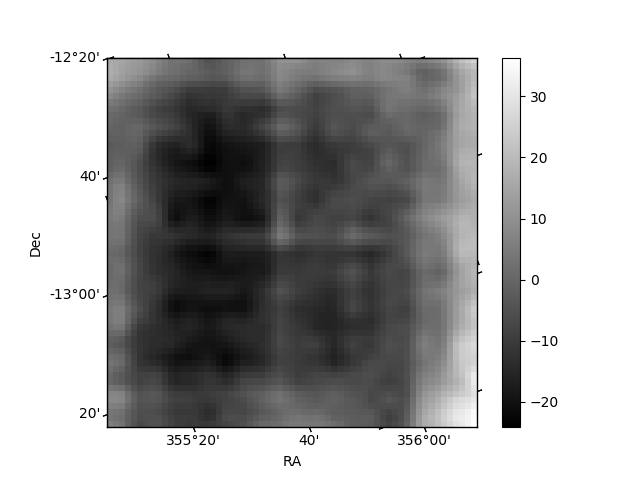
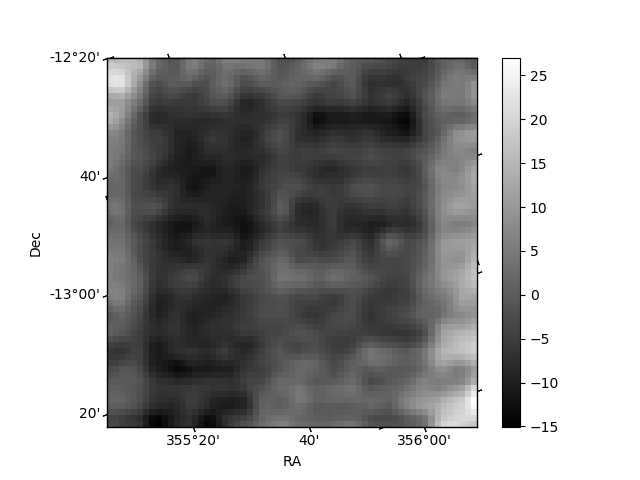
Histogram calculated using DETX and DETY for each event in the final _common_clean file
| Quadrant A | 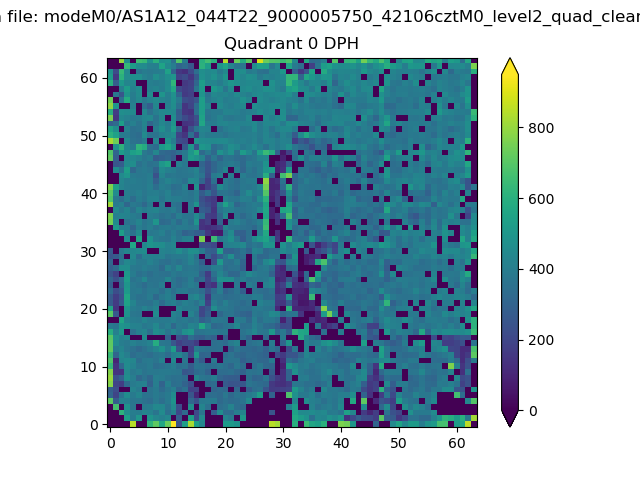 |
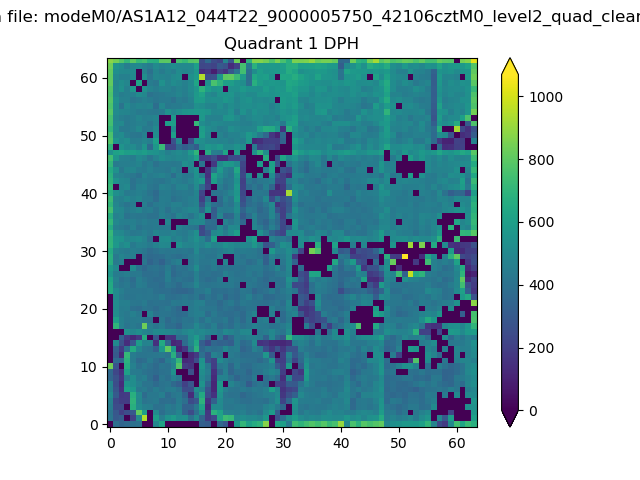 |
Quadrant B |
|---|---|---|---|
| Quadrant D | 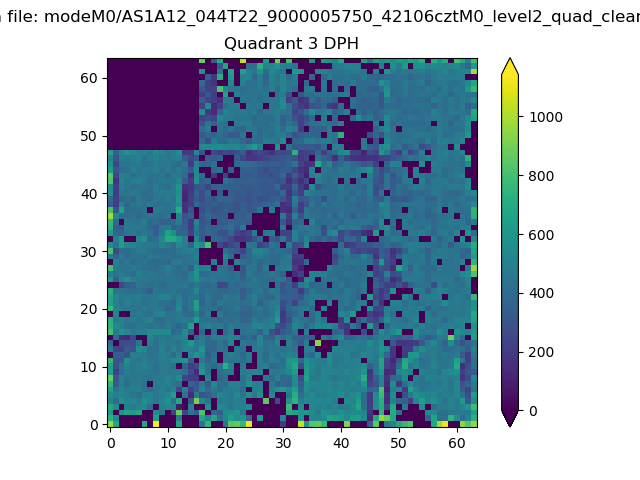 |
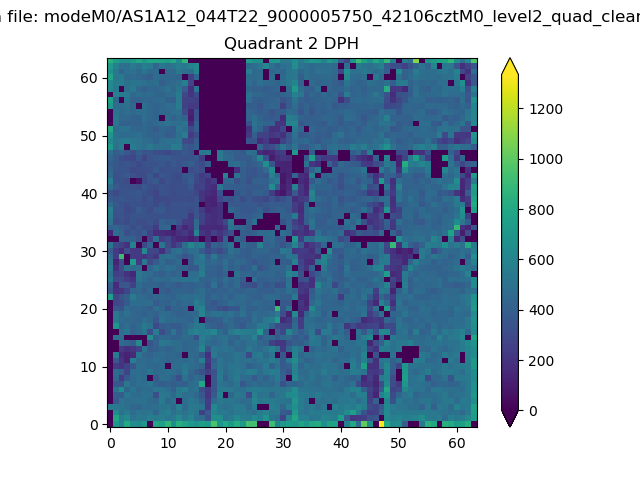 |
Quadrant C |
| Plot type | Count rate plots | Images |
|---|---|---|
| Comparison with Poisson distribution Blue bars denote a histogram of data divided into 1 sec bins. Red curve is a Poisson curve with rate = median count rate of data. |
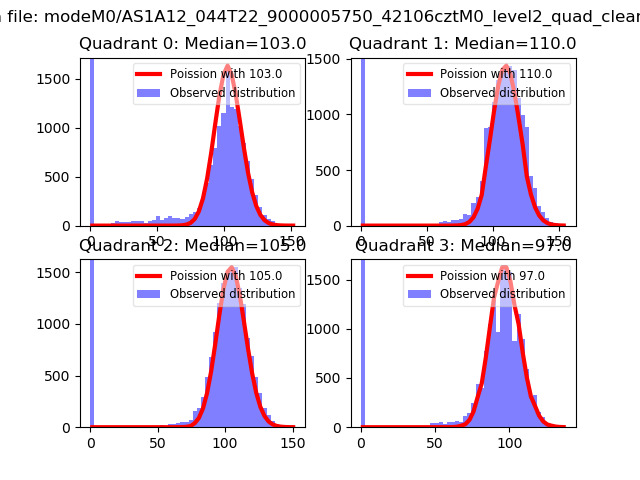 |
 |
| Quadrant-wise count rates Data is divided into 100 sec bins |
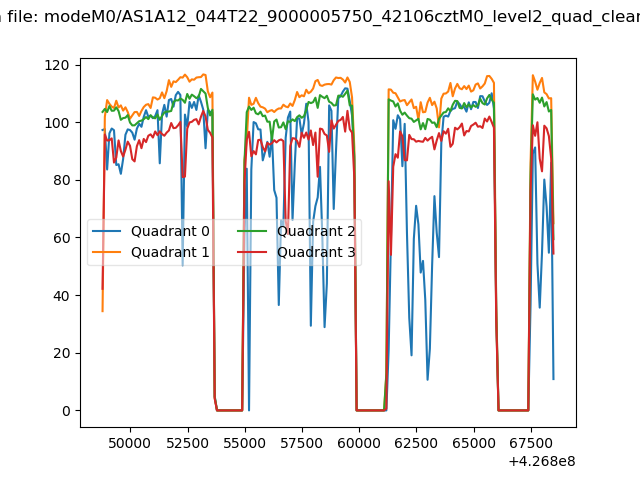 |
|
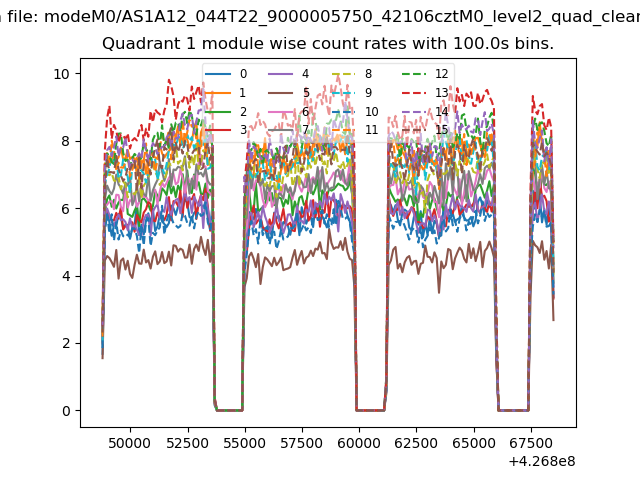
| Module-wise count rates for Quadrant A Data is divided into 100 sec bins |
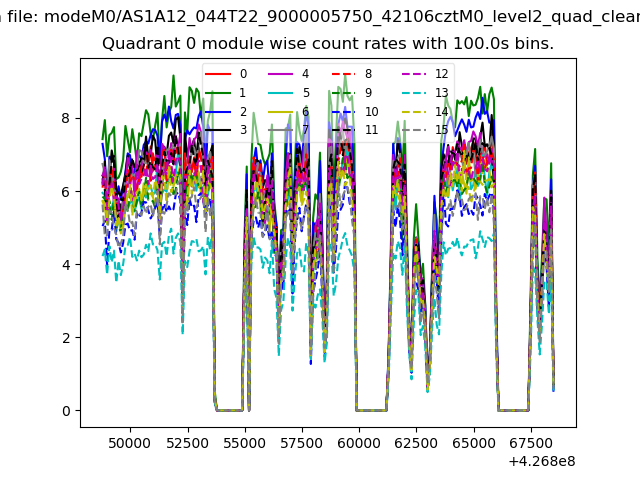 |
 |
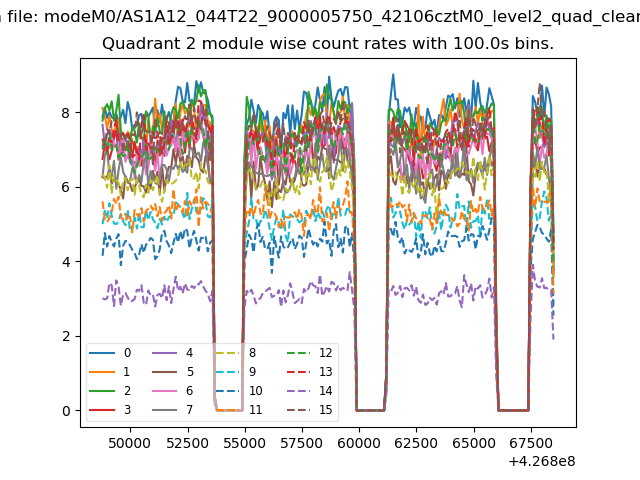
| Module-wise count rates for Quadrant B Data is divided into 100 sec bins |
 |
 |
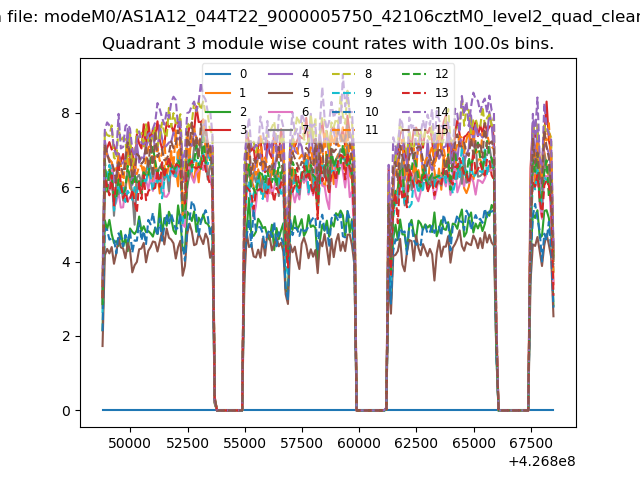
| Module-wise count rates for Quadrant C Data is divided into 100 sec bins |
 |
 |
| Module-wise count rates for Quadrant D Data is divided into 100 sec bins |
 |
 |
| Parameter | Plot |
|---|---|
| CZT HV Monitor | 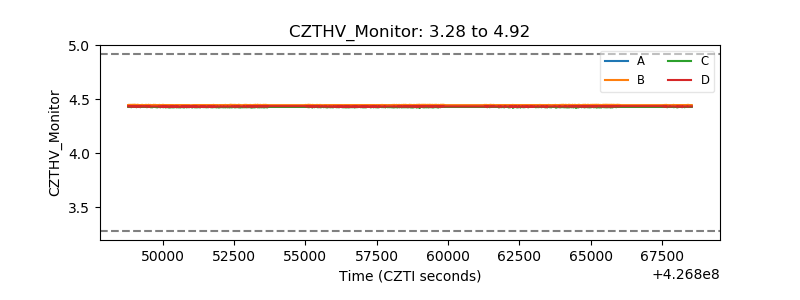 |
| D_VDD | 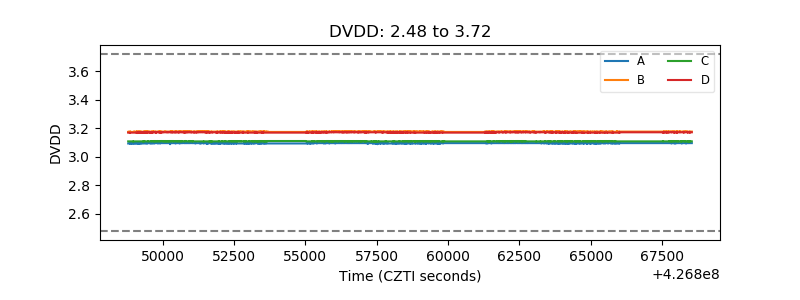 |
| Temperature 1 | 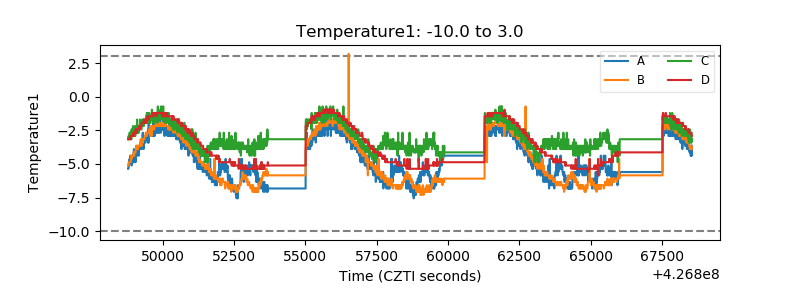 |
| Veto HV Monitor | 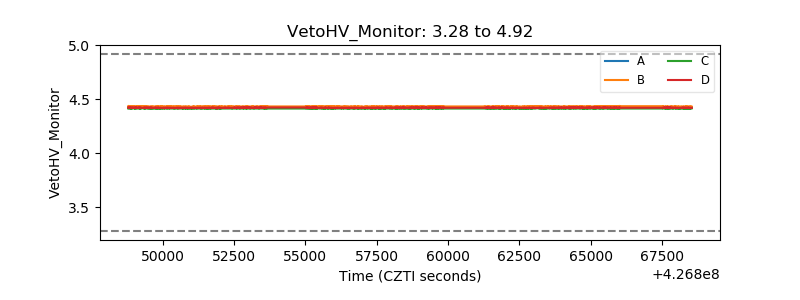 |
| Veto LLD | 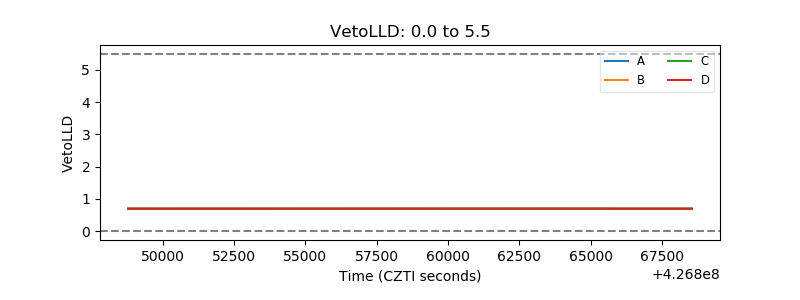 |
| Alpha Counter | 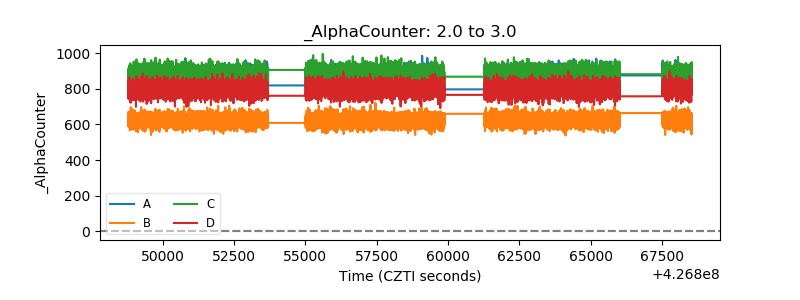 |
| _CPM_Rate | 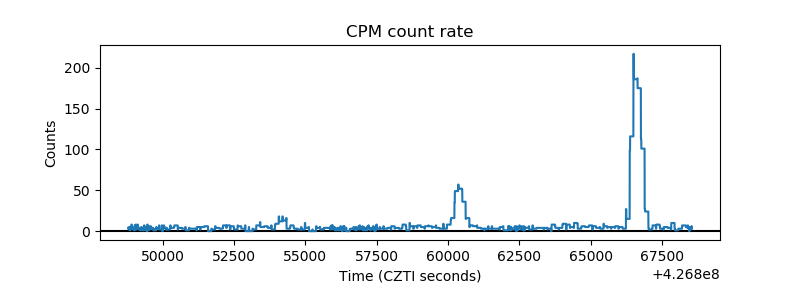 |
| CZT Counter | 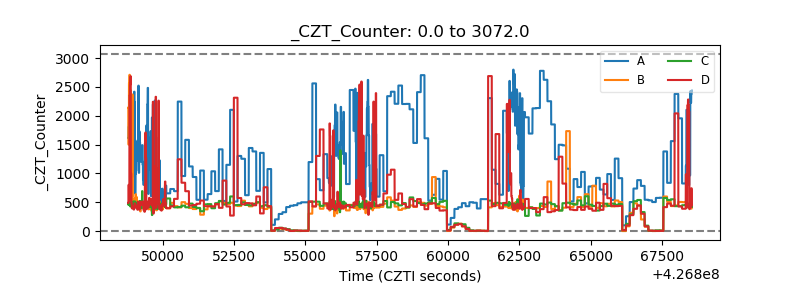 |
| +2.5 Volts monitor | 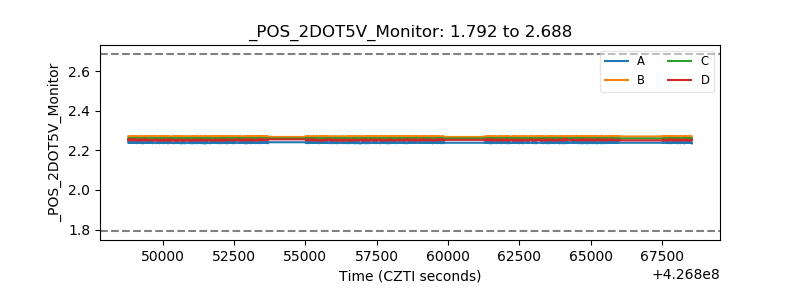 |
| +5 Volts monitor | 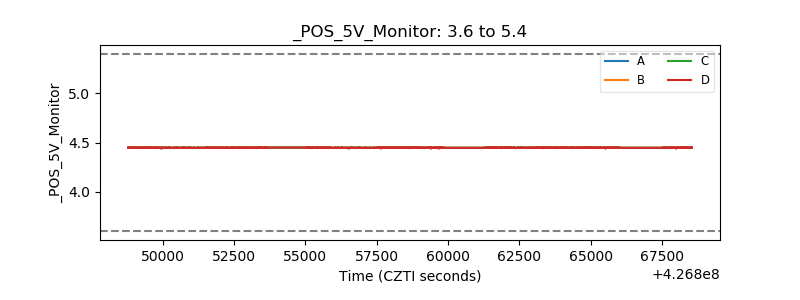 |
| _ROLL_ROT | 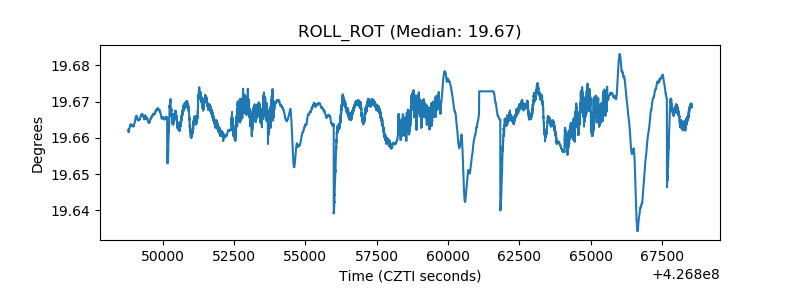 |
| _Roll_DEC | 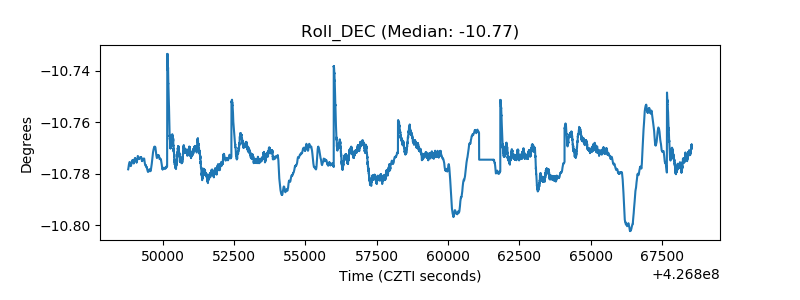 |
| _Roll_RA | 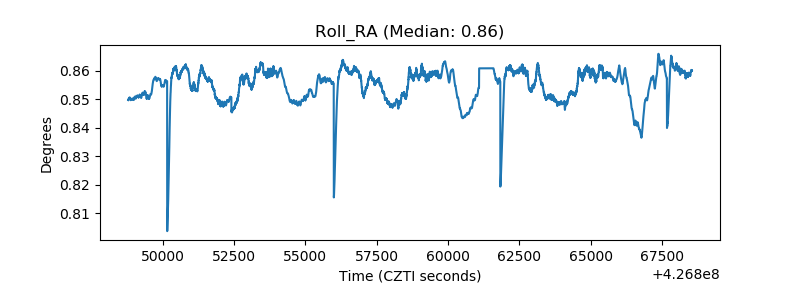 |
| Veto Counter | 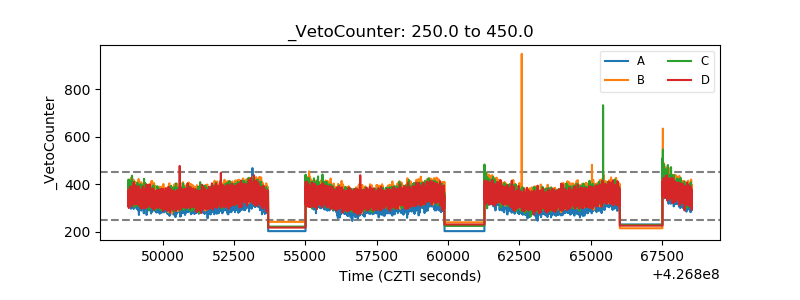 |