| Param | Original file | Final file |
|---|---|---|
| Filename | modeM0/AS1A12_044T22_9000005750_42107cztM0_level2.fits | modeM0/AS1A12_044T22_9000005750_42107cztM0_level2_quad_clean.evt |
| Size (bytes) | 428,731,200 | 87,906,240 |
| Size | 408.9 MB | 83.8 MB |
| Events in quadrant A | 6,560,777 | 529,677 |
| Events in quadrant B | 2,703,156 | 620,522 |
| Events in quadrant C | 2,593,980 | 591,640 |
| Events in quadrant D | 3,580,492 | 531,130 |
| Mode M0 | |||
|---|---|---|---|
| Quadrant | BADHDUFLAG | Total packets | Discarded packets |
| A | 0 | 23318 | 6 |
| B | 0 | 11848 | 2 |
| C | 0 | 11162 | 2 |
| D | 0 | 14619 | 2 |
| Mode M9 | |||
|---|---|---|---|
| Quadrant | BADHDUFLAG | Total packets | Discarded packets |
| A | 0 | 28 | 0 |
| B | 0 | 29 | 0 |
| C | 0 | 29 | 0 |
| D | 0 | 29 | 0 |
| Mode SS | |||
|---|---|---|---|
| Quadrant | BADHDUFLAG | Total packets | Discarded packets |
| A | 0 | 114 | 0 |
| B | 0 | 114 | 0 |
| C | 0 | 114 | 0 |
| D | 0 | 114 | 0 |
| Quadrant | Total seconds | Saturated seconds | Saturation percentage |
|---|---|---|---|
| A | 5551 | 979 | 17.636462% |
| B | 5551 | 61 | 1.098901% |
| C | 5551 | 5 | 0.090074% |
| D | 5551 | 257 | 4.629796% |
Noise dominated data is calculated using 1-second bins in cleaned event files. If a bin has >2000 counts, and if more than 50% of those come from <1% of pixels, then it is considered to be noise-dominated and hence unusable.
| Quadrant | # 1 sec bins | Bins with >0 counts | Bins with >2000 counts | High rate bins dominated by noise | Noise dominated (total time) | Noise dominated (detector-on time) | Marked lightcurve |
|---|---|---|---|---|---|---|---|
| A | 7195 | 5553 | 751 | 751 | 10.44% | 13.52% | 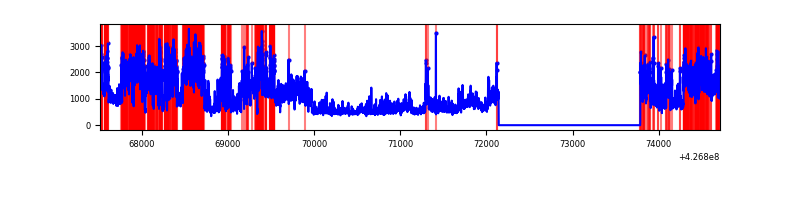 |
| B | 7195 | 5553 | 46 | 46 | 0.64% | 0.83% | 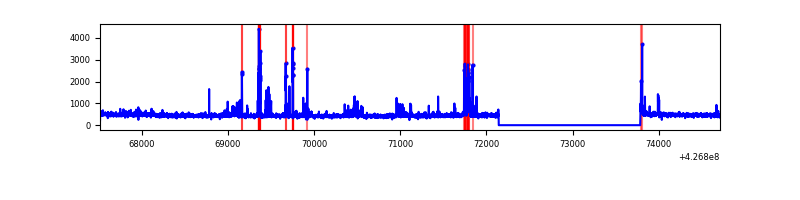 |
| C | 7195 | 5553 | 0 | 0 | 0.00% | 0.00% | 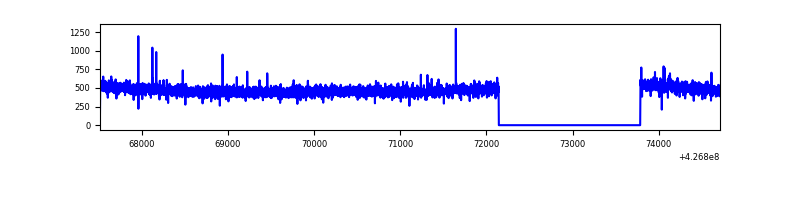 |
| D | 7195 | 5553 | 229 | 229 | 3.18% | 4.12% | 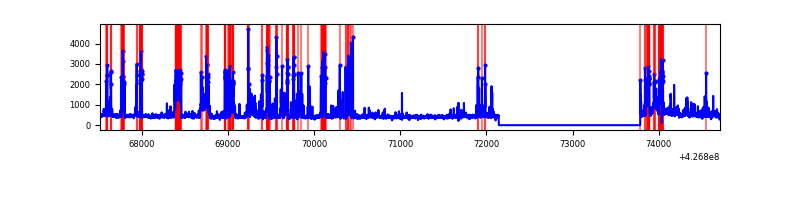 |
Top three noisy pixels from each quadrant. If the there are fewer than three noisy pixels in the level2.evt file, extra rows are filled as -1
| Pixel properties | Quadrant properties | ||||||
|---|---|---|---|---|---|---|---|
| Quadrant | DetID | PixID | Counts | Sigma | Mean | Median | Sigma |
| A | 15 | 222 | 3049642 | 24921.59 | 593 | 581 | 122.3 |
| A | 15 | 223 | 667465 | 5450.8 | 593 | 581 | 122.3 |
| A | 10 | 83 | 541637 | 4422.34 | 593 | 581 | 122.3 |
| B | 5 | 255 | 256220 | 2135.04 | 613 | 595 | 119.7 |
| B | 15 | 85 | 23847 | 194.21 | 613 | 595 | 119.7 |
| B | 12 | 111 | 15408 | 123.72 | 613 | 595 | 119.7 |
| C | 15 | 214 | 231336 | 1620.08 | 605 | 608 | 142.4 |
| C | 7 | 220 | 4352 | 26.29 | 605 | 608 | 142.4 |
| C | 13 | 61 | 3979 | 23.67 | 605 | 608 | 142.4 |
| D | 13 | 249 | 810177 | 5465.75 | 598 | 579 | 148.1 |
| D | 1 | 52 | 214422 | 1443.7 | 598 | 579 | 148.1 |
| D | 12 | 6 | 171280 | 1152.44 | 598 | 579 | 148.1 |
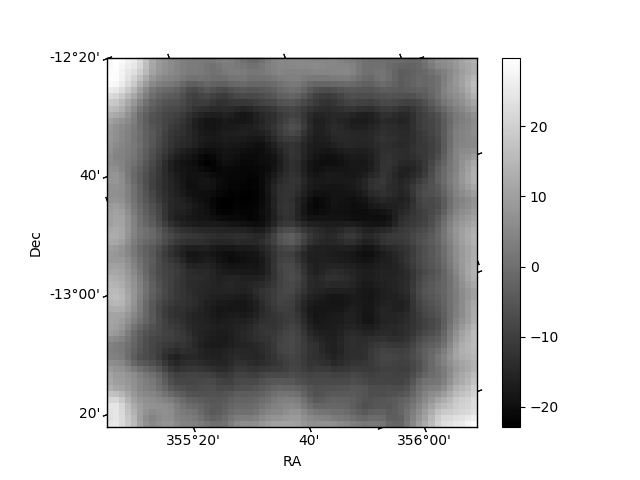
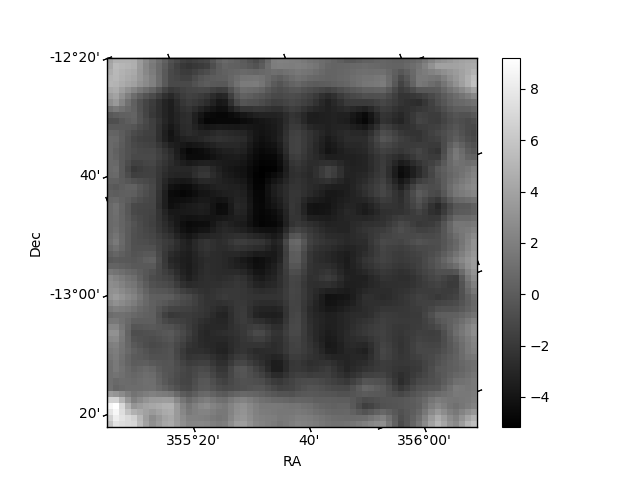
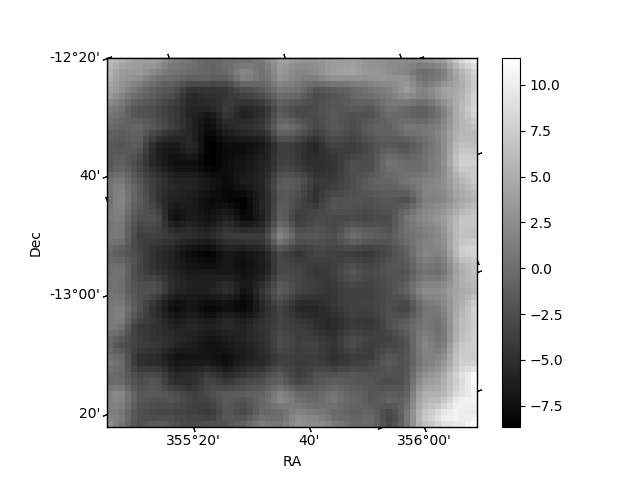
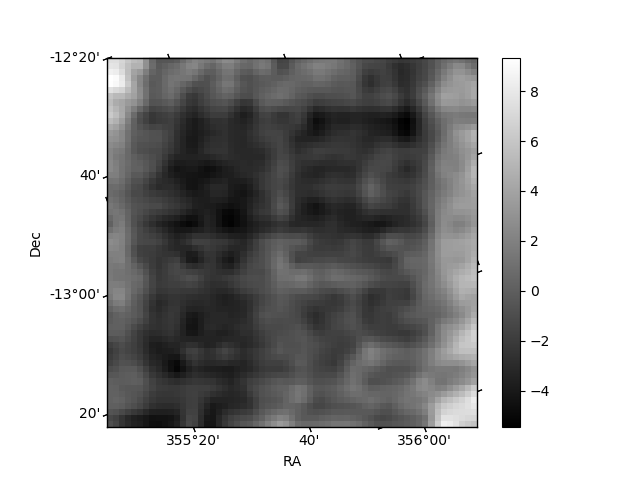
Histogram calculated using DETX and DETY for each event in the final _common_clean file
| Quadrant A | 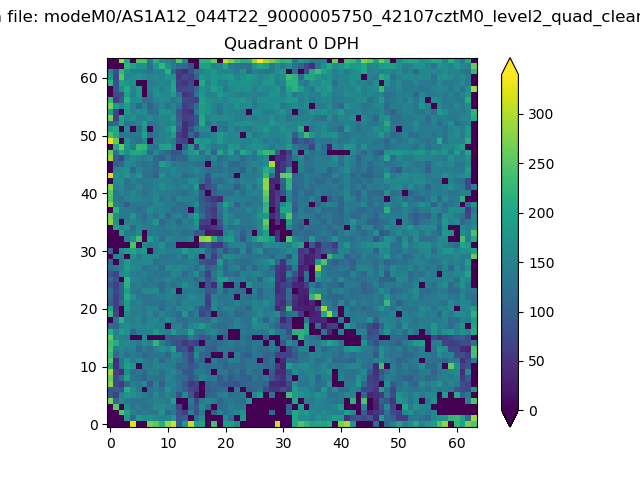 |
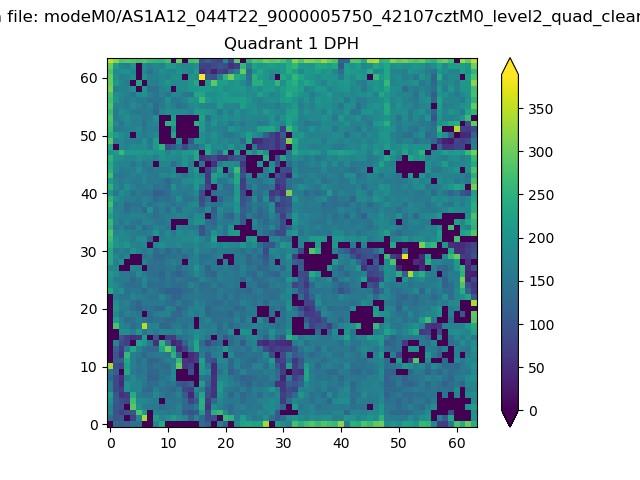 |
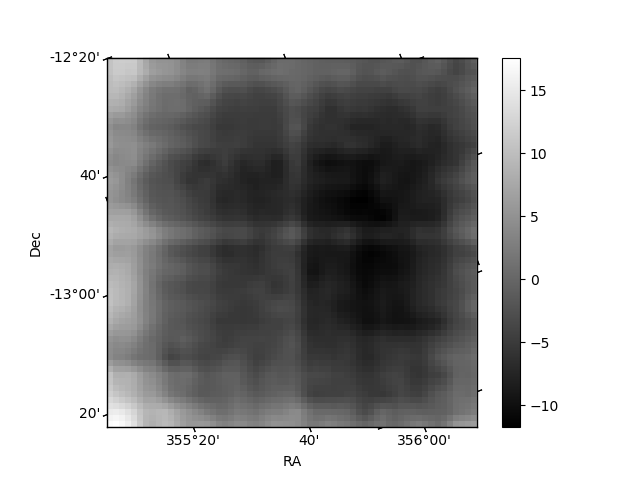
Quadrant B |
|---|---|---|---|
| Quadrant D | 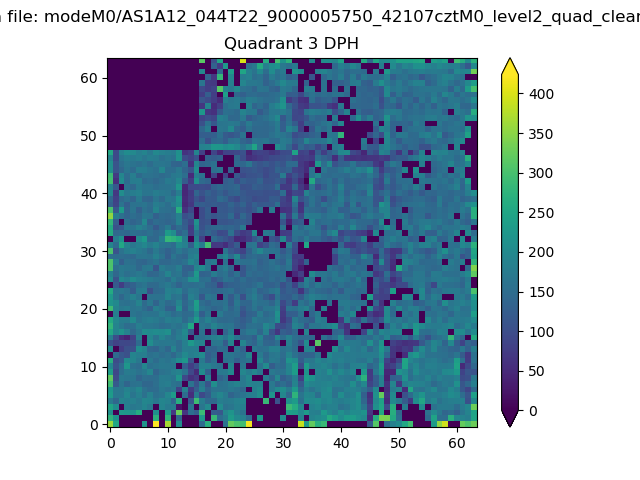 |
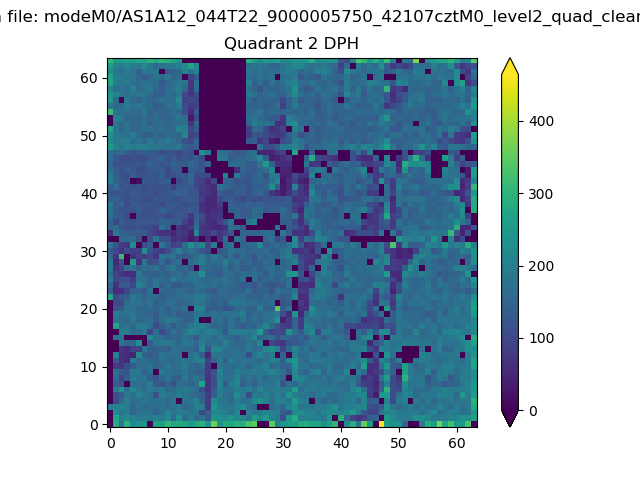 |
Quadrant C |
| Plot type | Count rate plots | Images |
|---|---|---|
| Comparison with Poisson distribution Blue bars denote a histogram of data divided into 1 sec bins. Red curve is a Poisson curve with rate = median count rate of data. |
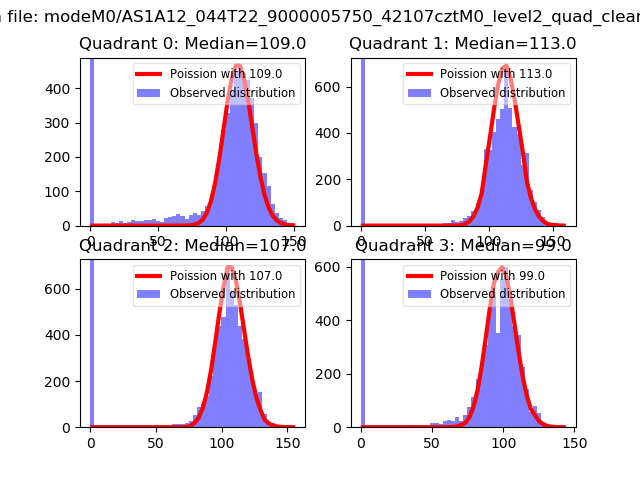 |
 |
| Quadrant-wise count rates Data is divided into 100 sec bins |
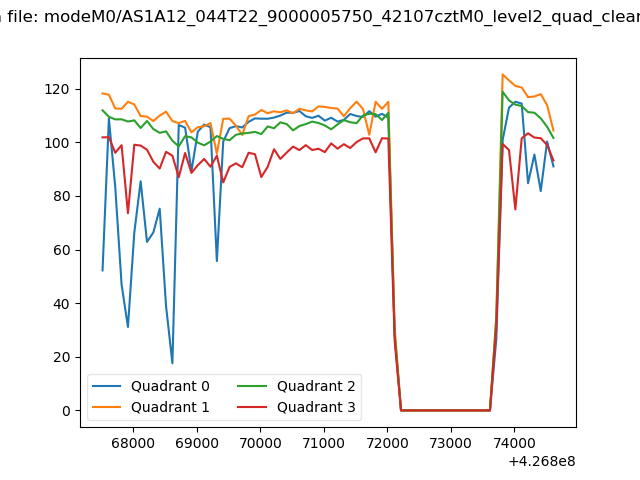 |
|
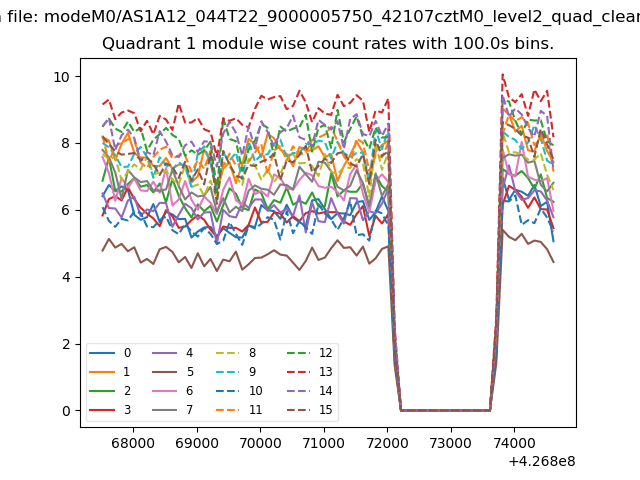
| Module-wise count rates for Quadrant A Data is divided into 100 sec bins |
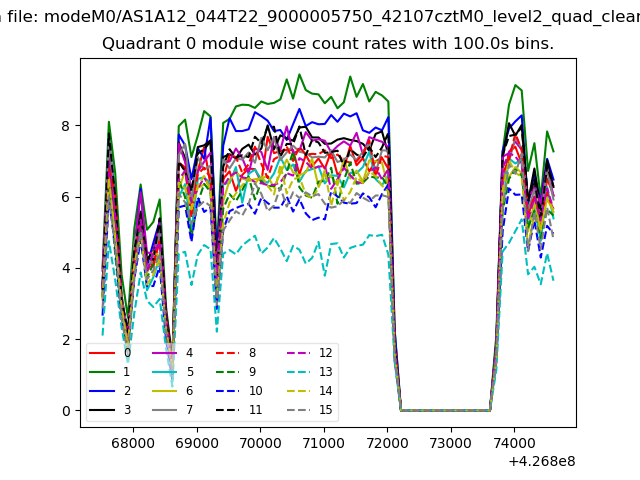 |
 |
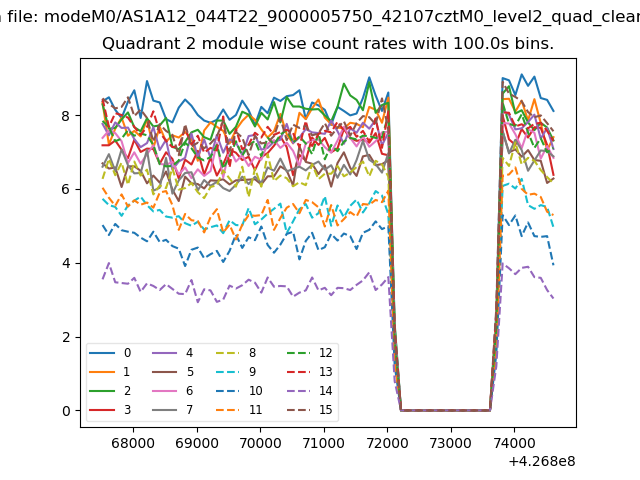
| Module-wise count rates for Quadrant B Data is divided into 100 sec bins |
 |
 |
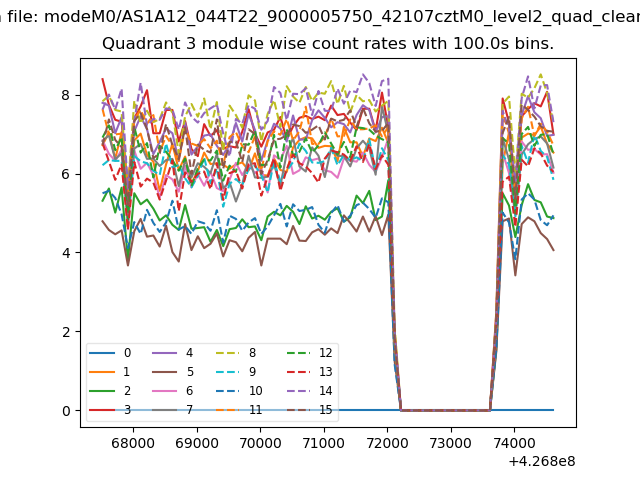
| Module-wise count rates for Quadrant C Data is divided into 100 sec bins |
 |
 |
| Module-wise count rates for Quadrant D Data is divided into 100 sec bins |
 |
 |
| Parameter | Plot |
|---|---|
| CZT HV Monitor | 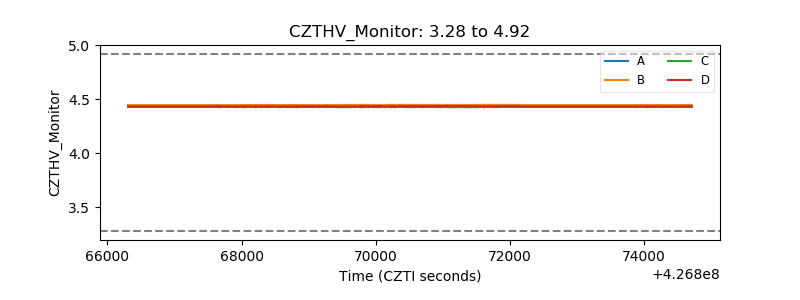 |
| D_VDD | 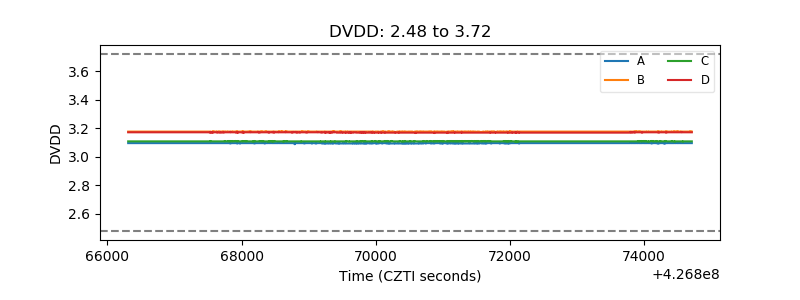 |
| Temperature 1 | 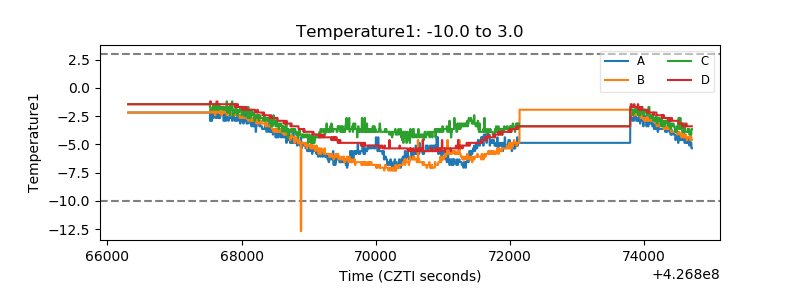 |
| Veto HV Monitor | 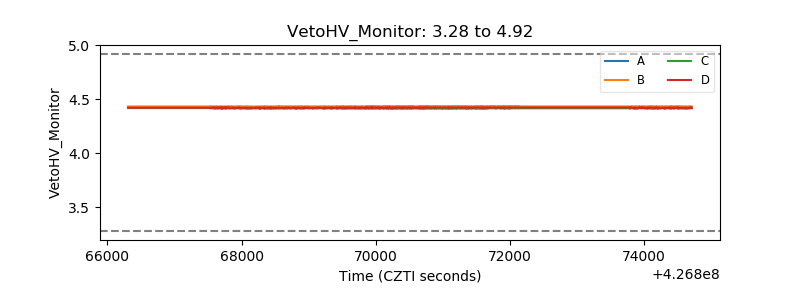 |
| Veto LLD | 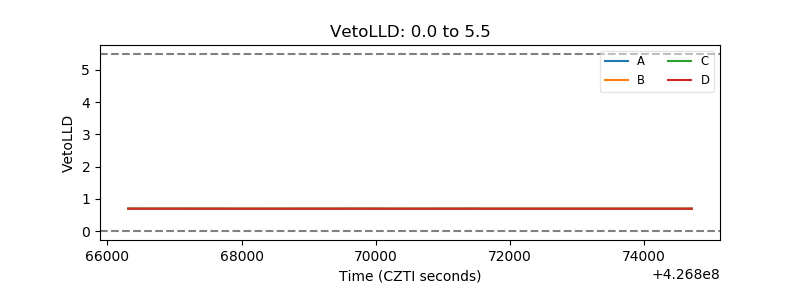 |
| Alpha Counter | 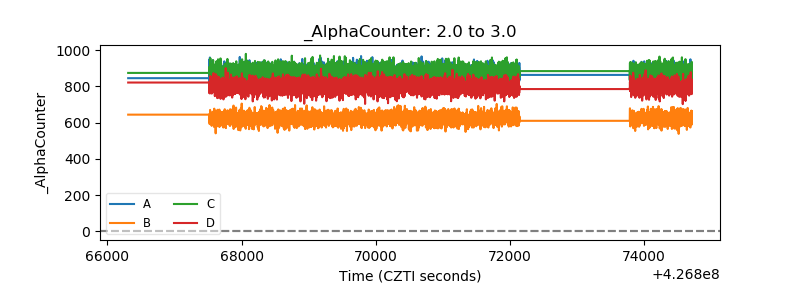 |
| _CPM_Rate |  |
| CZT Counter | 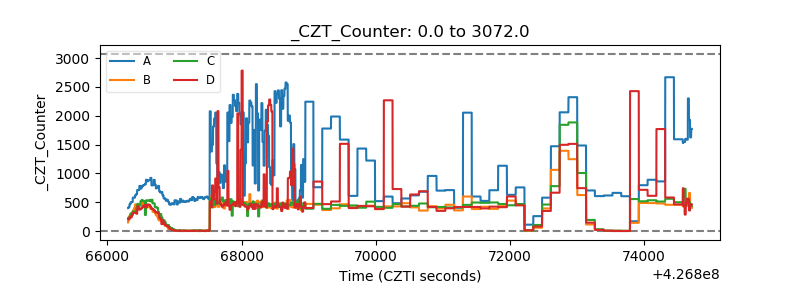 |
| +2.5 Volts monitor | 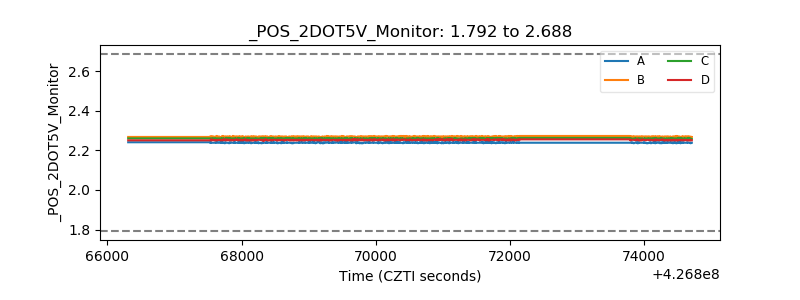 |
| +5 Volts monitor | 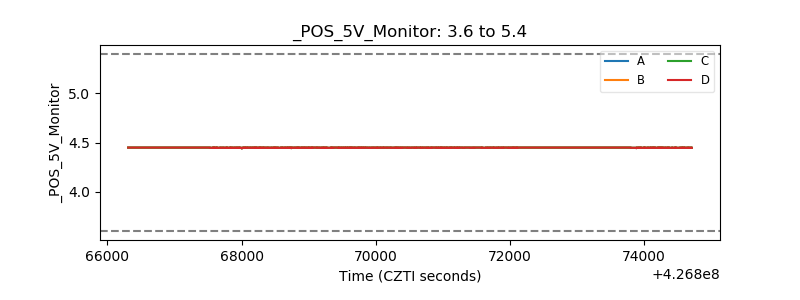 |
| _ROLL_ROT |  |
| _Roll_DEC | 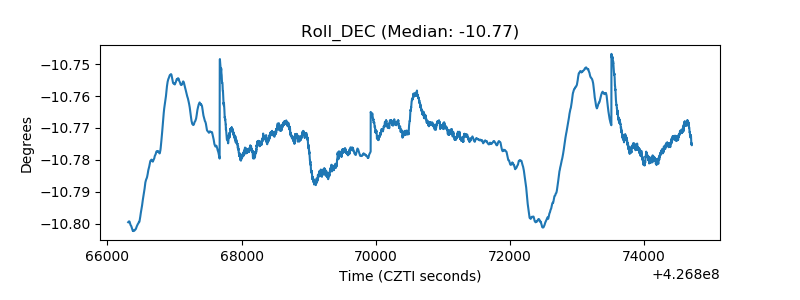 |
| _Roll_RA | 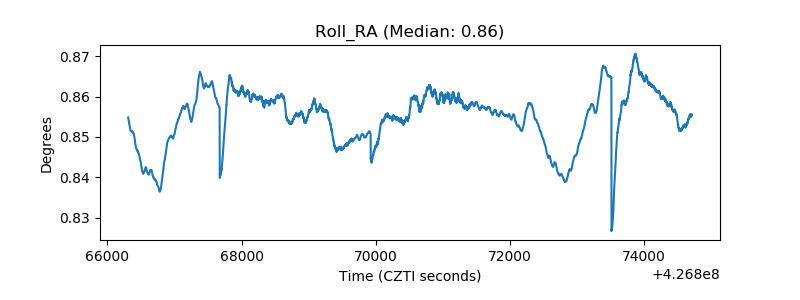 |
| Veto Counter | 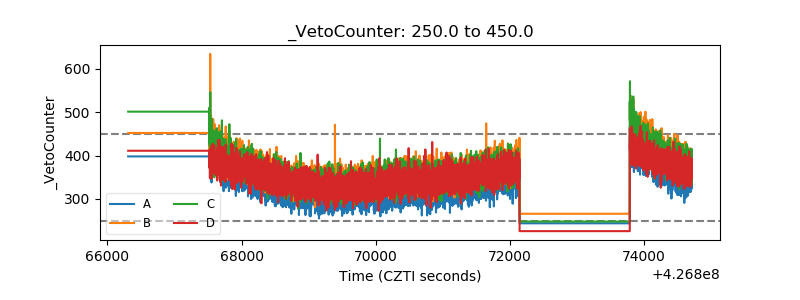 |