| Param | Original file | Final file |
|---|---|---|
| Filename | modeM0/AS1A12_044T22_9000005750_42109cztM0_level2.fits | modeM0/AS1A12_044T22_9000005750_42109cztM0_level2_quad_clean.evt |
| Size (bytes) | 401,794,560 | 87,514,560 |
| Size | 383.2 MB | 83.5 MB |
| Events in quadrant A | 6,585,382 | 548,527 |
| Events in quadrant B | 2,404,413 | 617,226 |
| Events in quadrant C | 2,512,051 | 583,351 |
| Events in quadrant D | 2,960,167 | 530,350 |
| Mode M0 | |||
|---|---|---|---|
| Quadrant | BADHDUFLAG | Total packets | Discarded packets |
| A | 0 | 23293 | 2 |
| B | 0 | 10801 | 2 |
| C | 0 | 10684 | 3 |
| D | 0 | 12558 | 2 |
| Mode M9 | |||
|---|---|---|---|
| Quadrant | BADHDUFLAG | Total packets | Discarded packets |
| A | 0 | 32 | 0 |
| B | 0 | 33 | 0 |
| C | 0 | 33 | 0 |
| D | 0 | 33 | 0 |
| Mode SS | |||
|---|---|---|---|
| Quadrant | BADHDUFLAG | Total packets | Discarded packets |
| A | 0 | 108 | 0 |
| B | 0 | 108 | 0 |
| C | 0 | 108 | 0 |
| D | 0 | 108 | 0 |
| Quadrant | Total seconds | Saturated seconds | Saturation percentage |
|---|---|---|---|
| A | 5289 | 713 | 13.480809% |
| B | 5289 | 12 | 0.226886% |
| C | 5288 | 3 | 0.056732% |
| D | 5288 | 107 | 2.023449% |
Noise dominated data is calculated using 1-second bins in cleaned event files. If a bin has >2000 counts, and if more than 50% of those come from <1% of pixels, then it is considered to be noise-dominated and hence unusable.
| Quadrant | # 1 sec bins | Bins with >0 counts | Bins with >2000 counts | High rate bins dominated by noise | Noise dominated (total time) | Noise dominated (detector-on time) | Marked lightcurve |
|---|---|---|---|---|---|---|---|
| A | 7052 | 5291 | 615 | 615 | 8.72% | 11.62% | 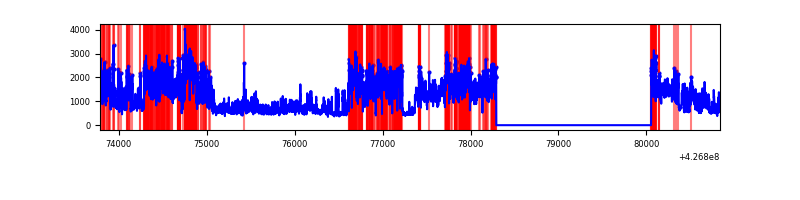 |
| B | 7052 | 5291 | 3 | 3 | 0.04% | 0.06% | 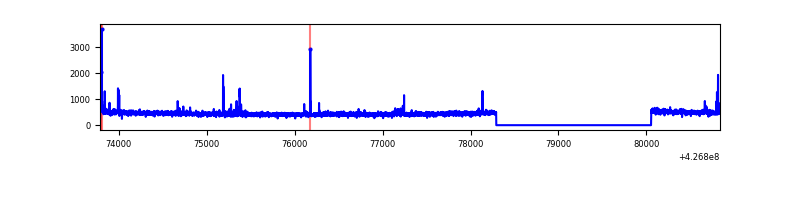 |
| C | 7051 | 5290 | 0 | 0 | 0.00% | 0.00% | 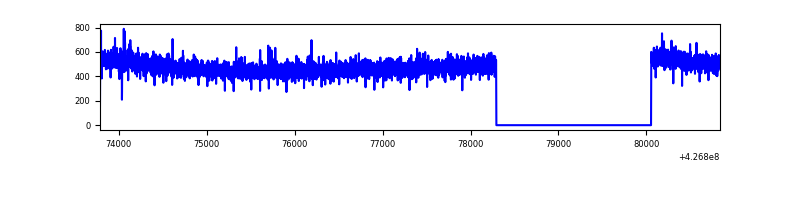 |
| D | 7051 | 5290 | 104 | 104 | 1.47% | 1.97% | 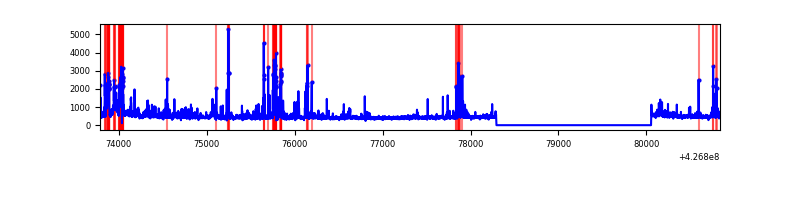 |
Top three noisy pixels from each quadrant. If the there are fewer than three noisy pixels in the level2.evt file, extra rows are filled as -1
| Pixel properties | Quadrant properties | ||||||
|---|---|---|---|---|---|---|---|
| Quadrant | DetID | PixID | Counts | Sigma | Mean | Median | Sigma |
| A | 15 | 222 | 3416813 | 28798.35 | 576 | 565 | 118.6 |
| A | 10 | 83 | 526805 | 4436.11 | 576 | 565 | 118.6 |
| A | 15 | 223 | 393462 | 3312.05 | 576 | 565 | 118.6 |
| B | 5 | 255 | 46019 | 390.0 | 593 | 576 | 116.5 |
| B | 15 | 85 | 23857 | 199.8 | 593 | 576 | 116.5 |
| B | 12 | 111 | 14482 | 119.34 | 593 | 576 | 116.5 |
| C | 15 | 214 | 221635 | 1611.52 | 584 | 588 | 137.2 |
| C | 10 | 91 | 6637 | 44.1 | 584 | 588 | 137.2 |
| C | 7 | 220 | 4032 | 25.11 | 584 | 588 | 137.2 |
| D | 13 | 249 | 405907 | 2862.49 | 578 | 561 | 141.6 |
| D | 12 | 6 | 173041 | 1218.03 | 578 | 561 | 141.6 |
| D | 1 | 52 | 67447 | 472.34 | 578 | 561 | 141.6 |
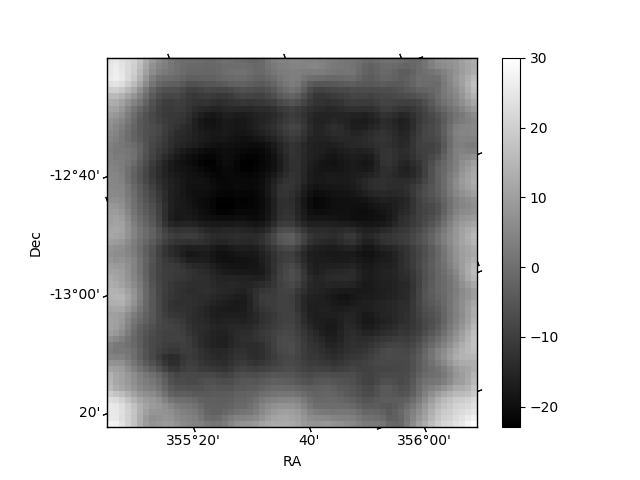
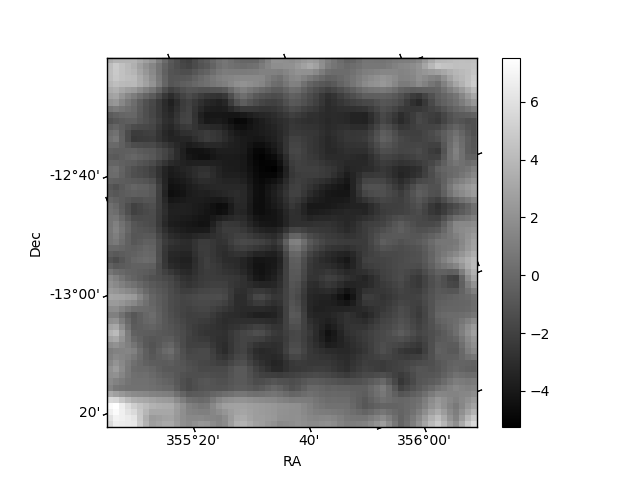
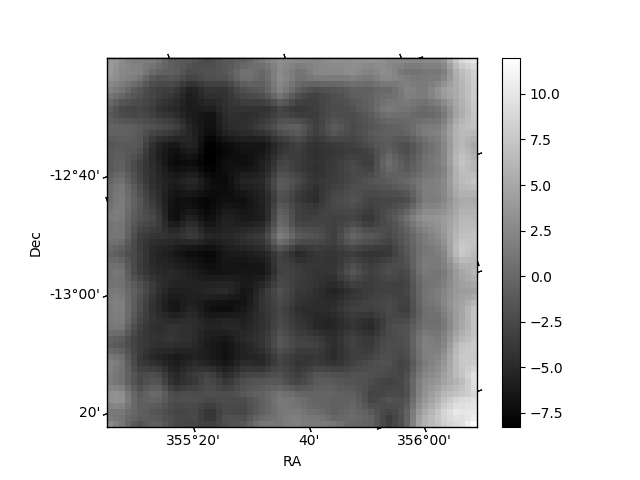
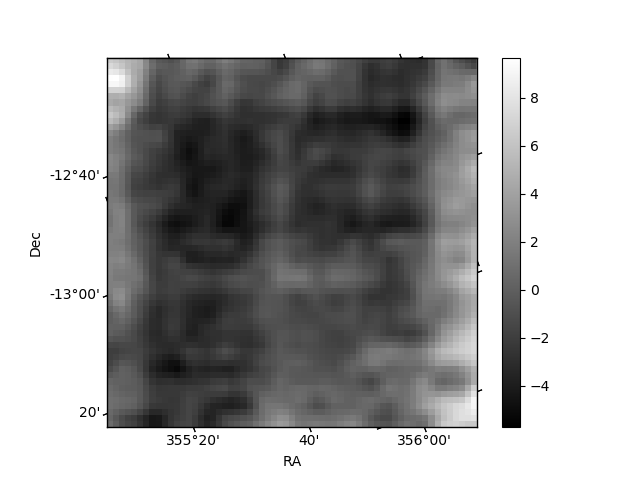
Histogram calculated using DETX and DETY for each event in the final _common_clean file
| Quadrant A | 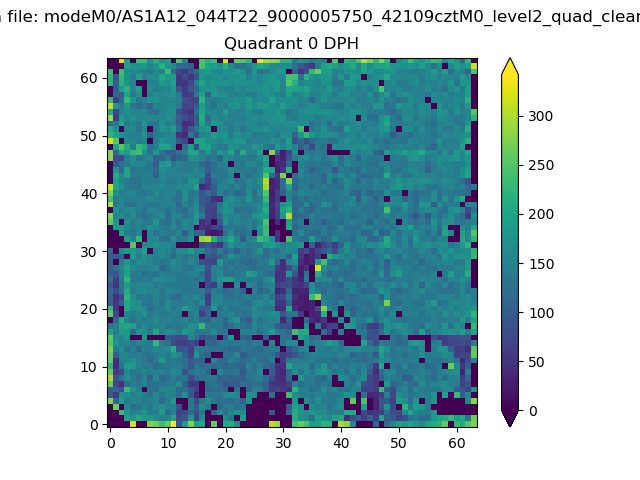 |
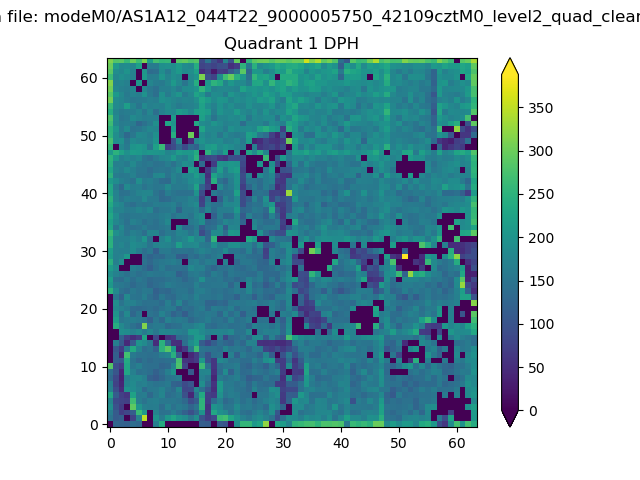 |
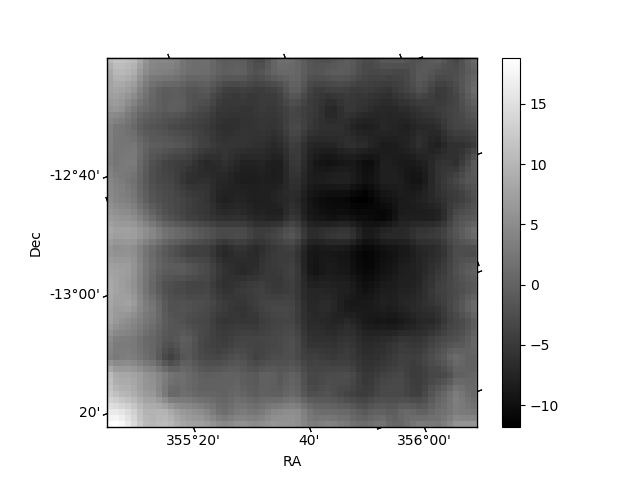
Quadrant B |
|---|---|---|---|
| Quadrant D | 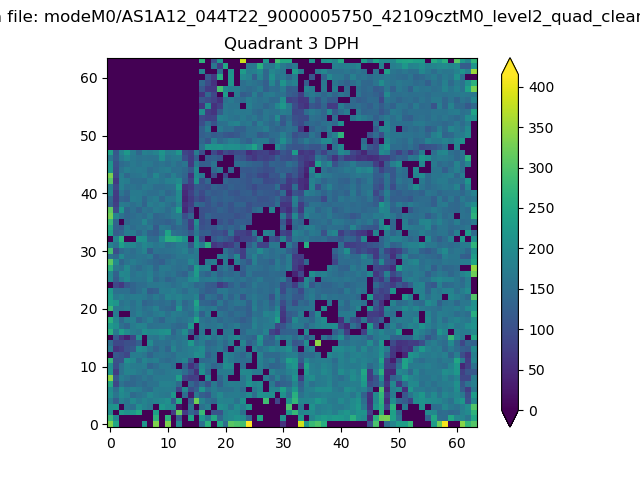 |
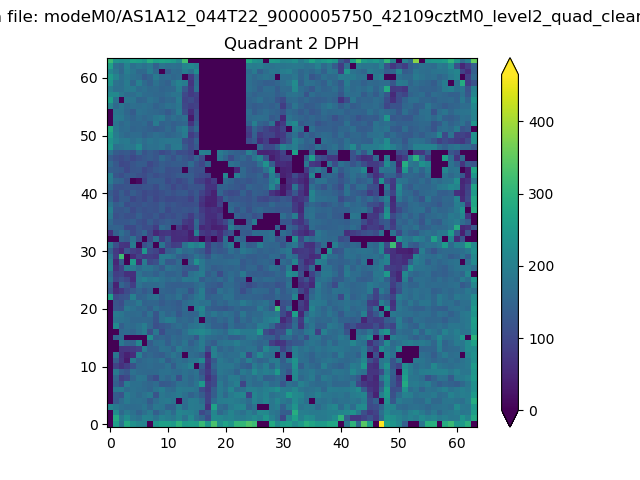 |
Quadrant C |
| Plot type | Count rate plots | Images |
|---|---|---|
| Comparison with Poisson distribution Blue bars denote a histogram of data divided into 1 sec bins. Red curve is a Poisson curve with rate = median count rate of data. |
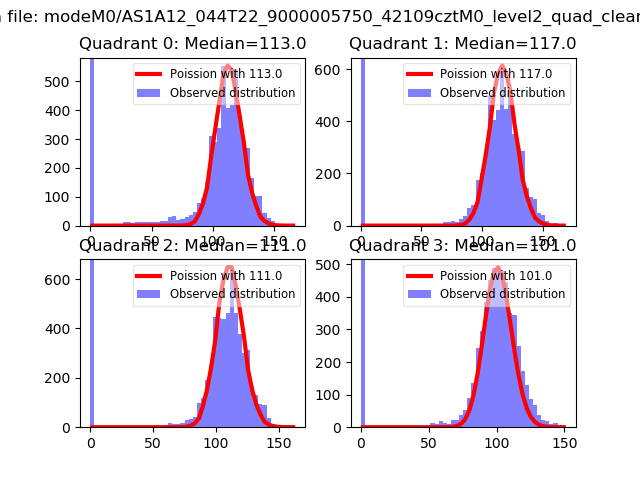 |
 |
| Quadrant-wise count rates Data is divided into 100 sec bins |
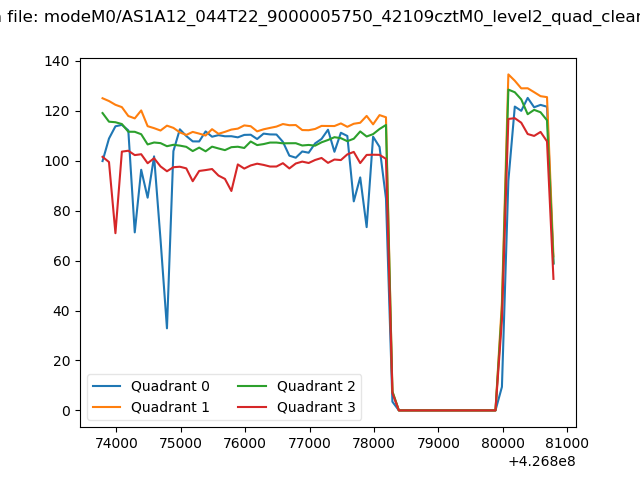 |
|
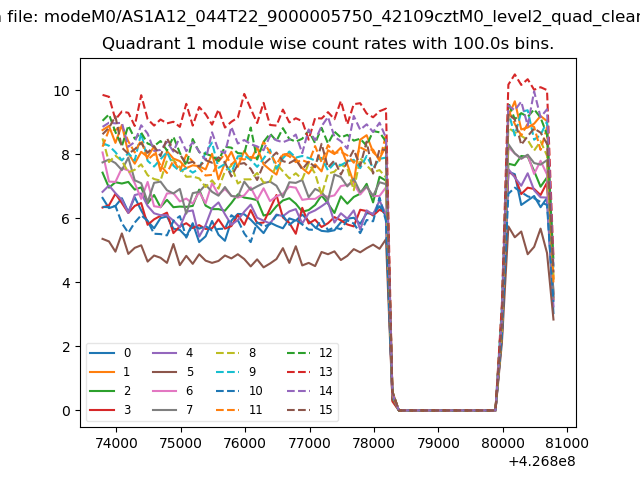
| Module-wise count rates for Quadrant A Data is divided into 100 sec bins |
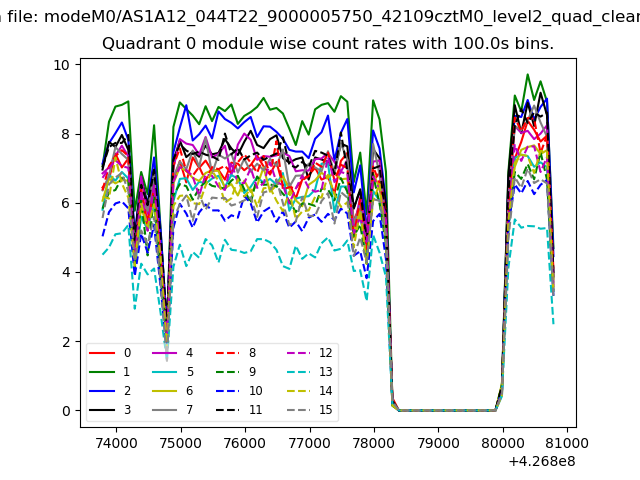 |
 |
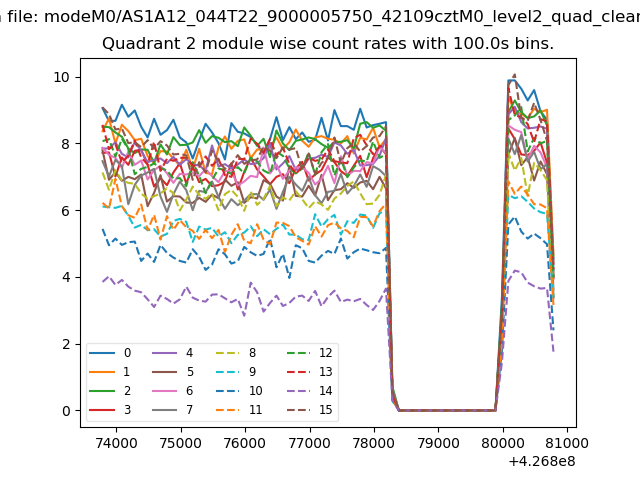
| Module-wise count rates for Quadrant B Data is divided into 100 sec bins |
 |
 |
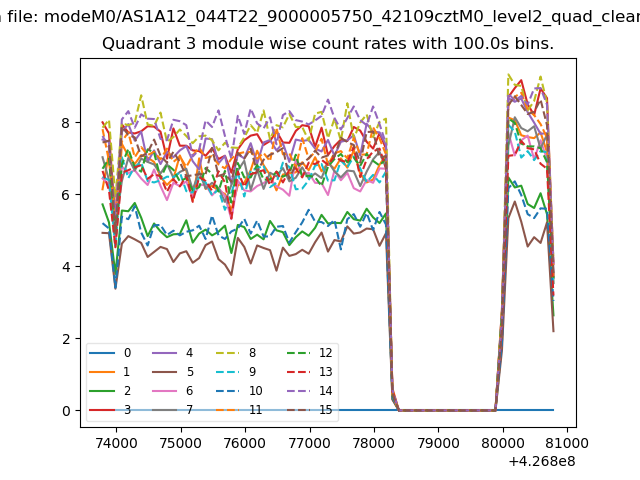
| Module-wise count rates for Quadrant C Data is divided into 100 sec bins |
 |
 |
| Module-wise count rates for Quadrant D Data is divided into 100 sec bins |
 |
 |
| Parameter | Plot |
|---|---|
| CZT HV Monitor | 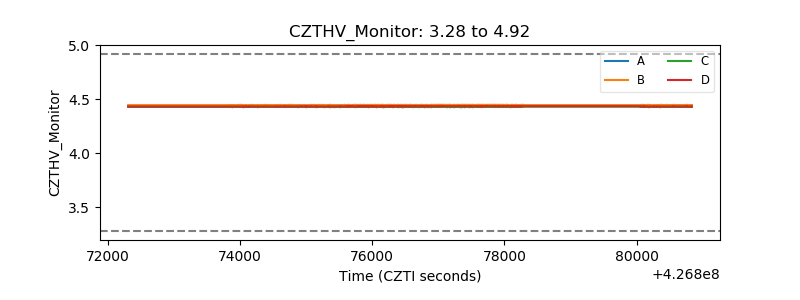 |
| D_VDD | 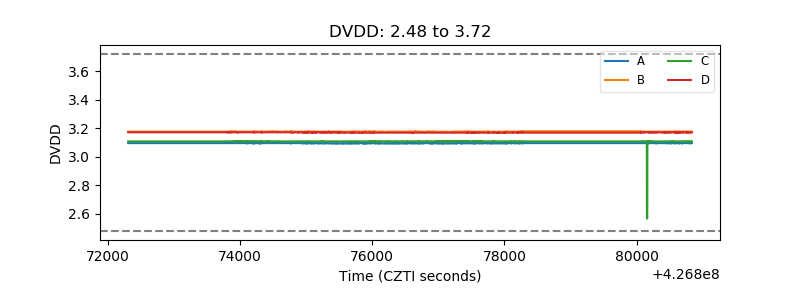 |
| Temperature 1 | 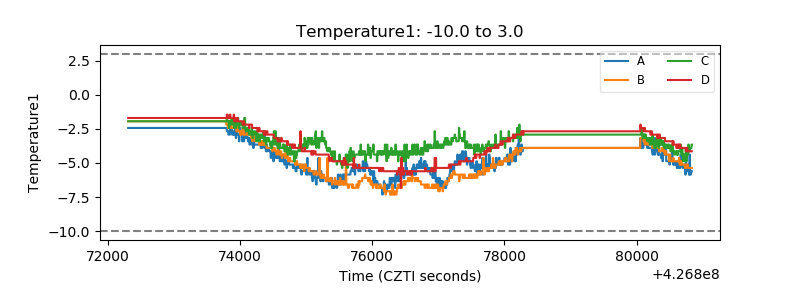 |
| Veto HV Monitor | 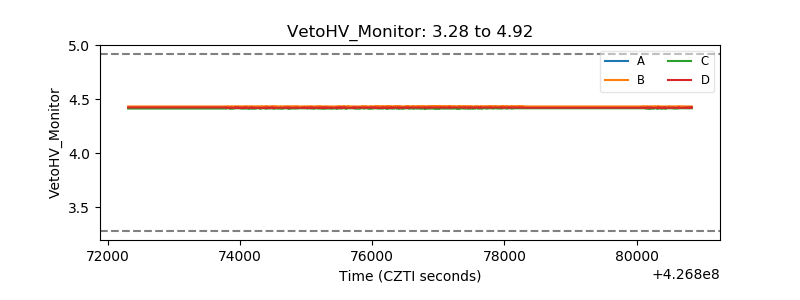 |
| Veto LLD | 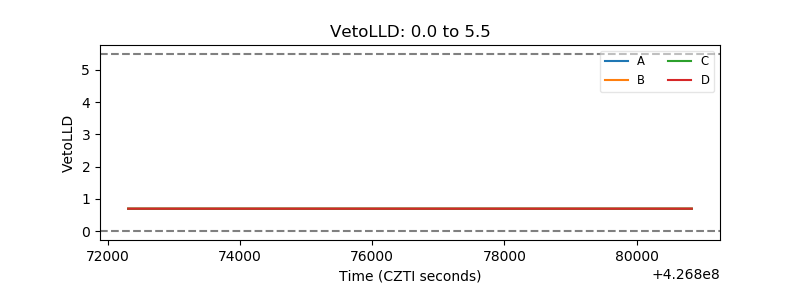 |
| Alpha Counter | 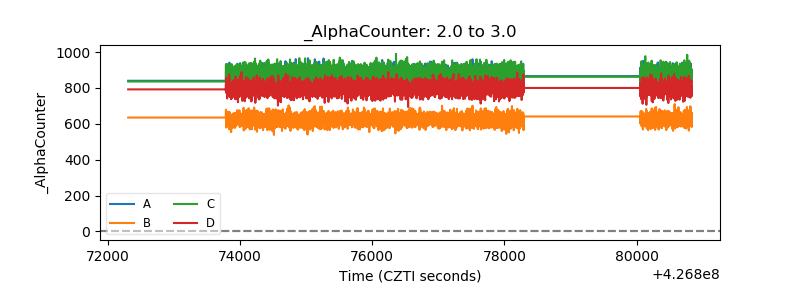 |
| _CPM_Rate | 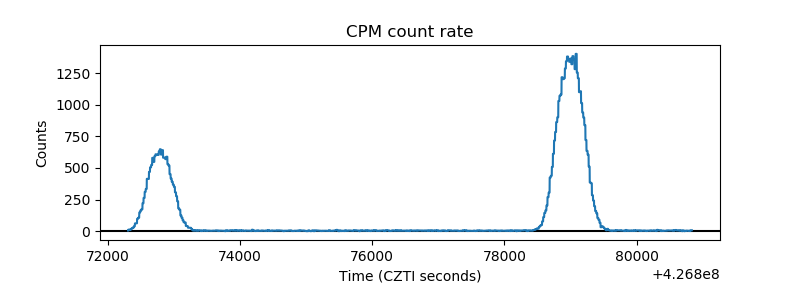 |
| CZT Counter | 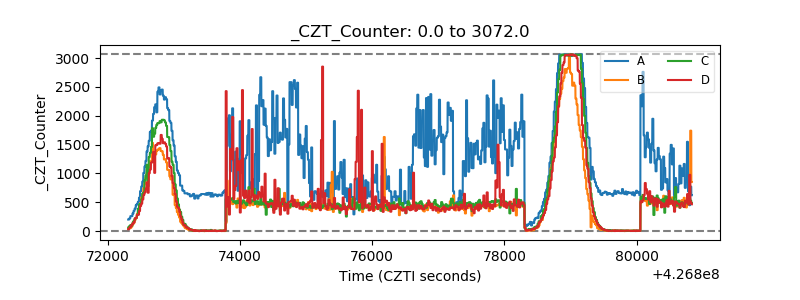 |
| +2.5 Volts monitor | 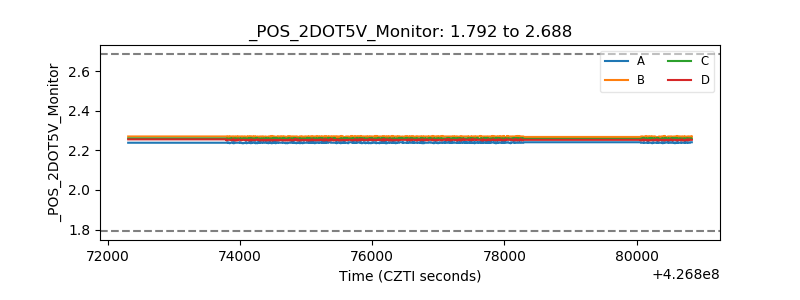 |
| +5 Volts monitor | 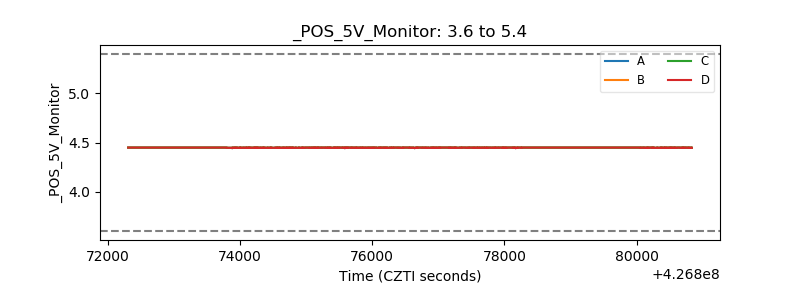 |
| _ROLL_ROT | 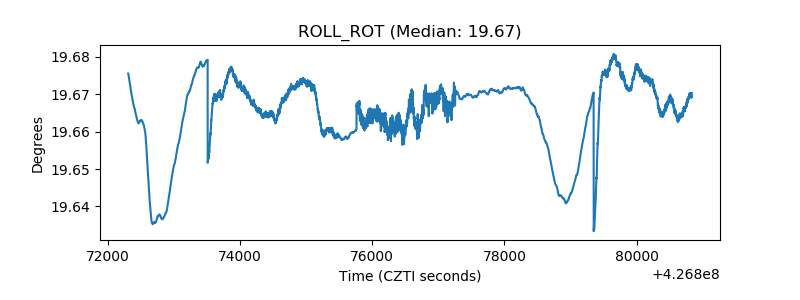 |
| _Roll_DEC | 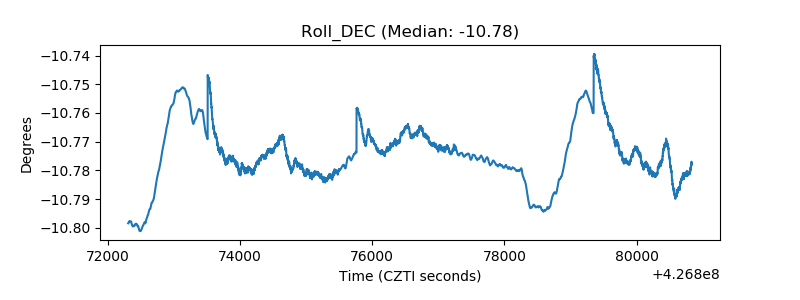 |
| _Roll_RA | 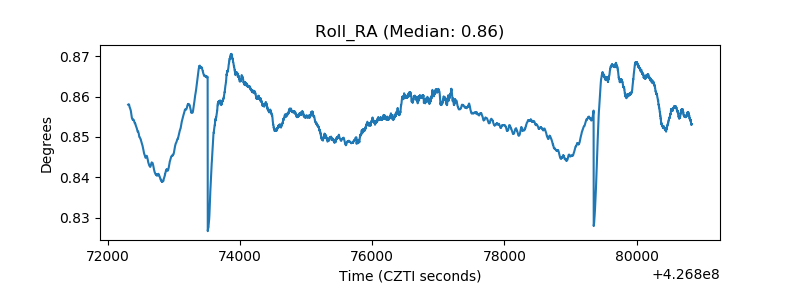 |
| Veto Counter | 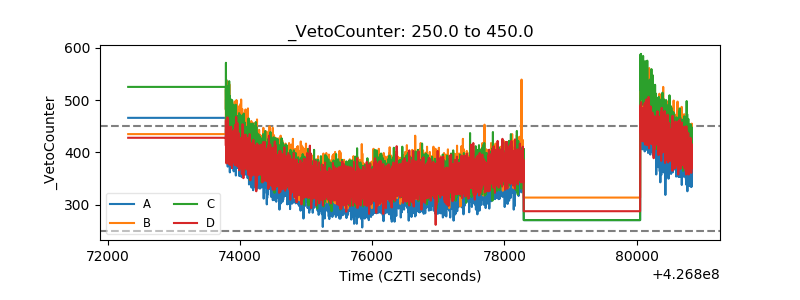 |